| Param | Original file | Final file |
|---|---|---|
| Filename | modeM0/AS1C09_003T01_9000006442_50372cztM0_level2.fits | modeM0/AS1C09_003T01_9000006442_50372cztM0_level2_quad_clean.evt |
| Size (bytes) | 803,436,480 | 91,293,120 |
| Size | 766.2 MB | 87.1 MB |
| Events in quadrant A | 4,647,287 | 651,273 |
| Events in quadrant B | 5,203,105 | 658,359 |
| Events in quadrant C | 8,868,978 | 520,779 |
| Events in quadrant D | 10,465,735 | 433,858 |
| Mode M9 | |||
|---|---|---|---|
| Quadrant | BADHDUFLAG | Total packets | Discarded packets |
| A | 0 | 16 | 0 |
| B | 0 | 16 | 0 |
| C | 0 | 16 | 0 |
| D | 0 | 16 | 0 |
| Mode M0 | |||
|---|---|---|---|
| Quadrant | BADHDUFLAG | Total packets | Discarded packets |
| A | 0 | 18504 | 2 |
| B | 0 | 20328 | 3 |
| C | 0 | 31331 | 2 |
| D | 0 | 36036 | 2 |
| Mode SS | |||
|---|---|---|---|
| Quadrant | BADHDUFLAG | Total packets | Discarded packets |
| A | 0 | 146 | 0 |
| B | 0 | 146 | 0 |
| C | 0 | 146 | 0 |
| D | 0 | 146 | 0 |
| Quadrant | Total seconds | Saturated seconds | Saturation percentage |
|---|---|---|---|
| A | 7182 | 219 | 3.049290% |
| B | 7182 | 704 | 9.802283% |
| C | 7182 | 1641 | 22.848789% |
| D | 7182 | 2287 | 31.843498% |
Noise dominated data is calculated using 1-second bins in cleaned event files. If a bin has >2000 counts, and if more than 50% of those come from <1% of pixels, then it is considered to be noise-dominated and hence unusable.
| Quadrant | # 1 sec bins | Bins with >0 counts | Bins with >2000 counts | High rate bins dominated by noise | Noise dominated (total time) | Noise dominated (detector-on time) | Marked lightcurve |
|---|---|---|---|---|---|---|---|
| A | 8712 | 7184 | 120 | 120 | 1.38% | 1.67% | 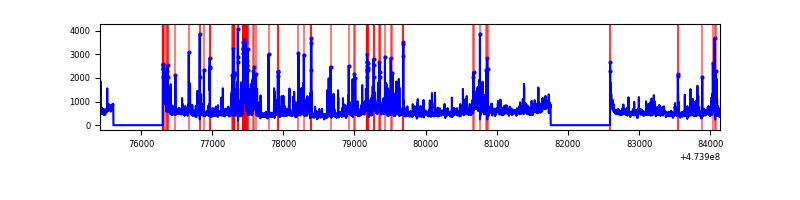 |
| B | 8712 | 7184 | 425 | 425 | 4.88% | 5.92% | 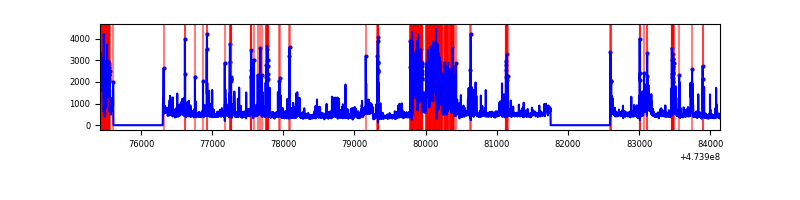 |
| C | 8712 | 7183 | 1449 | 1449 | 16.63% | 20.17% | 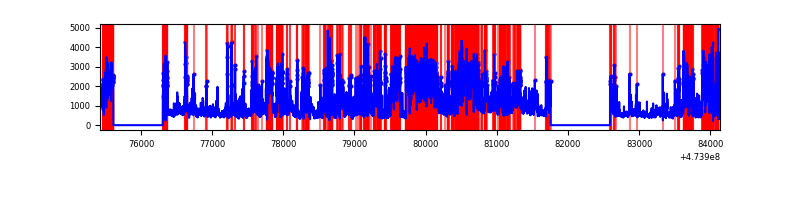 |
| D | 8712 | 7183 | 1925 | 1925 | 22.10% | 26.80% | 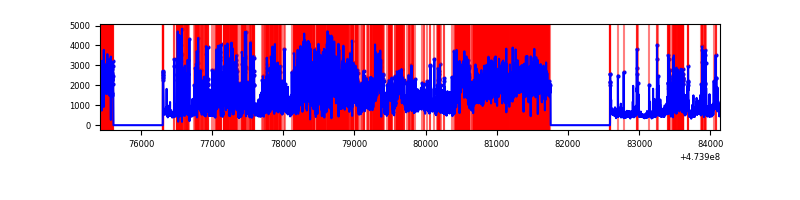 |
Top three noisy pixels from each quadrant. If the there are fewer than three noisy pixels in the level2.evt file, extra rows are filled as -1
| Pixel properties | Quadrant properties | ||||||
|---|---|---|---|---|---|---|---|
| Quadrant | DetID | PixID | Counts | Sigma | Mean | Median | Sigma |
| A | 8 | 247 | 309179 | 1627.19 | 765 | 746 | 189.5 |
| A | 8 | 38 | 168135 | 883.09 | 765 | 746 | 189.5 |
| A | 4 | 3 | 146510 | 769.0 | 765 | 746 | 189.5 |
| B | 5 | 172 | 1181248 | 7491.09 | 738 | 713 | 157.6 |
| B | 10 | 247 | 257214 | 1627.63 | 738 | 713 | 157.6 |
| B | 10 | 43 | 216852 | 1371.51 | 738 | 713 | 157.6 |
| C | 15 | 232 | 1649918 | 8484.1 | 691 | 687 | 194.4 |
| C | 15 | 234 | 598035 | 3072.92 | 691 | 687 | 194.4 |
| C | 0 | 225 | 421614 | 2165.36 | 691 | 687 | 194.4 |
| D | 7 | 61 | 2917076 | 16048.77 | 645 | 623 | 181.7 |
| D | 12 | 1 | 2799123 | 15399.69 | 645 | 623 | 181.7 |
| D | 6 | 191 | 330551 | 1815.54 | 645 | 623 | 181.7 |
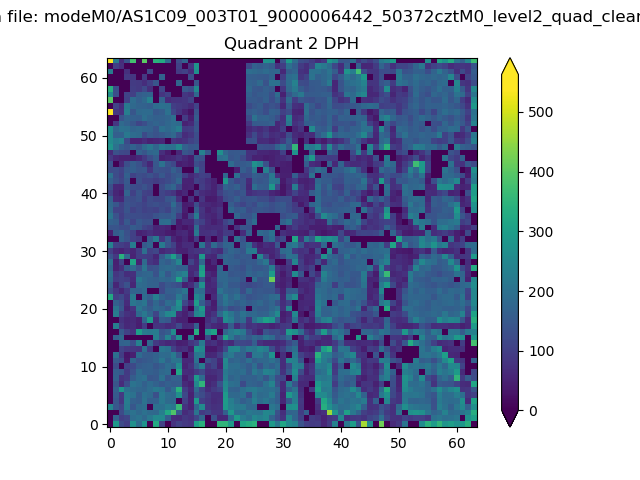
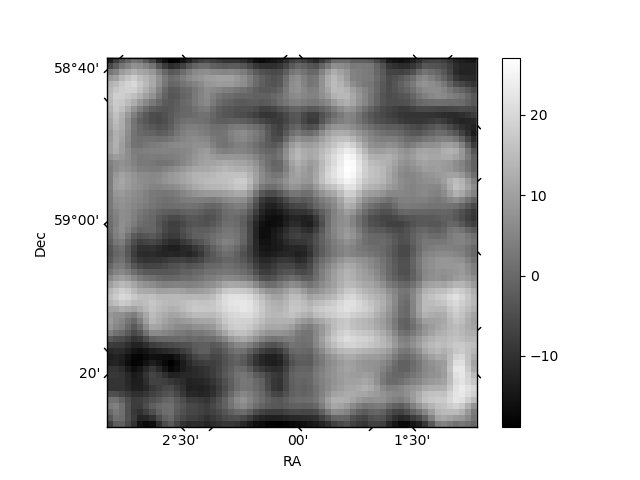
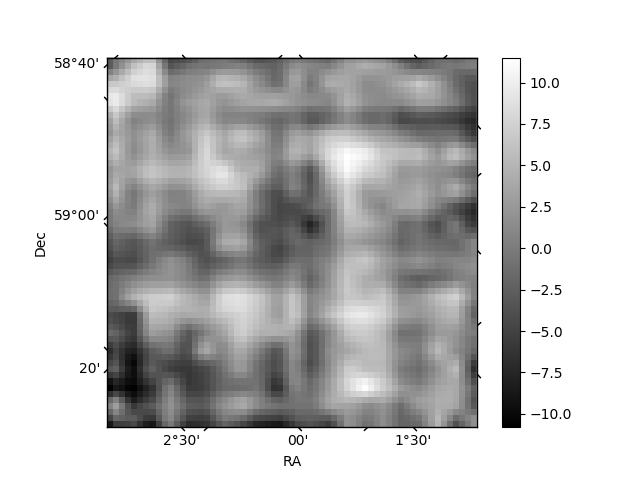
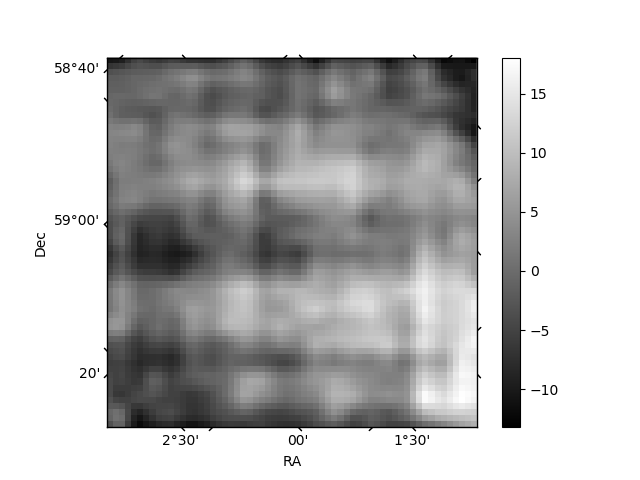
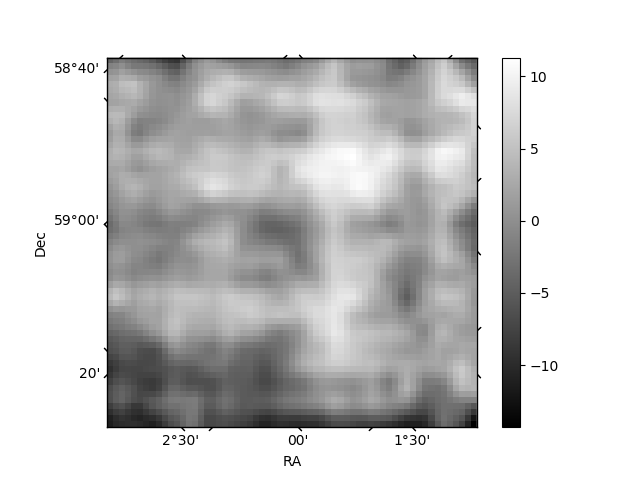
Histogram calculated using DETX and DETY for each event in the final _common_clean file
| Quadrant A | 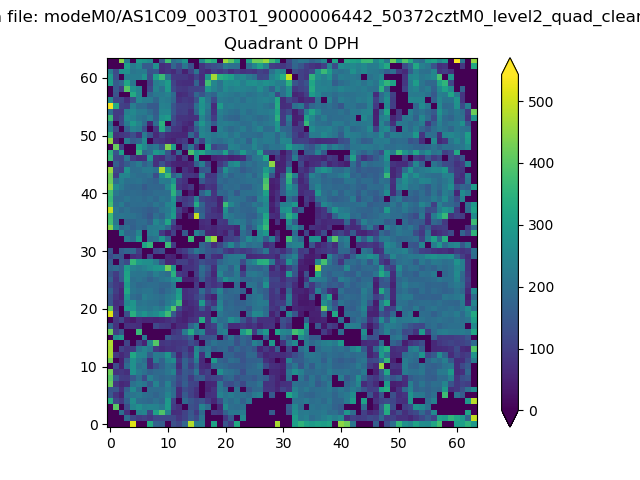 |
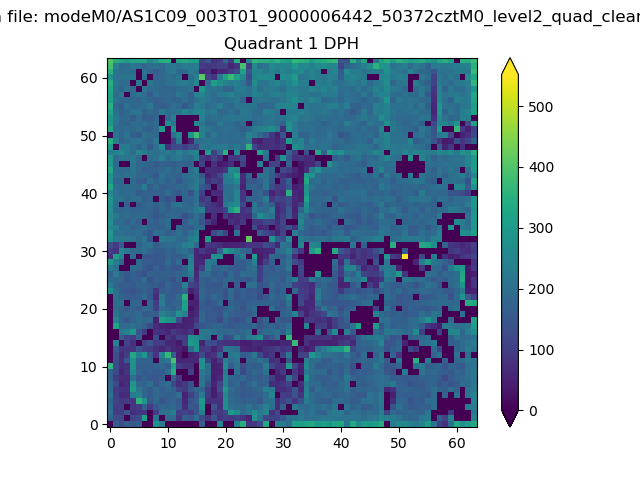 |
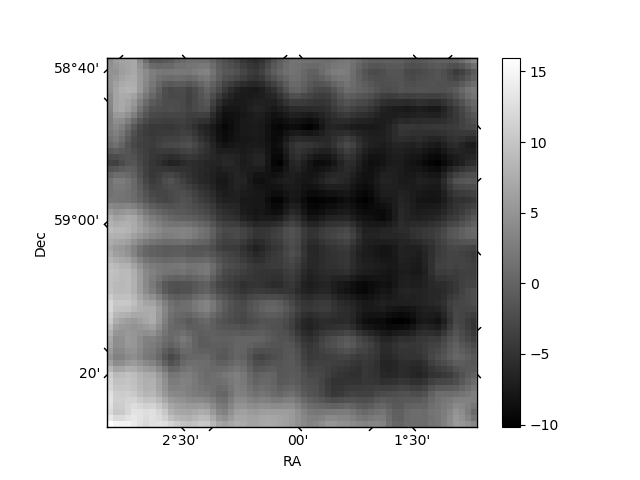
Quadrant B |
|---|---|---|---|
| Quadrant D | 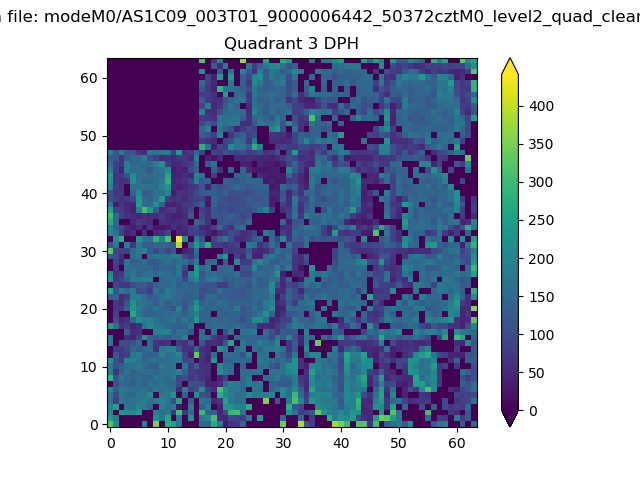 |
 |
Quadrant C |
| Plot type | Count rate plots | Images |
|---|---|---|
| Comparison with Poisson distribution Blue bars denote a histogram of data divided into 1 sec bins. Red curve is a Poisson curve with rate = median count rate of data. |
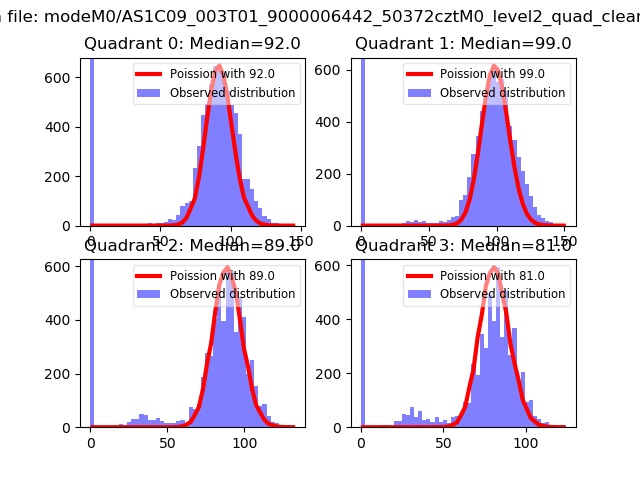 |
 |
| Quadrant-wise count rates Data is divided into 100 sec bins |
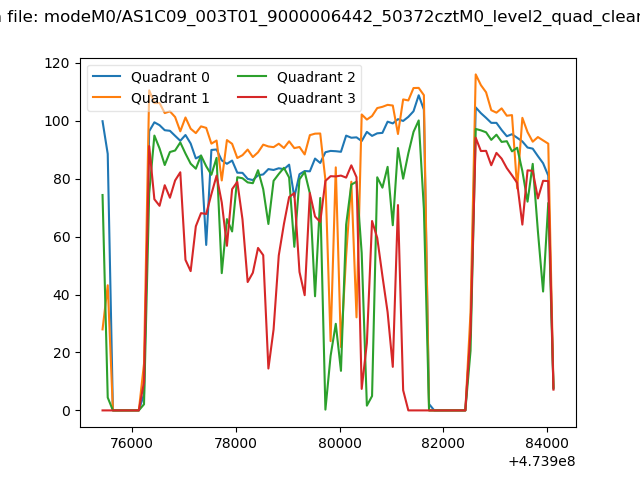 |
|
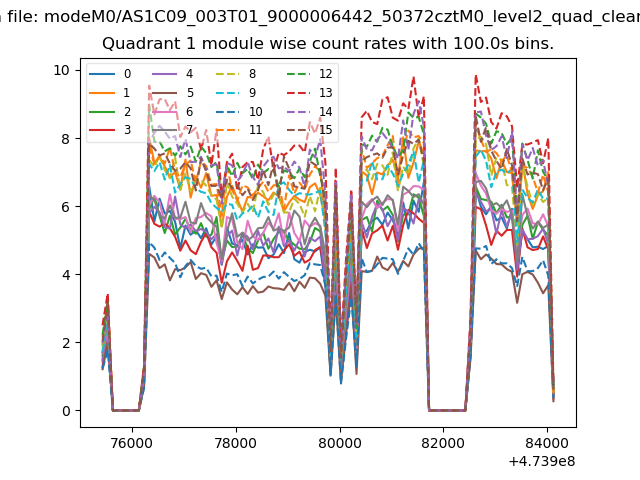
| Module-wise count rates for Quadrant A Data is divided into 100 sec bins |
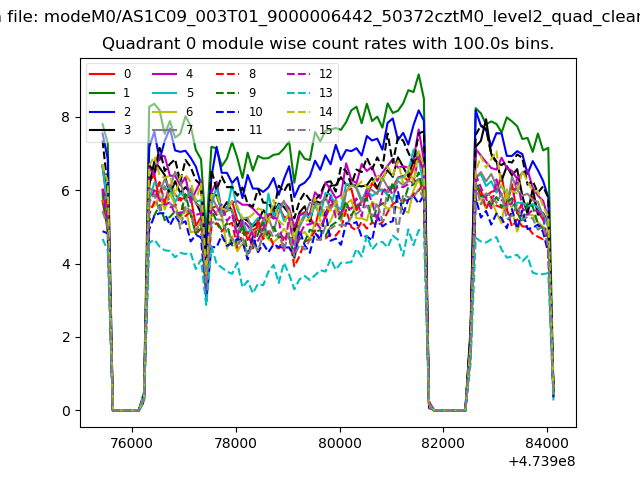 |
 |
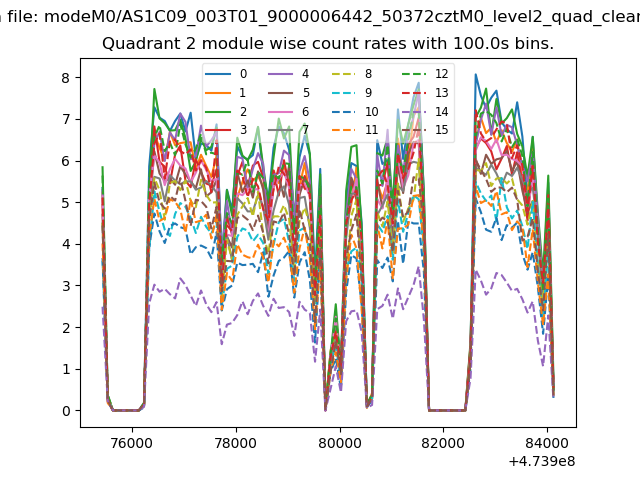
| Module-wise count rates for Quadrant B Data is divided into 100 sec bins |
 |
 |
| Module-wise count rates for Quadrant C Data is divided into 100 sec bins |
 |
 |
| Module-wise count rates for Quadrant D Data is divided into 100 sec bins |
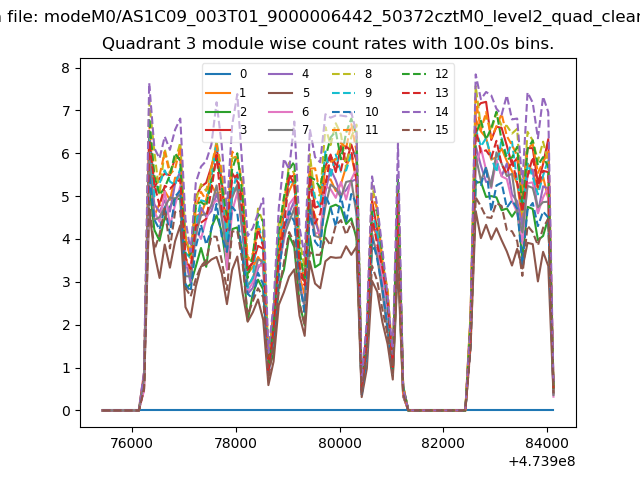 |
 |
| Parameter | Plot |
|---|---|
| CZT HV Monitor | 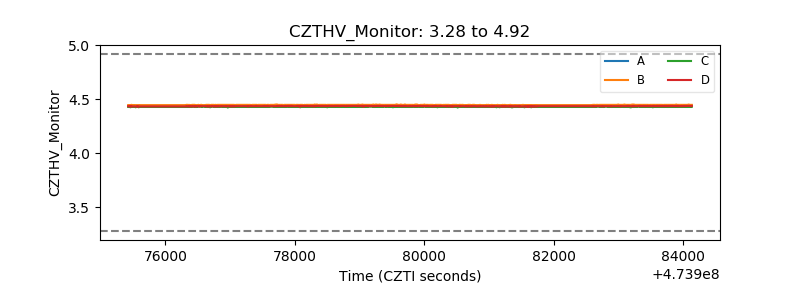 |
| D_VDD | 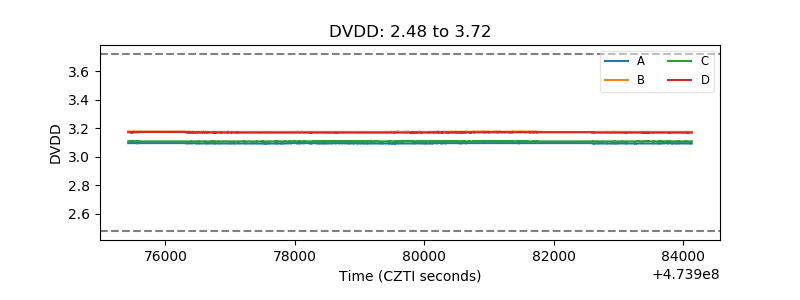 |
| Temperature 1 | 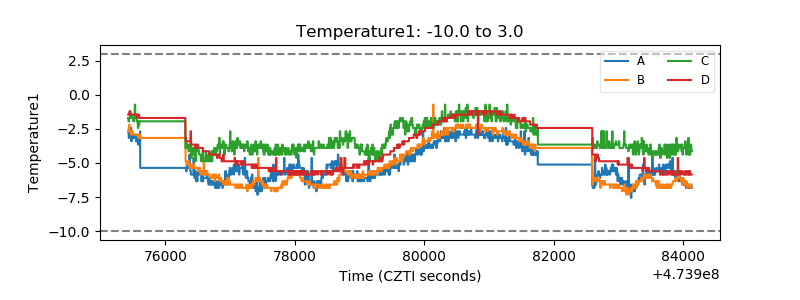 |
| Veto HV Monitor | 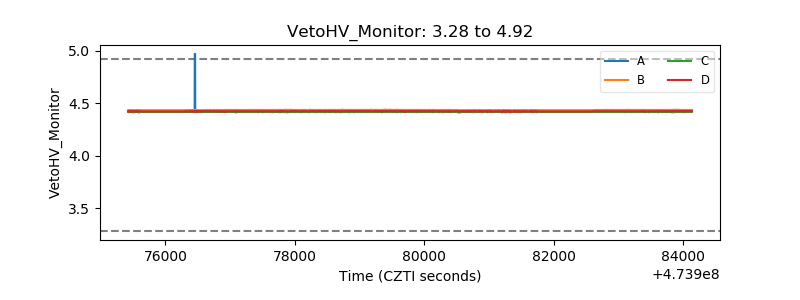 |
| Veto LLD |  |
| Alpha Counter | 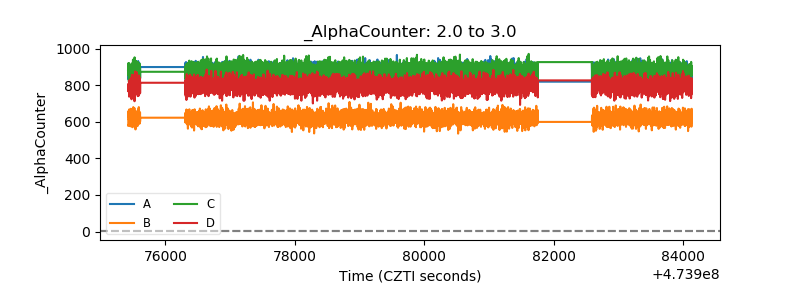 |
| _CPM_Rate | 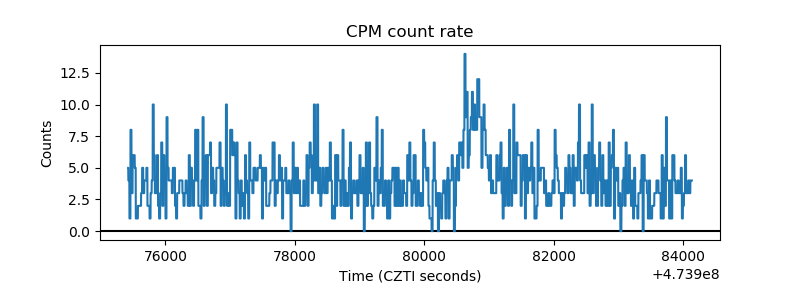 |
| CZT Counter | 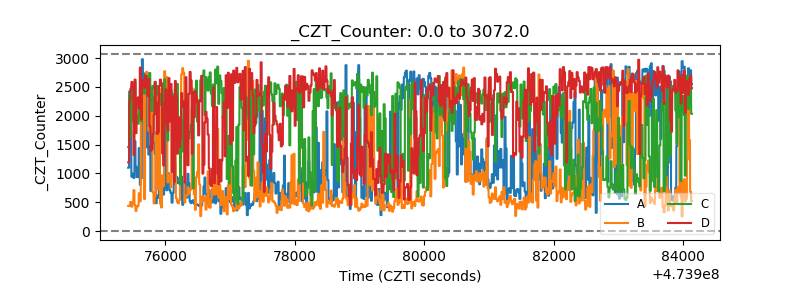 |
| +2.5 Volts monitor | 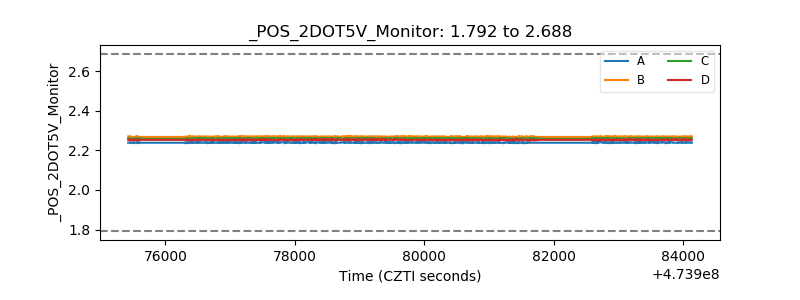 |
| +5 Volts monitor |  |
| _ROLL_ROT | 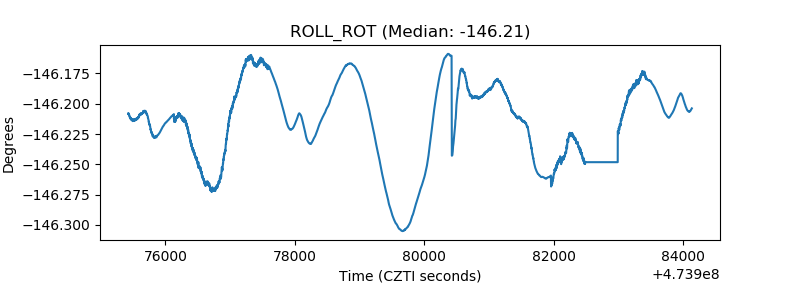 |
| _Roll_DEC | 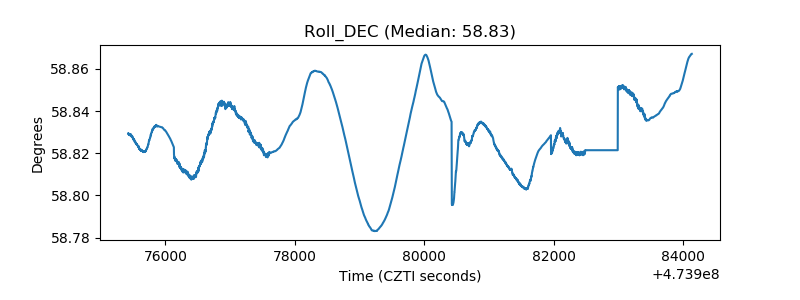 |
| _Roll_RA | 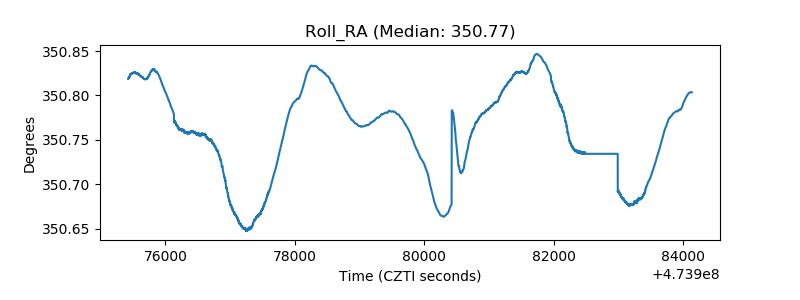 |
| Veto Counter | 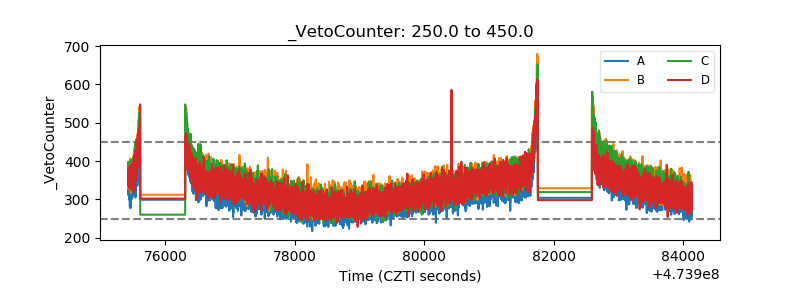 |