| Param | Original file | Final file |
|---|---|---|
| Filename | modeM0/AS1C09_003T01_9000006442_50374cztM0_level2.fits | modeM0/AS1C09_003T01_9000006442_50374cztM0_level2_quad_clean.evt |
| Size (bytes) | 648,941,760 | 91,258,560 |
| Size | 618.9 MB | 87.0 MB |
| Events in quadrant A | 3,881,740 | 630,169 |
| Events in quadrant B | 3,893,613 | 677,028 |
| Events in quadrant C | 7,495,951 | 533,789 |
| Events in quadrant D | 8,228,741 | 453,154 |
| Mode M9 | |||
|---|---|---|---|
| Quadrant | BADHDUFLAG | Total packets | Discarded packets |
| A | 0 | 17 | 0 |
| B | 0 | 17 | 0 |
| C | 0 | 18 | 0 |
| D | 0 | 18 | 0 |
| Mode M0 | |||
|---|---|---|---|
| Quadrant | BADHDUFLAG | Total packets | Discarded packets |
| A | 0 | 15866 | 2 |
| B | 0 | 16336 | 2 |
| C | 0 | 26875 | 2 |
| D | 0 | 29045 | 4 |
| Mode SS | |||
|---|---|---|---|
| Quadrant | BADHDUFLAG | Total packets | Discarded packets |
| A | 0 | 136 | 0 |
| B | 0 | 136 | 0 |
| C | 0 | 136 | 0 |
| D | 0 | 134 | 0 |
| Quadrant | Total seconds | Saturated seconds | Saturation percentage |
|---|---|---|---|
| A | 6731 | 98 | 1.455950% |
| B | 6731 | 245 | 3.639875% |
| C | 6731 | 1125 | 16.713713% |
| D | 6730 | 1640 | 24.368499% |
Noise dominated data is calculated using 1-second bins in cleaned event files. If a bin has >2000 counts, and if more than 50% of those come from <1% of pixels, then it is considered to be noise-dominated and hence unusable.
| Quadrant | # 1 sec bins | Bins with >0 counts | Bins with >2000 counts | High rate bins dominated by noise | Noise dominated (total time) | Noise dominated (detector-on time) | Marked lightcurve |
|---|---|---|---|---|---|---|---|
| A | 7686 | 6732 | 32 | 32 | 0.42% | 0.48% | 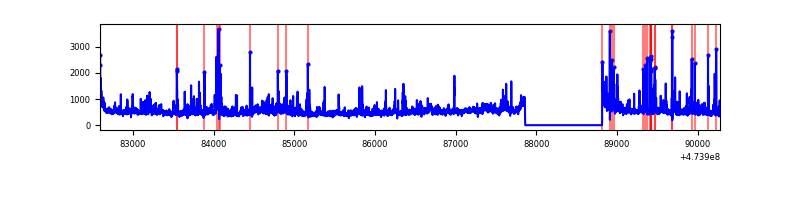 |
| B | 7686 | 6732 | 101 | 101 | 1.31% | 1.50% | 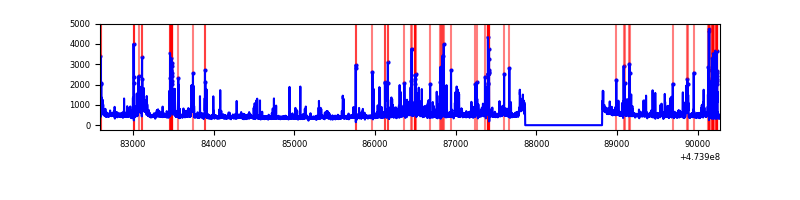 |
| C | 7686 | 6732 | 1040 | 1040 | 13.53% | 15.45% | 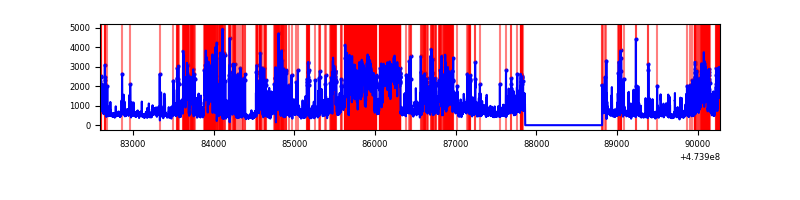 |
| D | 7685 | 6730 | 1424 | 1424 | 18.53% | 21.16% | 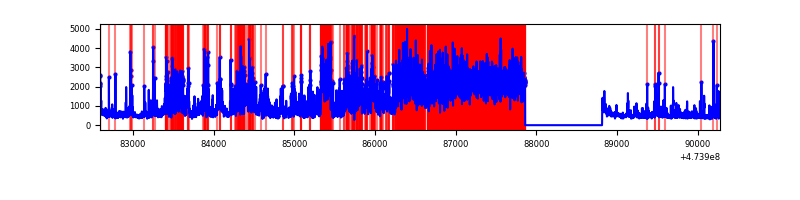 |
Top three noisy pixels from each quadrant. If the there are fewer than three noisy pixels in the level2.evt file, extra rows are filled as -1
| Pixel properties | Quadrant properties | ||||||
|---|---|---|---|---|---|---|---|
| Quadrant | DetID | PixID | Counts | Sigma | Mean | Median | Sigma |
| A | 4 | 3 | 165597 | 920.11 | 723 | 705 | 179.2 |
| A | 3 | 14 | 132293 | 734.27 | 723 | 705 | 179.2 |
| A | 10 | 253 | 102385 | 567.38 | 723 | 705 | 179.2 |
| B | 5 | 172 | 200883 | 1312.49 | 715 | 691 | 152.5 |
| B | 10 | 43 | 193743 | 1265.68 | 715 | 691 | 152.5 |
| B | 5 | 185 | 189787 | 1239.75 | 715 | 691 | 152.5 |
| C | 15 | 232 | 2371039 | 12600.81 | 674 | 668 | 188.1 |
| C | 13 | 3 | 412981 | 2191.84 | 674 | 668 | 188.1 |
| C | 15 | 164 | 247674 | 1313.07 | 674 | 668 | 188.1 |
| D | 7 | 61 | 2271298 | 12820.1 | 631 | 611 | 177.1 |
| D | 12 | 1 | 1676677 | 9462.92 | 631 | 611 | 177.1 |
| D | 7 | 96 | 242183 | 1363.89 | 631 | 611 | 177.1 |
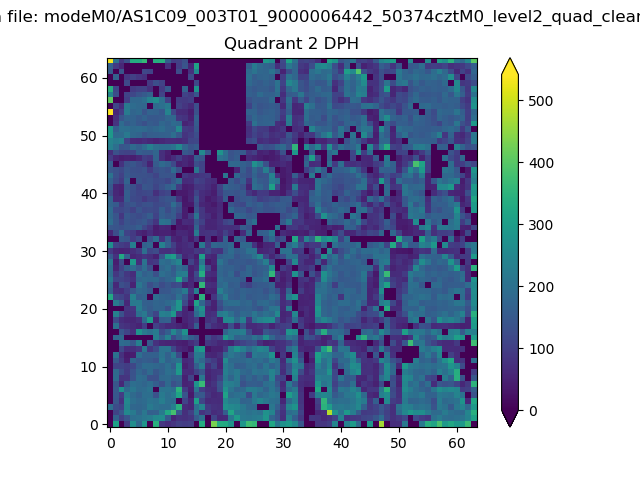
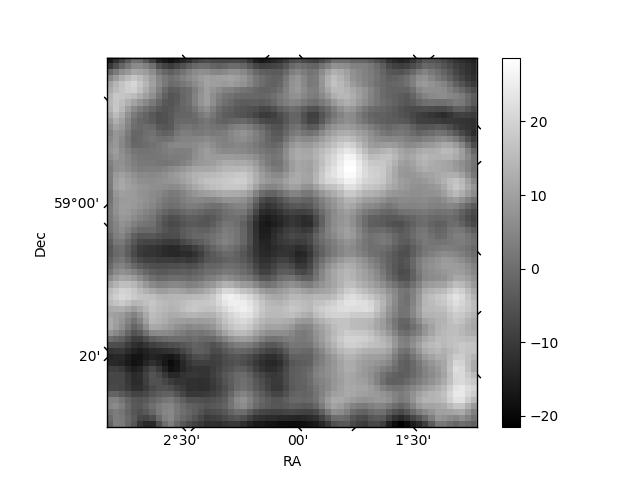
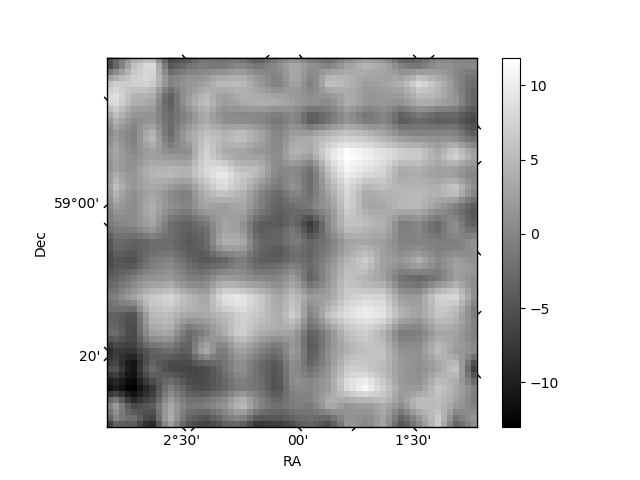
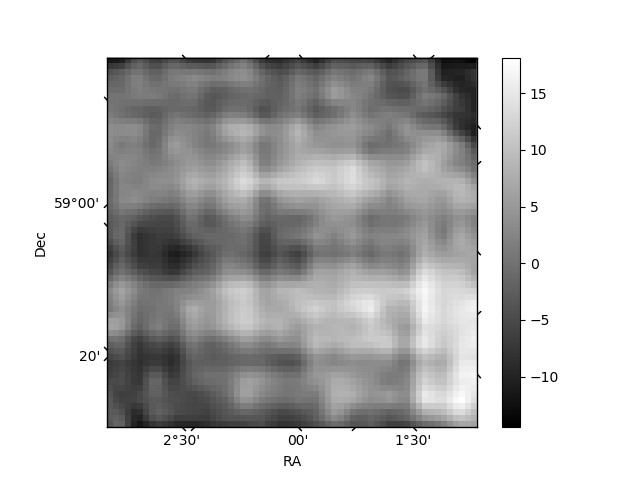
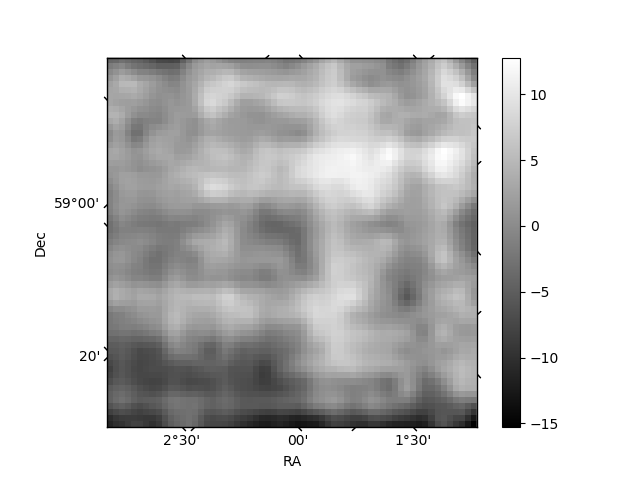
Histogram calculated using DETX and DETY for each event in the final _common_clean file
| Quadrant A | 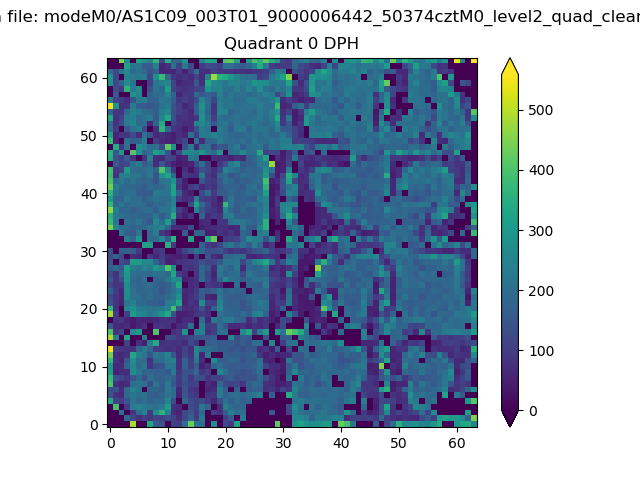 |
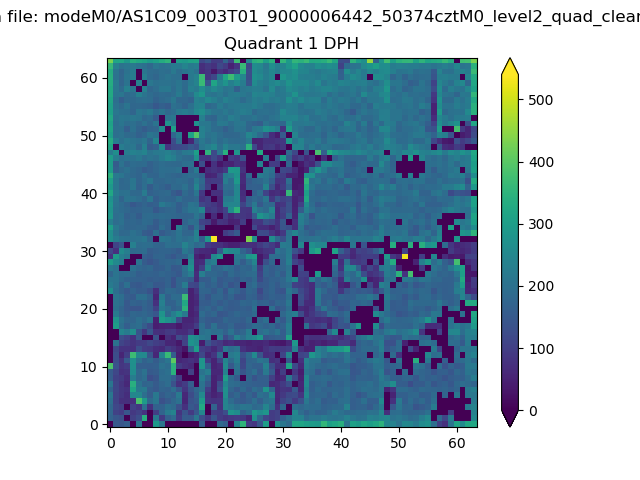 |
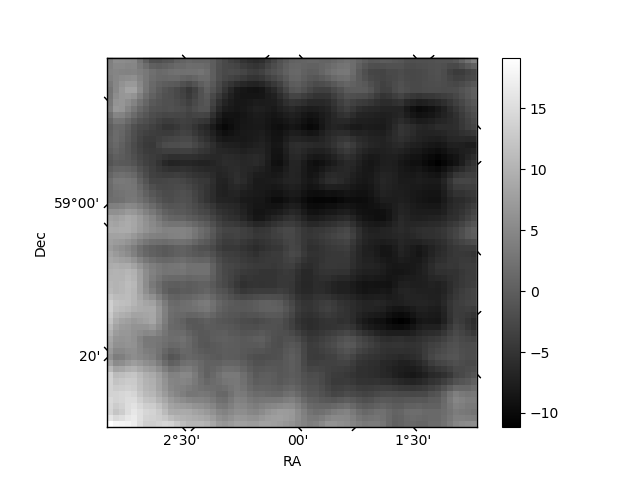
Quadrant B |
|---|---|---|---|
| Quadrant D | 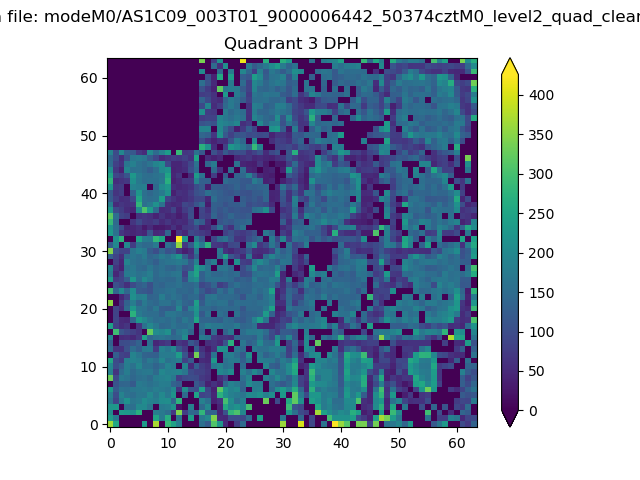 |
 |
Quadrant C |
| Plot type | Count rate plots | Images |
|---|---|---|
| Comparison with Poisson distribution Blue bars denote a histogram of data divided into 1 sec bins. Red curve is a Poisson curve with rate = median count rate of data. |
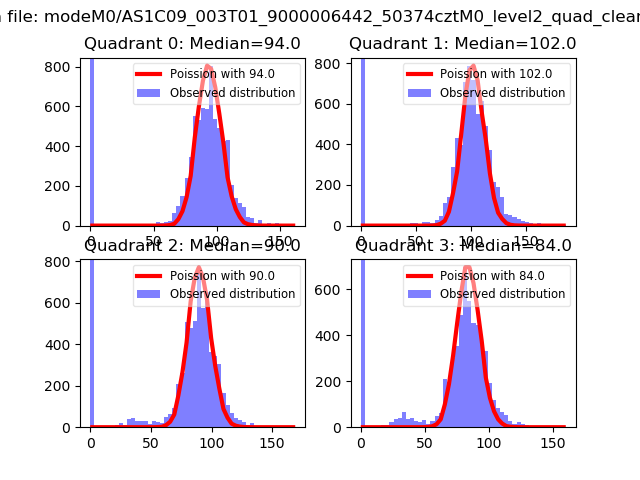 |
 |
| Quadrant-wise count rates Data is divided into 100 sec bins |
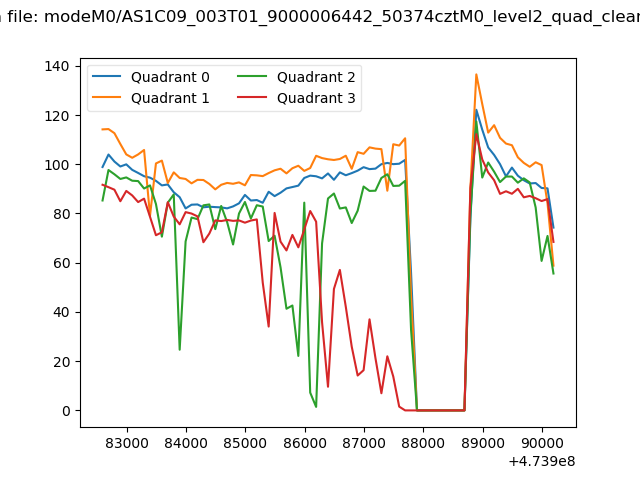 |
|
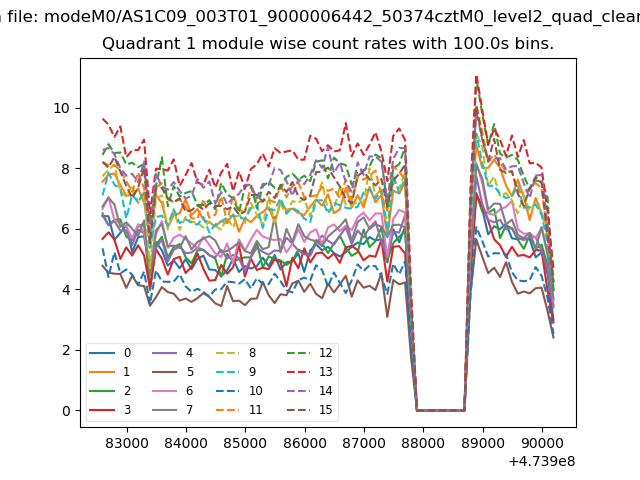
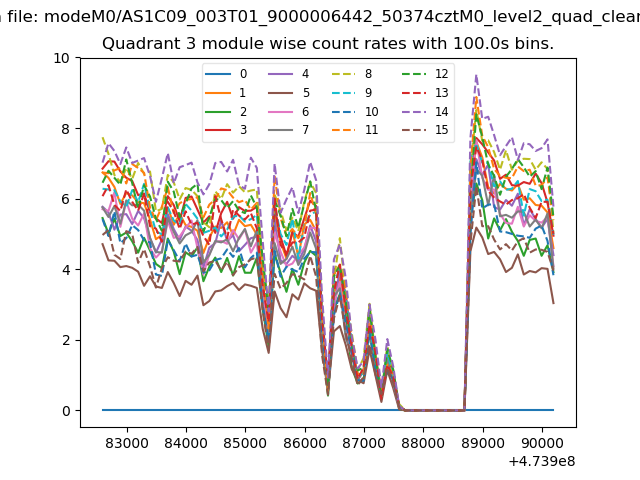
| Module-wise count rates for Quadrant A Data is divided into 100 sec bins |
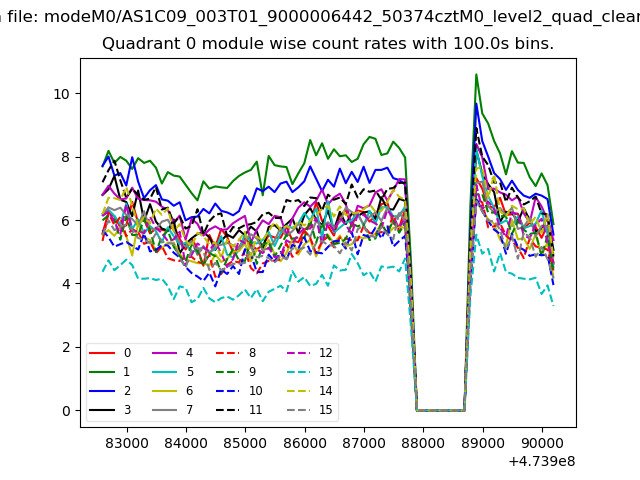 |
 |
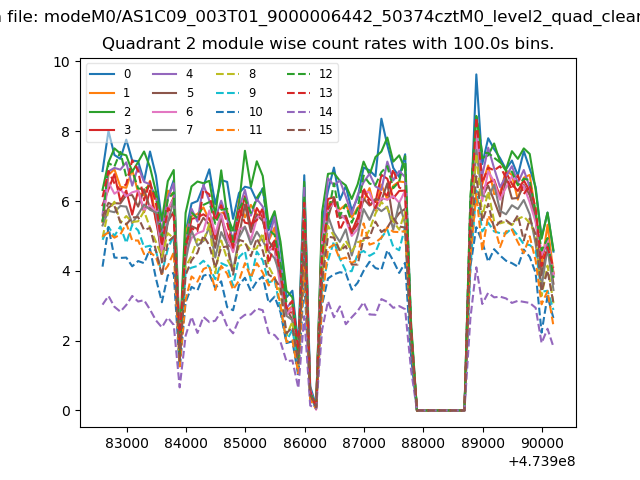
| Module-wise count rates for Quadrant B Data is divided into 100 sec bins |
 |
 |
| Module-wise count rates for Quadrant C Data is divided into 100 sec bins |
 |
 |
| Module-wise count rates for Quadrant D Data is divided into 100 sec bins |
 |
 |
| Parameter | Plot |
|---|---|
| CZT HV Monitor | 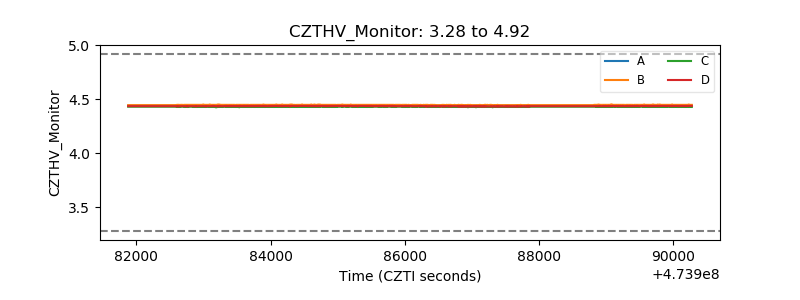 |
| D_VDD | 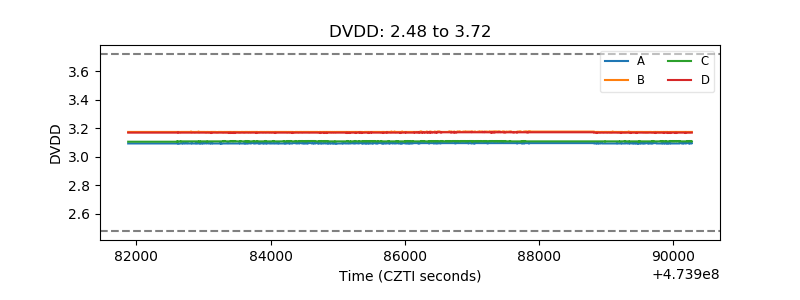 |
| Temperature 1 | 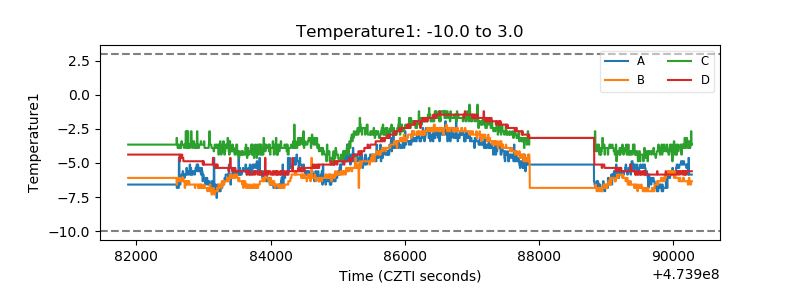 |
| Veto HV Monitor | 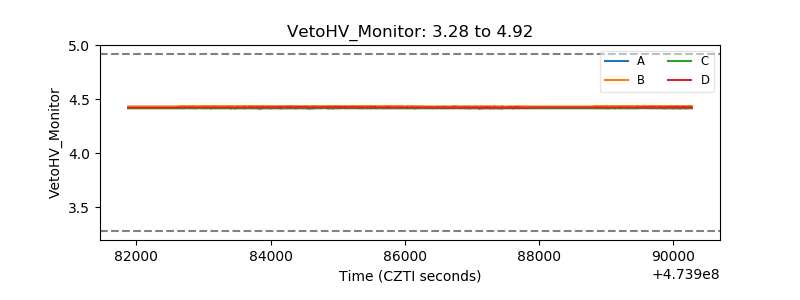 |
| Veto LLD | 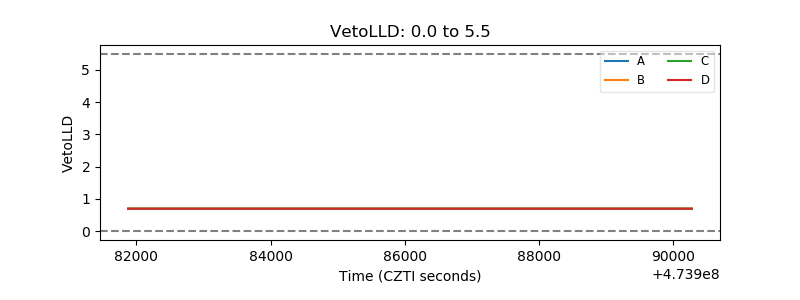 |
| Alpha Counter | 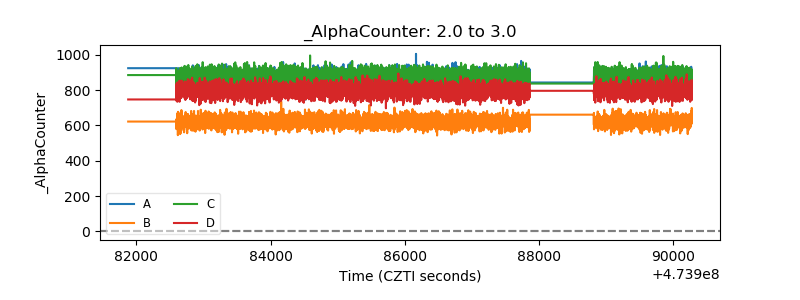 |
| _CPM_Rate | 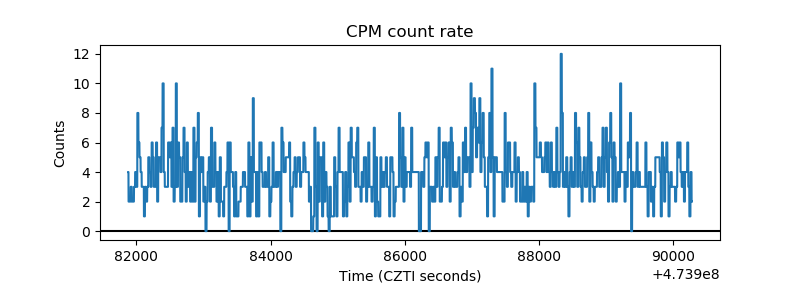 |
| CZT Counter | 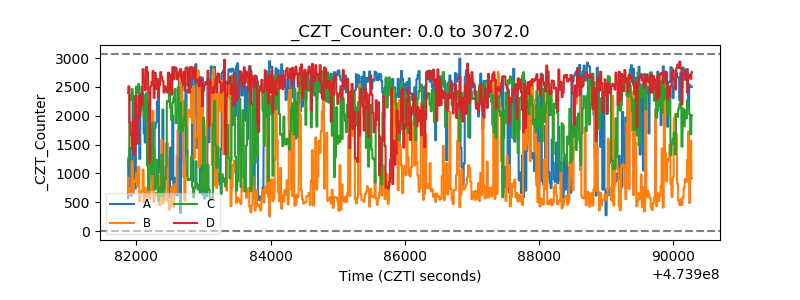 |
| +2.5 Volts monitor | 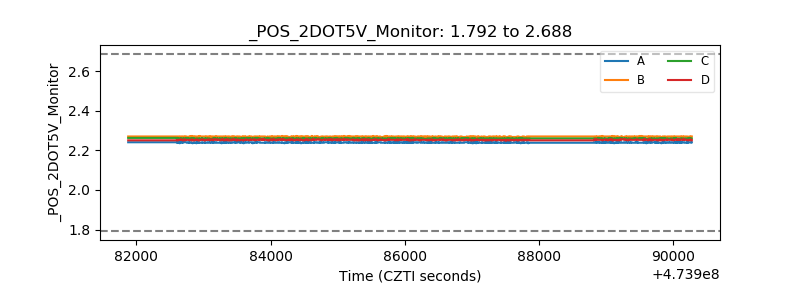 |
| +5 Volts monitor | 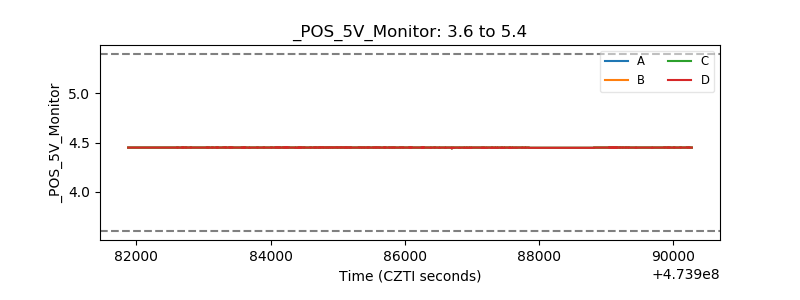 |
| _ROLL_ROT | 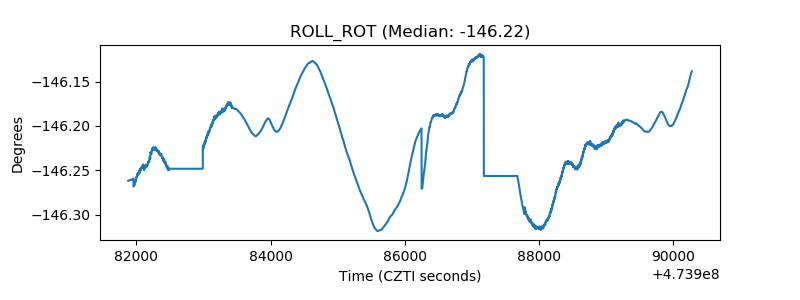 |
| _Roll_DEC | 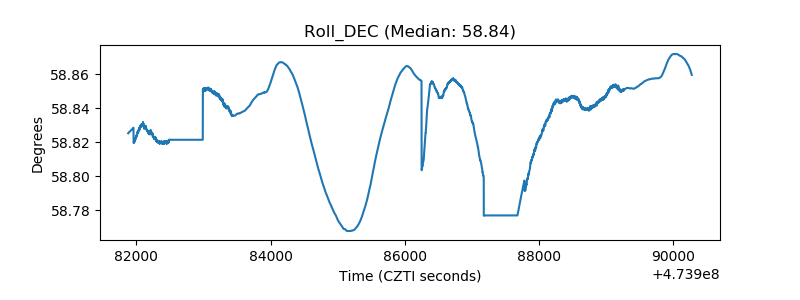 |
| _Roll_RA | 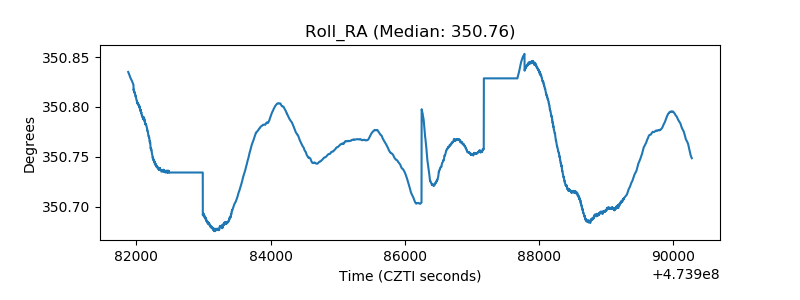 |
| Veto Counter | 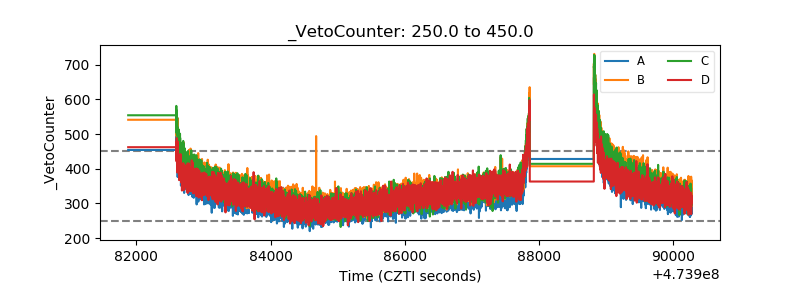 |