| Param | Original file | Final file |
|---|---|---|
| Filename | modeM0/AS1C09_003T01_9000006442_50377cztM0_level2.fits | modeM0/AS1C09_003T01_9000006442_50377cztM0_level2_quad_clean.evt |
| Size (bytes) | 569,234,880 | 92,007,360 |
| Size | 542.9 MB | 87.7 MB |
| Events in quadrant A | 4,011,683 | 621,205 |
| Events in quadrant B | 3,546,788 | 678,381 |
| Events in quadrant C | 8,158,971 | 490,639 |
| Events in quadrant D | 4,856,350 | 548,443 |
| Mode M9 | |||
|---|---|---|---|
| Quadrant | BADHDUFLAG | Total packets | Discarded packets |
| A | 0 | 11 | 0 |
| B | 0 | 11 | 0 |
| C | 0 | 11 | 0 |
| D | 0 | 11 | 0 |
| Mode M0 | |||
|---|---|---|---|
| Quadrant | BADHDUFLAG | Total packets | Discarded packets |
| A | 0 | 16190 | 1 |
| B | 0 | 14928 | 1 |
| C | 0 | 28728 | 3 |
| D | 0 | 18979 | 1 |
| Mode SS | |||
|---|---|---|---|
| Quadrant | BADHDUFLAG | Total packets | Discarded packets |
| A | 0 | 130 | 0 |
| B | 0 | 130 | 0 |
| C | 0 | 130 | 0 |
| D | 0 | 130 | 0 |
| Quadrant | Total seconds | Saturated seconds | Saturation percentage |
|---|---|---|---|
| A | 6412 | 235 | 3.665003% |
| B | 6413 | 193 | 3.009512% |
| C | 6412 | 1472 | 22.956956% |
| D | 6412 | 348 | 5.427324% |
Noise dominated data is calculated using 1-second bins in cleaned event files. If a bin has >2000 counts, and if more than 50% of those come from <1% of pixels, then it is considered to be noise-dominated and hence unusable.
| Quadrant | # 1 sec bins | Bins with >0 counts | Bins with >2000 counts | High rate bins dominated by noise | Noise dominated (total time) | Noise dominated (detector-on time) | Marked lightcurve |
|---|---|---|---|---|---|---|---|
| A | 7532 | 6413 | 134 | 134 | 1.78% | 2.09% | 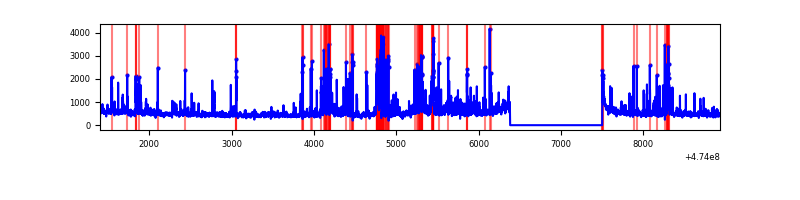 |
| B | 7533 | 6414 | 69 | 69 | 0.92% | 1.08% | 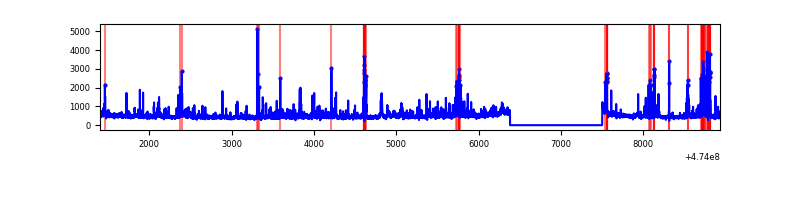 |
| C | 7532 | 6413 | 1214 | 1214 | 16.12% | 18.93% | 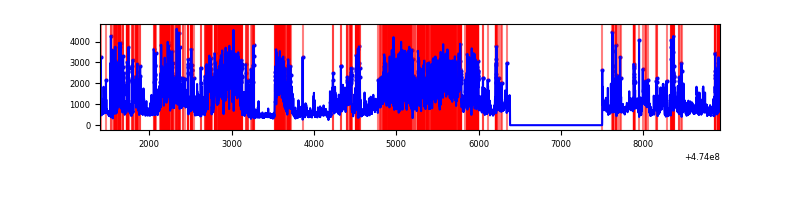 |
| D | 7532 | 6413 | 245 | 245 | 3.25% | 3.82% | 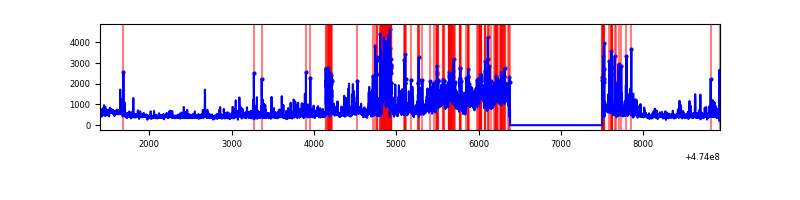 |
Top three noisy pixels from each quadrant. If the there are fewer than three noisy pixels in the level2.evt file, extra rows are filled as -1
| Pixel properties | Quadrant properties | ||||||
|---|---|---|---|---|---|---|---|
| Quadrant | DetID | PixID | Counts | Sigma | Mean | Median | Sigma |
| A | 10 | 253 | 198072 | 1109.42 | 706 | 687 | 177.9 |
| A | 13 | 248 | 187353 | 1049.17 | 706 | 687 | 177.9 |
| A | 7 | 221 | 170586 | 954.93 | 706 | 687 | 177.9 |
| B | 5 | 185 | 249906 | 1667.59 | 699 | 676 | 149.5 |
| B | 10 | 43 | 87364 | 580.03 | 699 | 676 | 149.5 |
| B | 1 | 238 | 77940 | 516.97 | 699 | 676 | 149.5 |
| C | 0 | 208 | 1498397 | 8600.24 | 623 | 619 | 174.2 |
| C | 15 | 235 | 783861 | 4497.37 | 623 | 619 | 174.2 |
| C | 12 | 247 | 722015 | 4142.25 | 623 | 619 | 174.2 |
| D | 7 | 61 | 708483 | 3820.79 | 664 | 642 | 185.3 |
| D | 3 | 12 | 359748 | 1938.39 | 664 | 642 | 185.3 |
| D | 8 | 192 | 204658 | 1101.24 | 664 | 642 | 185.3 |
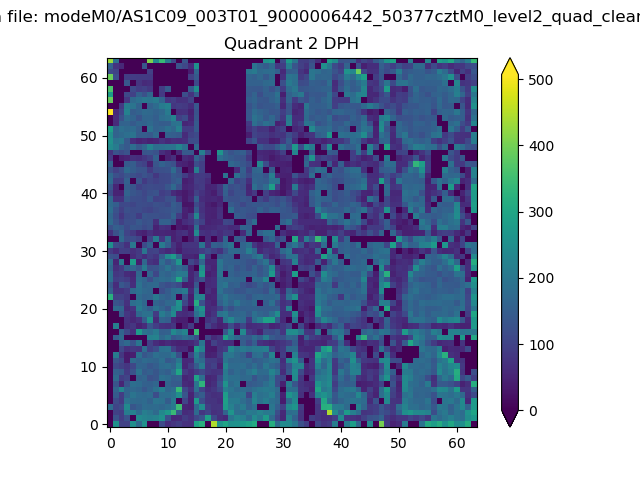
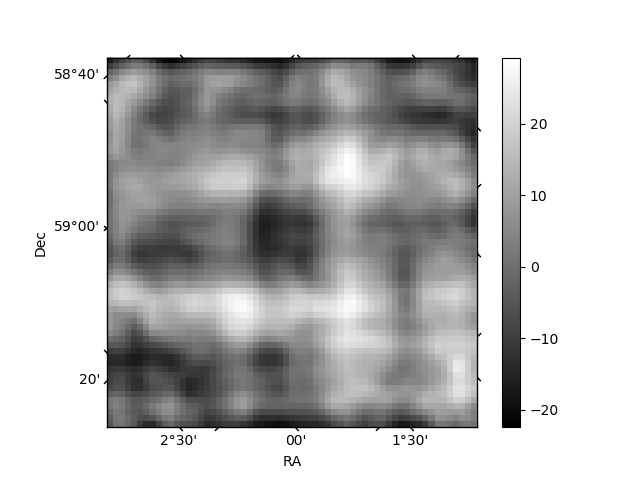
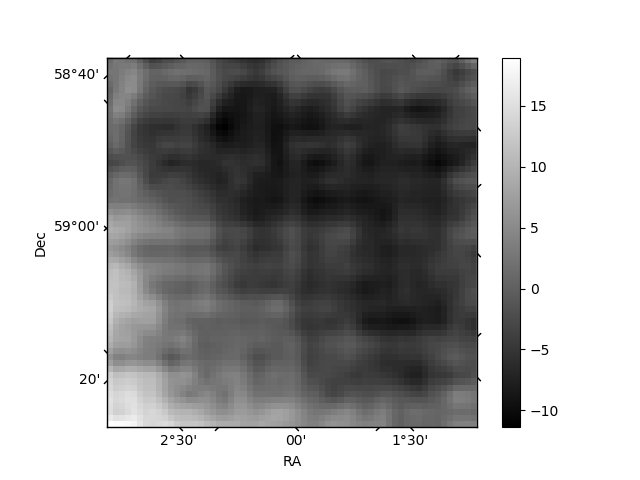
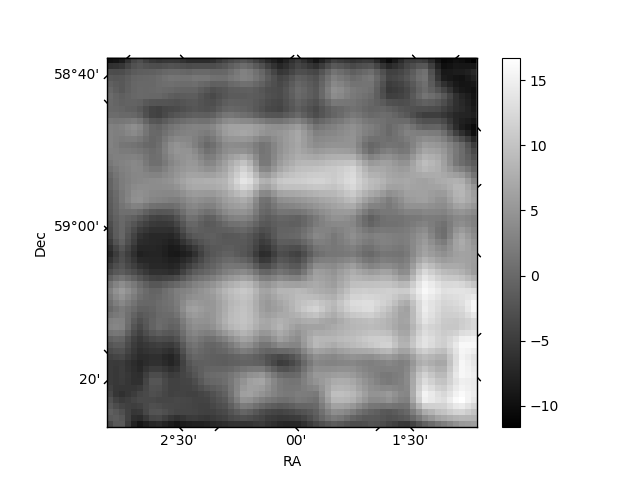
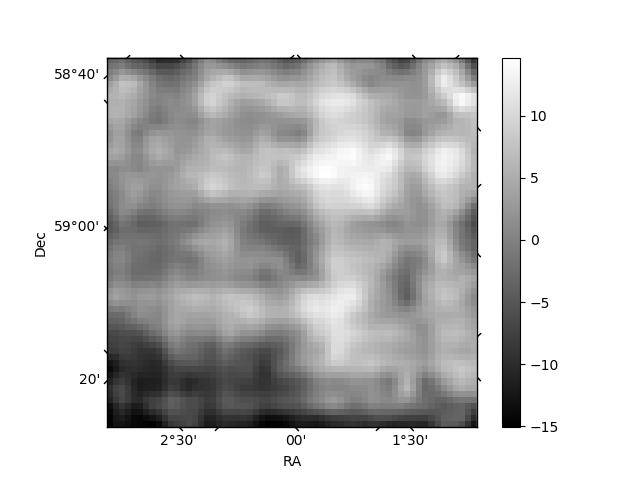
Histogram calculated using DETX and DETY for each event in the final _common_clean file
| Quadrant A | 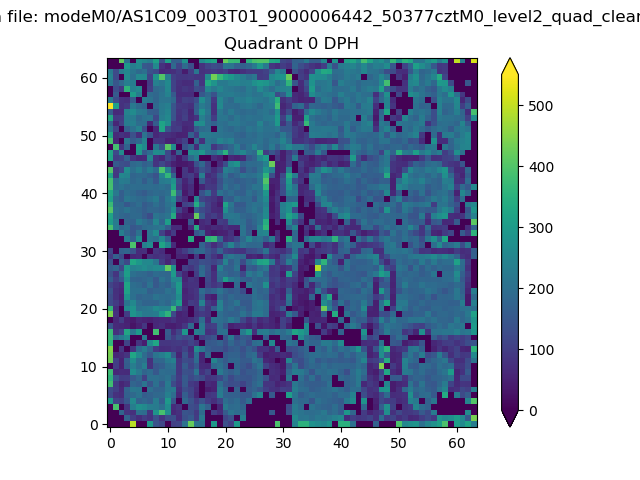 |
 |
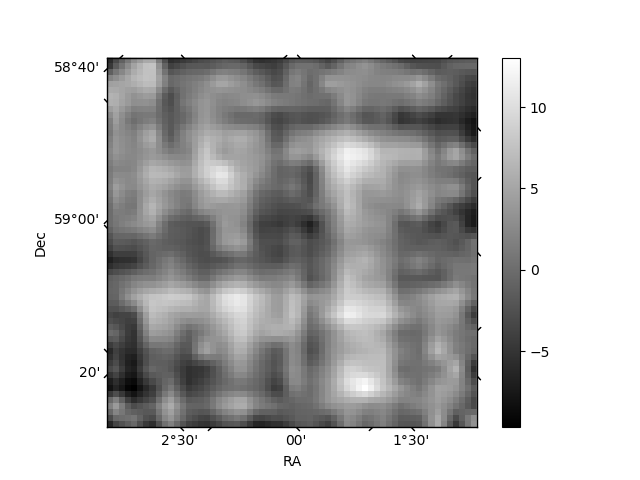
Quadrant B |
|---|---|---|---|
| Quadrant D | 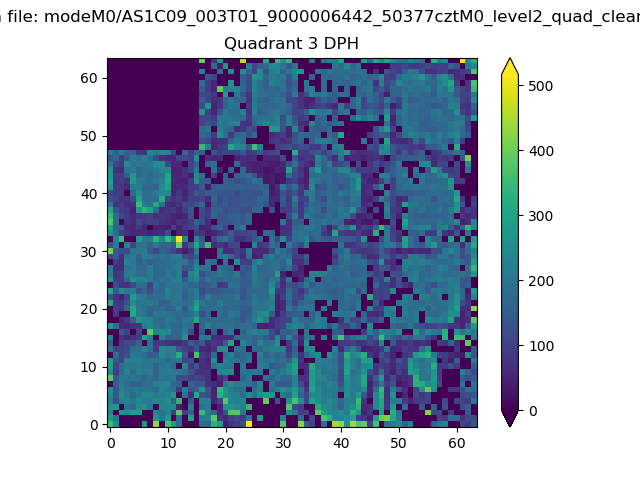 |
 |
Quadrant C |
| Plot type | Count rate plots | Images |
|---|---|---|
| Comparison with Poisson distribution Blue bars denote a histogram of data divided into 1 sec bins. Red curve is a Poisson curve with rate = median count rate of data. |
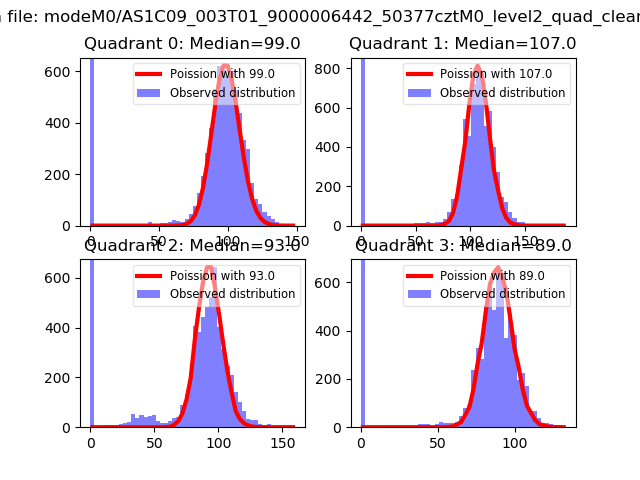 |
 |
| Quadrant-wise count rates Data is divided into 100 sec bins |
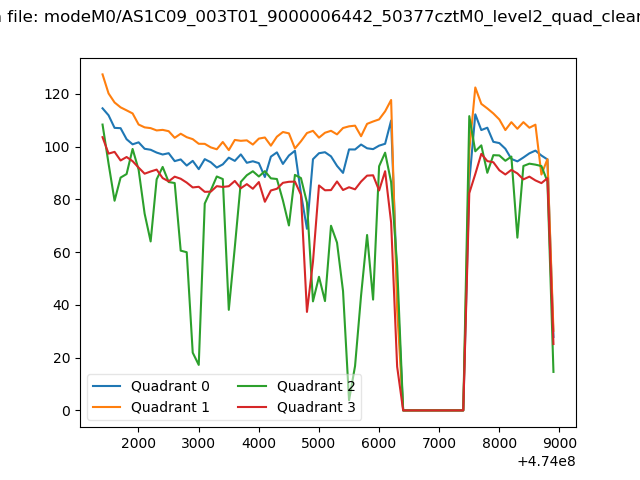 |
|
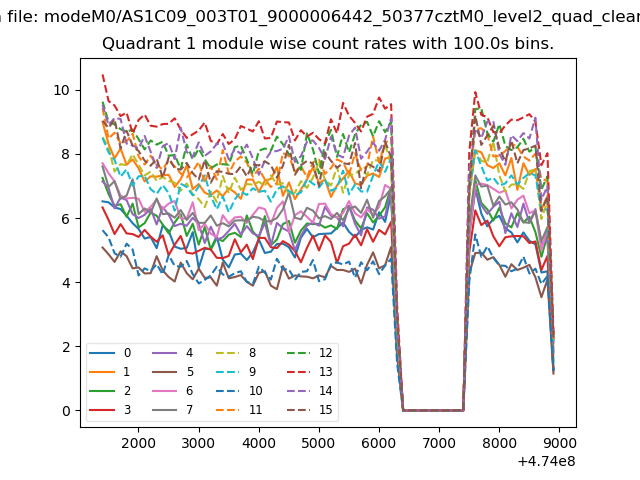
| Module-wise count rates for Quadrant A Data is divided into 100 sec bins |
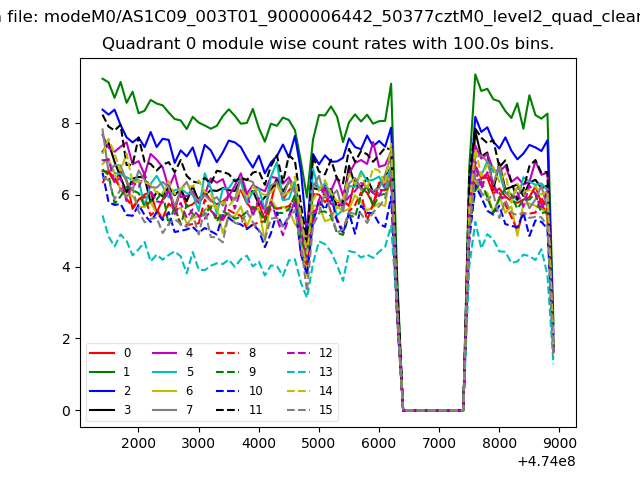 |
 |
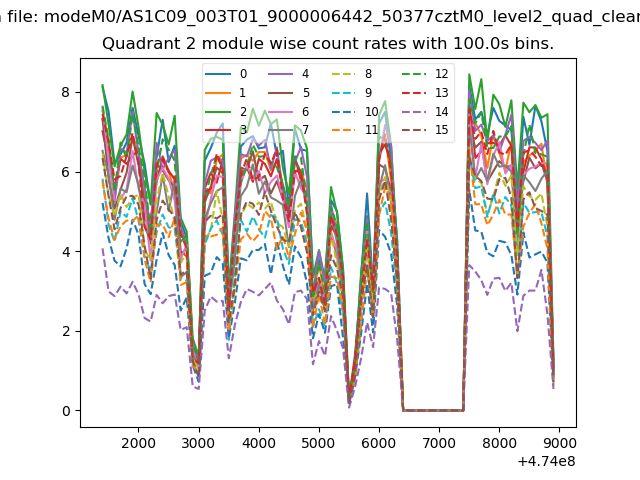
| Module-wise count rates for Quadrant B Data is divided into 100 sec bins |
 |
 |
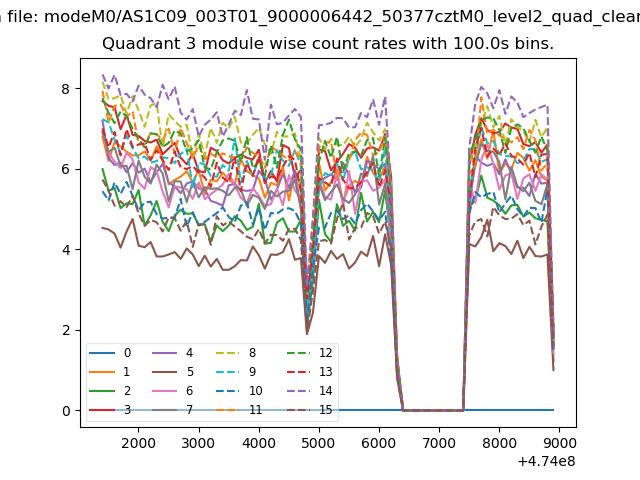
| Module-wise count rates for Quadrant C Data is divided into 100 sec bins |
 |
 |
| Module-wise count rates for Quadrant D Data is divided into 100 sec bins |
 |
 |
| Parameter | Plot |
|---|---|
| CZT HV Monitor | 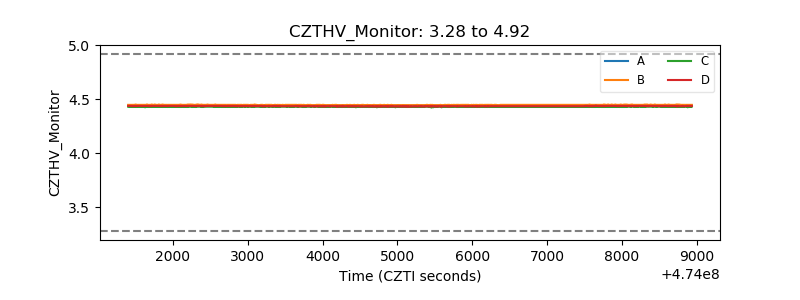 |
| D_VDD | 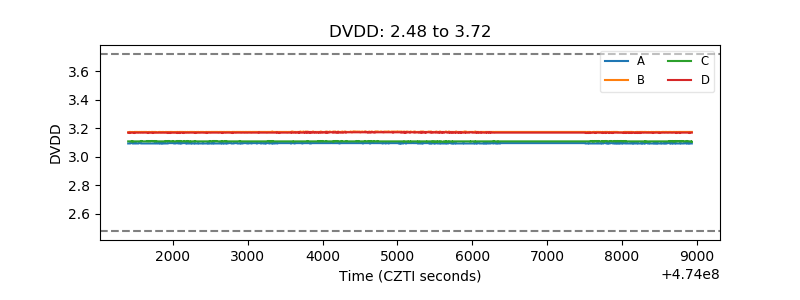 |
| Temperature 1 | 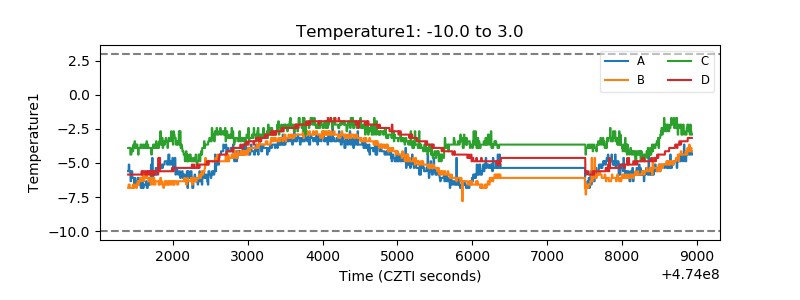 |
| Veto HV Monitor | 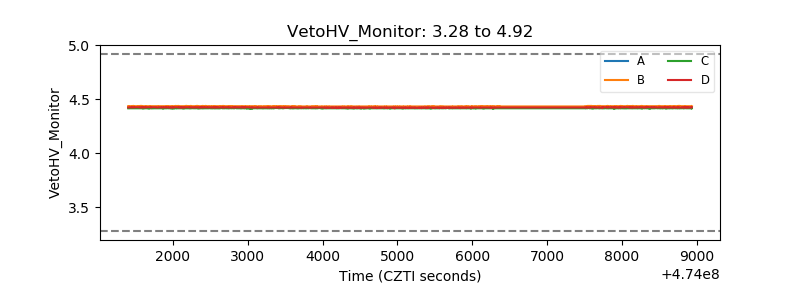 |
| Veto LLD | 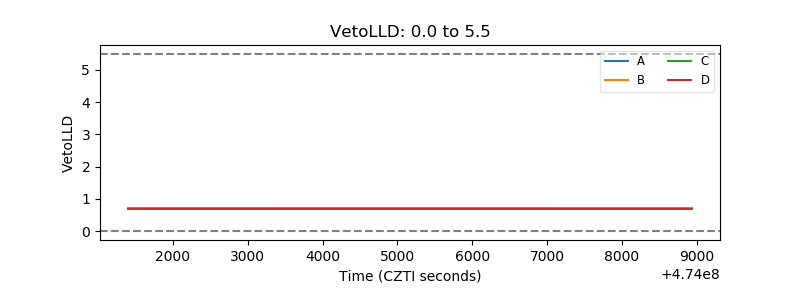 |
| Alpha Counter | 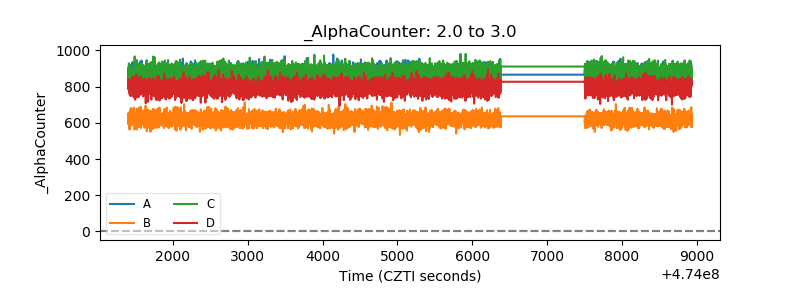 |
| _CPM_Rate | 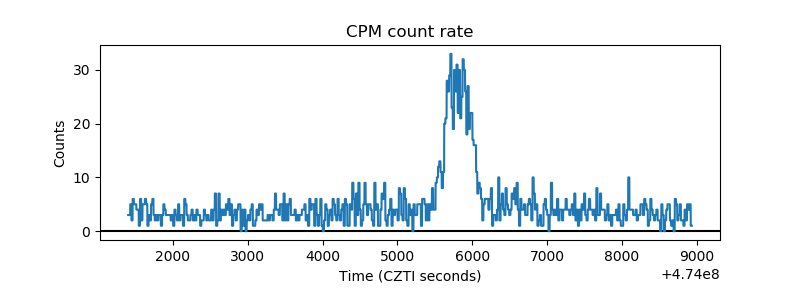 |
| CZT Counter | 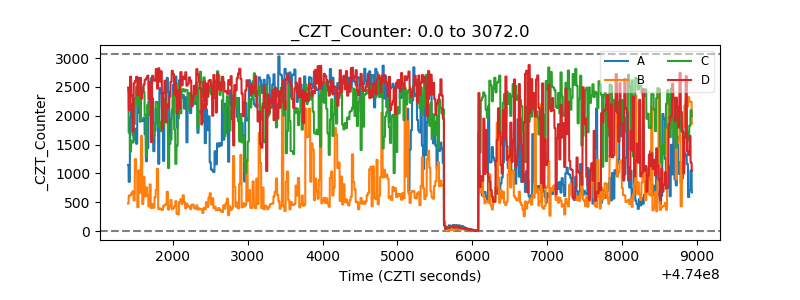 |
| +2.5 Volts monitor | 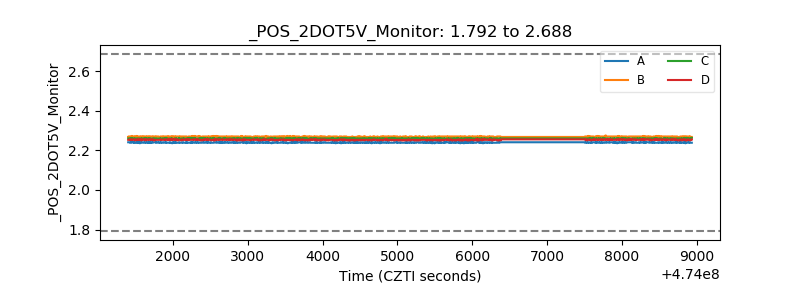 |
| +5 Volts monitor |  |
| _ROLL_ROT | 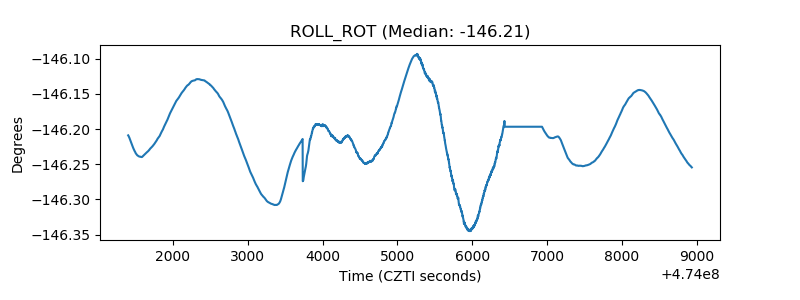 |
| _Roll_DEC | 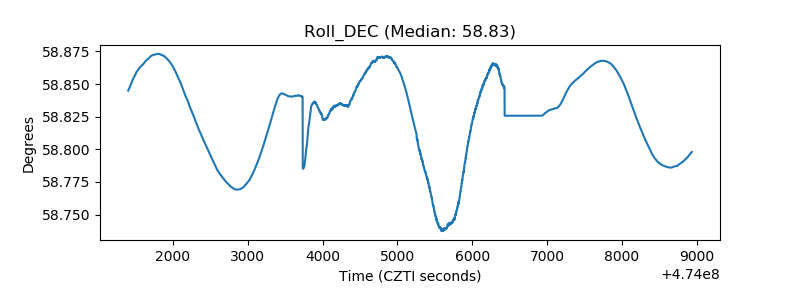 |
| _Roll_RA | 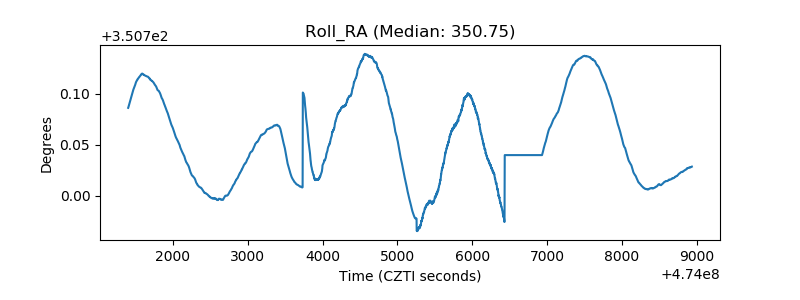 |
| Veto Counter | 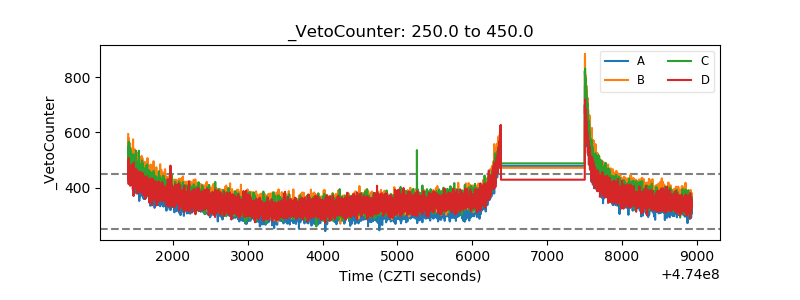 |