| Param | Original file | Final file |
|---|---|---|
| Filename | modeM0/AS1C09_003T01_9000006442_50381cztM0_level2.fits | modeM0/AS1C09_003T01_9000006442_50381cztM0_level2_quad_clean.evt |
| Size (bytes) | 831,876,480 | 97,868,160 |
| Size | 793.3 MB | 93.3 MB |
| Events in quadrant A | 4,982,939 | 698,151 |
| Events in quadrant B | 4,421,049 | 755,329 |
| Events in quadrant C | 9,960,650 | 529,280 |
| Events in quadrant D | 10,846,529 | 456,506 |
| Mode M0 | |||
|---|---|---|---|
| Quadrant | BADHDUFLAG | Total packets | Discarded packets |
| A | 0 | 19879 | 0 |
| B | 0 | 18386 | 0 |
| C | 0 | 34859 | 2 |
| D | 0 | 37484 | 0 |
| Mode SS | |||
|---|---|---|---|
| Quadrant | BADHDUFLAG | Total packets | Discarded packets |
| A | 0 | 150 | 0 |
| B | 0 | 150 | 0 |
| C | 0 | 150 | 0 |
| D | 0 | 150 | 0 |
| Quadrant | Total seconds | Saturated seconds | Saturation percentage |
|---|---|---|---|
| A | 7531 | 136 | 1.805869% |
| B | 7532 | 200 | 2.655337% |
| C | 7531 | 1855 | 24.631523% |
| D | 7531 | 2275 | 30.208472% |
Noise dominated data is calculated using 1-second bins in cleaned event files. If a bin has >2000 counts, and if more than 50% of those come from <1% of pixels, then it is considered to be noise-dominated and hence unusable.
| Quadrant | # 1 sec bins | Bins with >0 counts | Bins with >2000 counts | High rate bins dominated by noise | Noise dominated (total time) | Noise dominated (detector-on time) | Marked lightcurve |
|---|---|---|---|---|---|---|---|
| A | 7531 | 7531 | 102 | 102 | 1.35% | 1.35% | 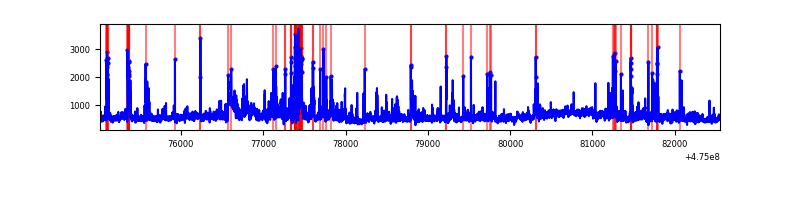 |
| B | 7532 | 7532 | 133 | 133 | 1.77% | 1.77% | 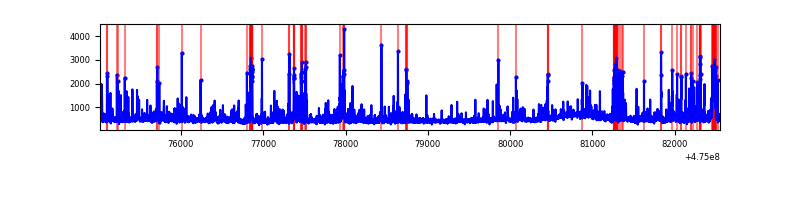 |
| C | 7531 | 7531 | 1703 | 1703 | 22.61% | 22.61% | 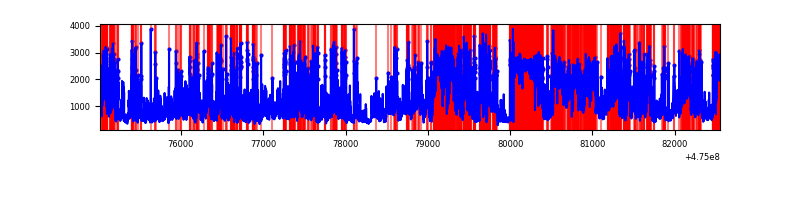 |
| D | 7531 | 7531 | 2189 | 2189 | 29.07% | 29.07% | 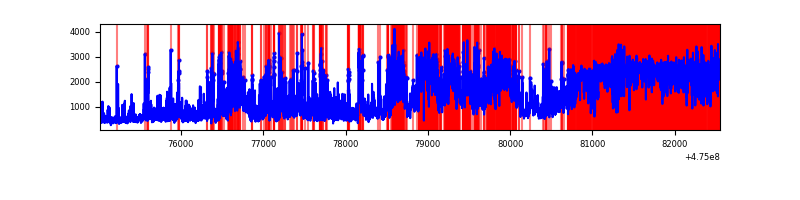 |
Top three noisy pixels from each quadrant. If the there are fewer than three noisy pixels in the level2.evt file, extra rows are filled as -1
| Pixel properties | Quadrant properties | ||||||
|---|---|---|---|---|---|---|---|
| Quadrant | DetID | PixID | Counts | Sigma | Mean | Median | Sigma |
| A | 3 | 14 | 516728 | 2625.09 | 805 | 788 | 196.5 |
| A | 4 | 3 | 352199 | 1787.97 | 805 | 788 | 196.5 |
| A | 3 | 63 | 183745 | 930.88 | 805 | 788 | 196.5 |
| B | 5 | 172 | 156336 | 924.99 | 797 | 771 | 168.2 |
| B | 5 | 185 | 147728 | 873.8 | 797 | 771 | 168.2 |
| B | 0 | 213 | 120394 | 711.28 | 797 | 771 | 168.2 |
| C | 15 | 127 | 2371829 | 12203.05 | 709 | 705 | 194.3 |
| C | 15 | 199 | 695279 | 3574.64 | 709 | 705 | 194.3 |
| C | 15 | 195 | 639083 | 3285.43 | 709 | 705 | 194.3 |
| D | 7 | 61 | 2849463 | 14896.18 | 692 | 670 | 191.2 |
| D | 7 | 60 | 638319 | 3334.23 | 692 | 670 | 191.2 |
| D | 15 | 169 | 626530 | 3272.59 | 692 | 670 | 191.2 |
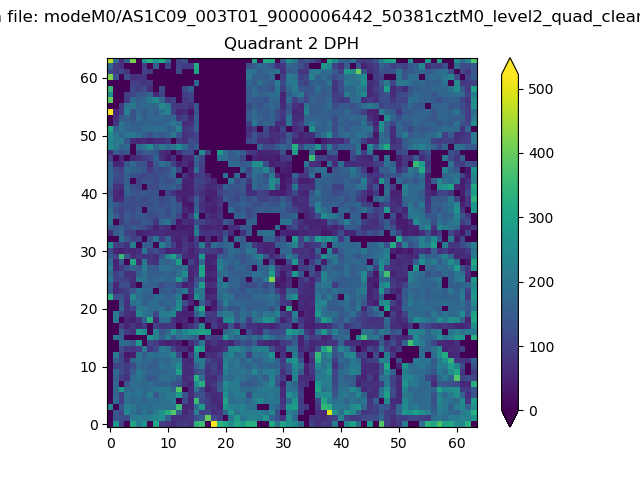
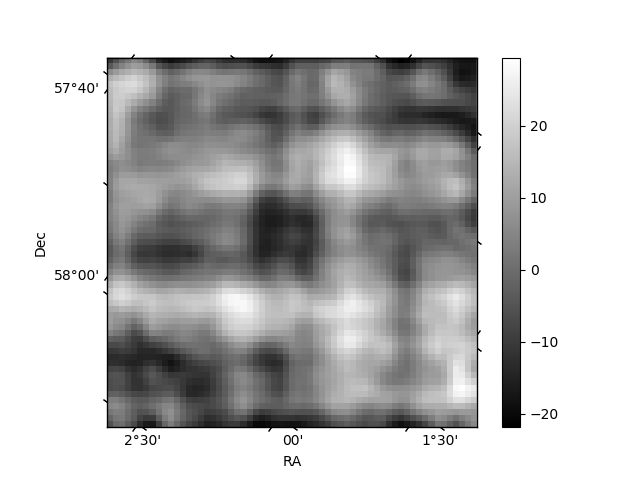
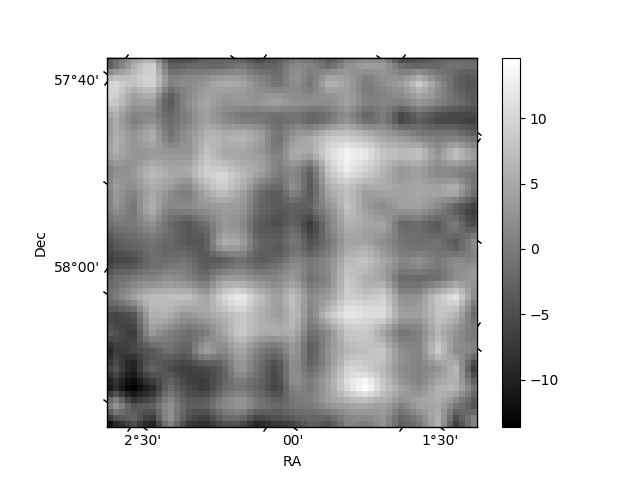
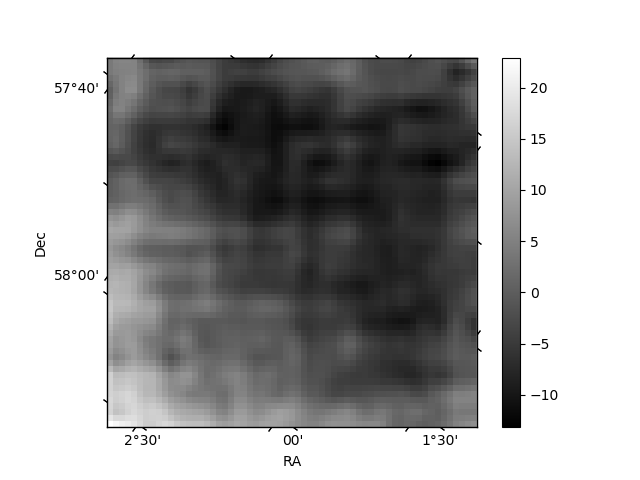
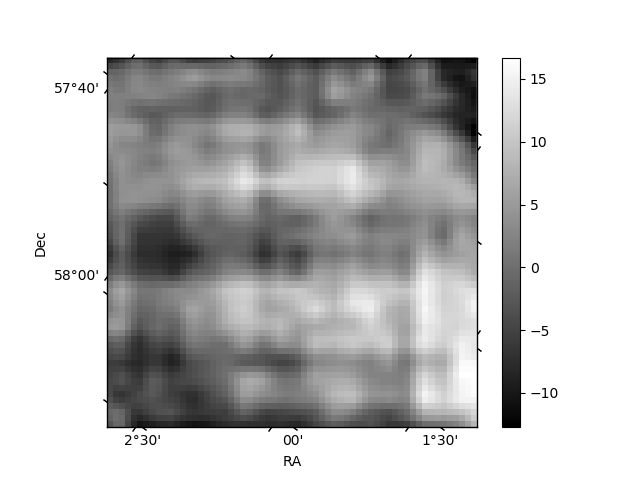
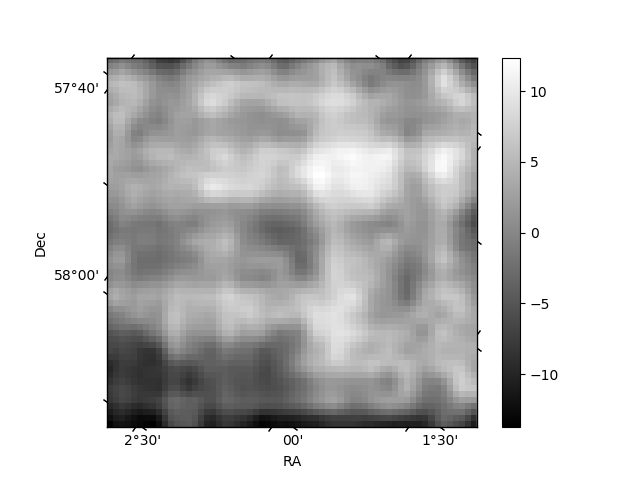
Histogram calculated using DETX and DETY for each event in the final _common_clean file
| Quadrant A | 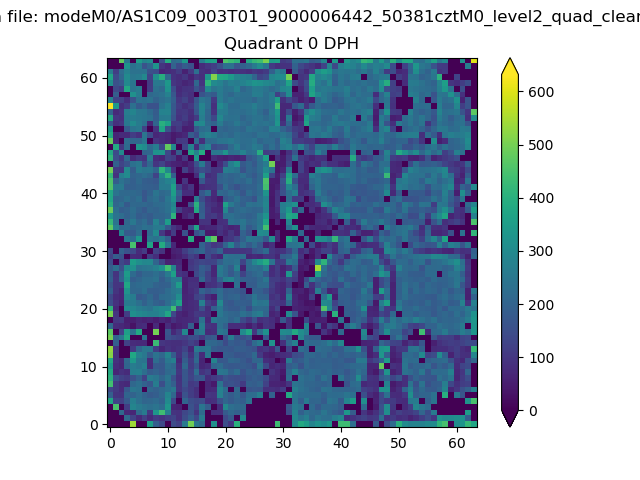 |
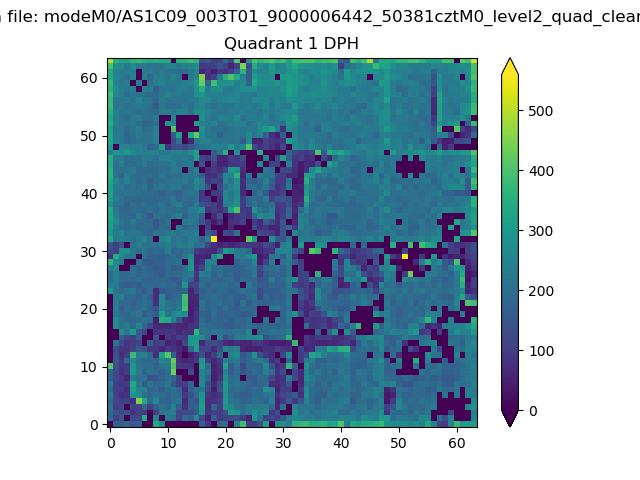 |
Quadrant B |
|---|---|---|---|
| Quadrant D | 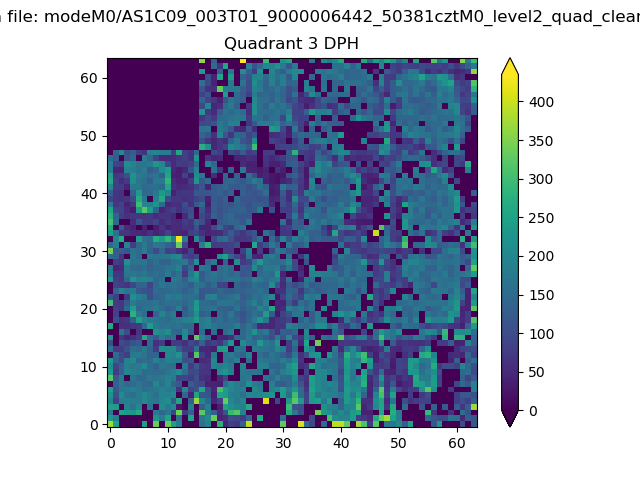 |
 |
Quadrant C |
| Plot type | Count rate plots | Images |
|---|---|---|
| Comparison with Poisson distribution Blue bars denote a histogram of data divided into 1 sec bins. Red curve is a Poisson curve with rate = median count rate of data. |
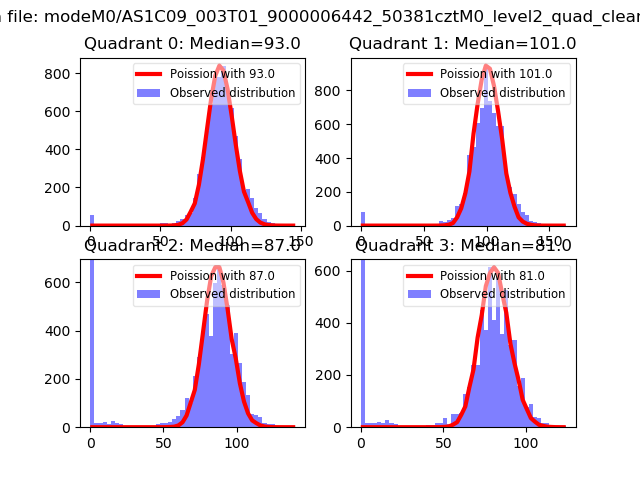 |
 |
| Quadrant-wise count rates Data is divided into 100 sec bins |
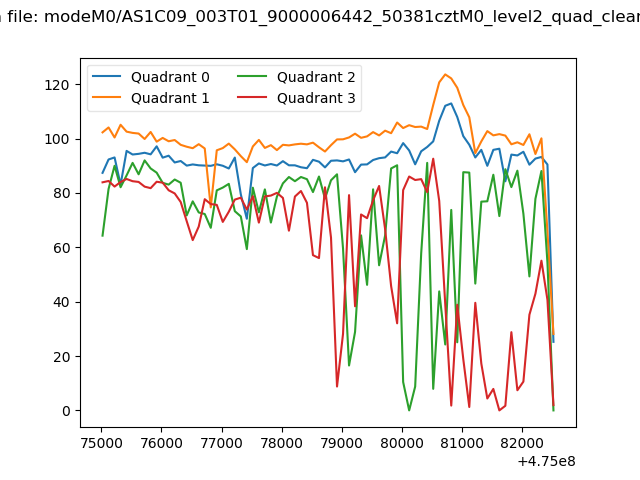 |
|
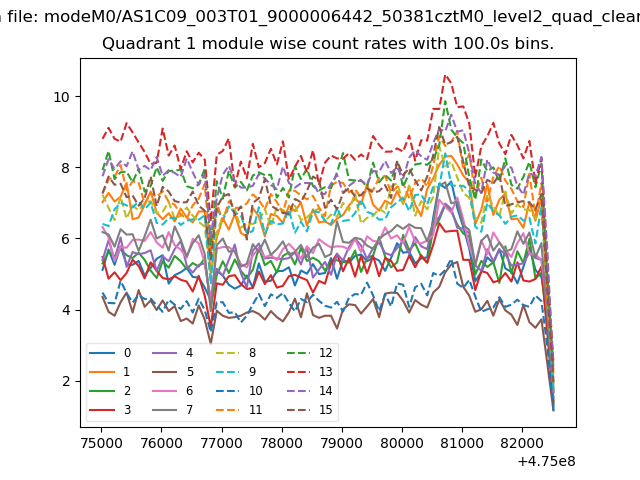
| Module-wise count rates for Quadrant A Data is divided into 100 sec bins |
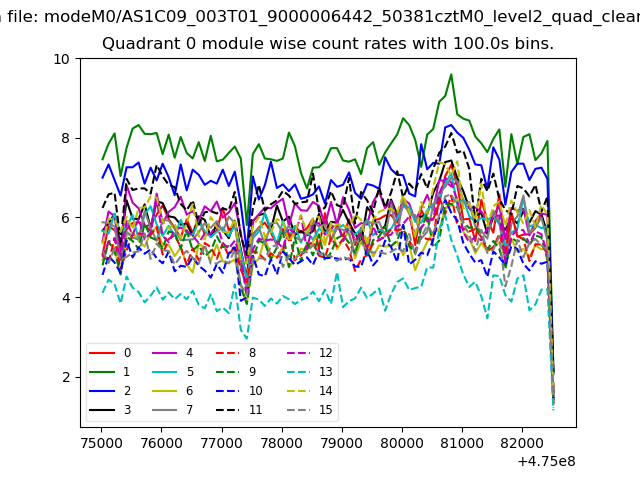 |
 |
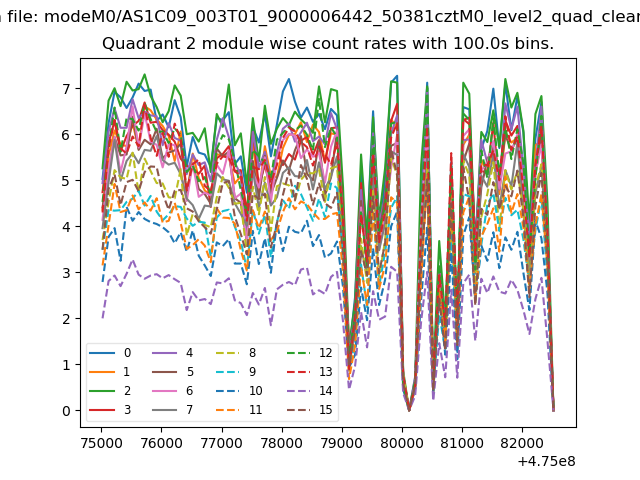
| Module-wise count rates for Quadrant B Data is divided into 100 sec bins |
 |
 |
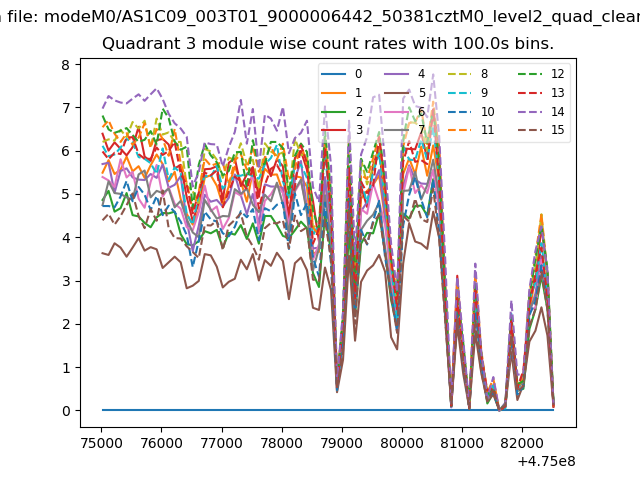
| Module-wise count rates for Quadrant C Data is divided into 100 sec bins |
 |
 |
| Module-wise count rates for Quadrant D Data is divided into 100 sec bins |
 |
 |
| Parameter | Plot |
|---|---|
| CZT HV Monitor |  |
| D_VDD | 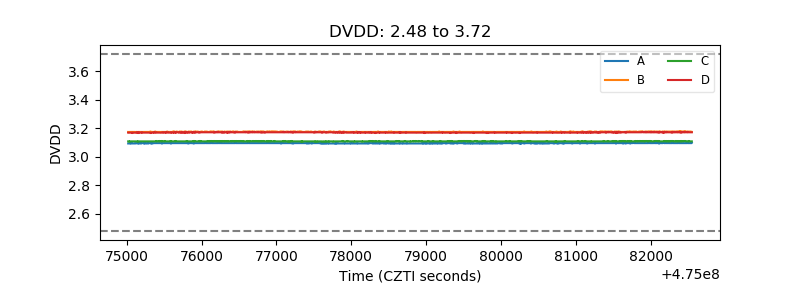 |
| Temperature 1 | 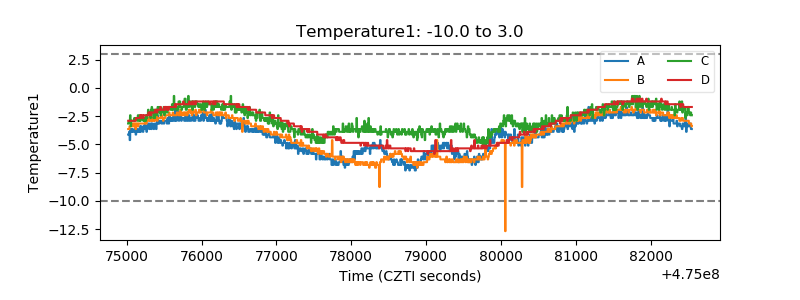 |
| Veto HV Monitor | 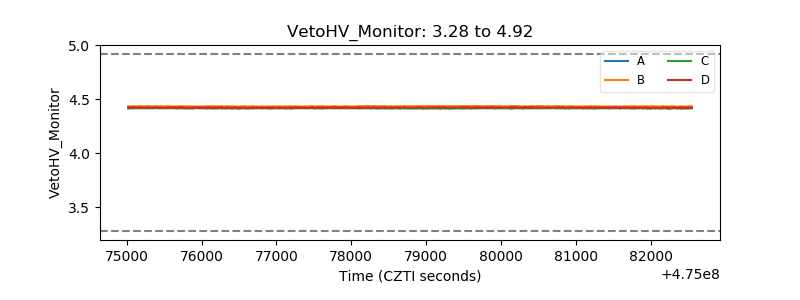 |
| Veto LLD | 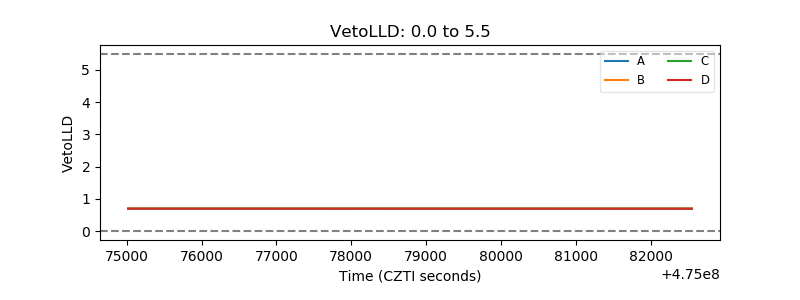 |
| Alpha Counter | 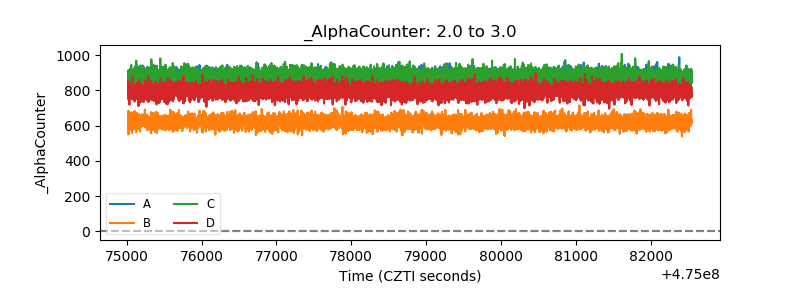 |
| _CPM_Rate | 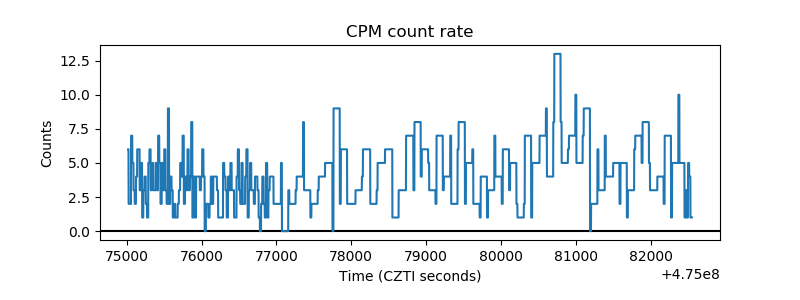 |
| CZT Counter | 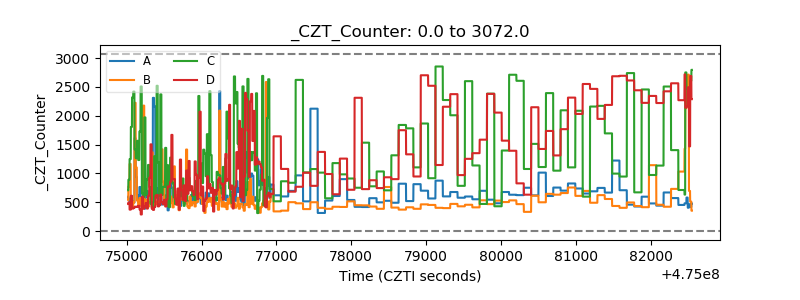 |
| +2.5 Volts monitor |  |
| +5 Volts monitor | 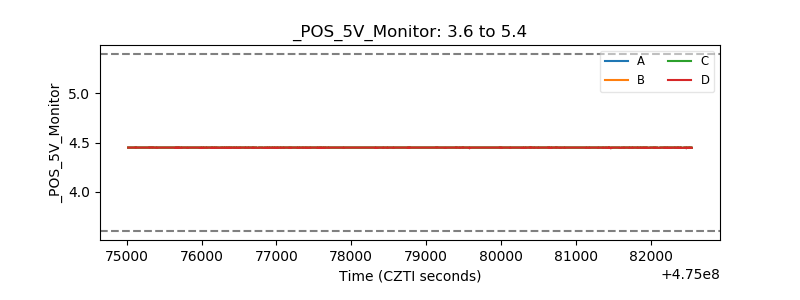 |
| _ROLL_ROT | 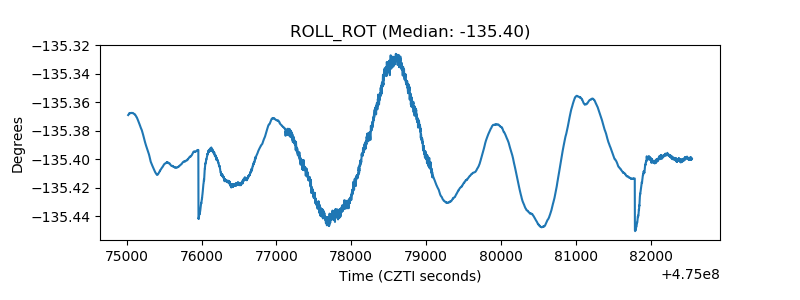 |
| _Roll_DEC | 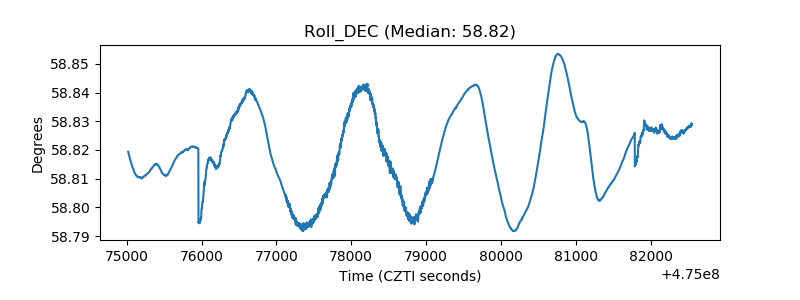 |
| _Roll_RA | 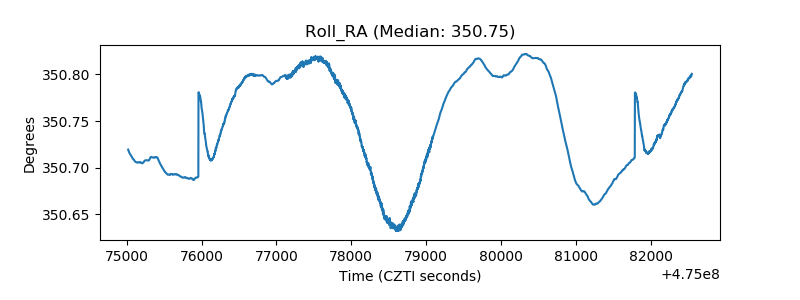 |
| Veto Counter | 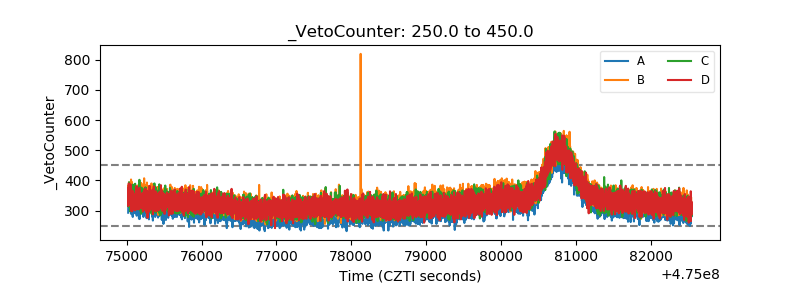 |