| Param | Original file | Final file |
|---|---|---|
| Filename | modeM0/AS1C09_003T01_9000006442_50382cztM0_level2.fits | modeM0/AS1C09_003T01_9000006442_50382cztM0_level2_quad_clean.evt |
| Size (bytes) | 1,048,731,840 | 76,331,520 |
| Size | 1000.1 MB | 72.8 MB |
| Events in quadrant A | 5,083,141 | 639,607 |
| Events in quadrant B | 4,921,827 | 679,280 |
| Events in quadrant C | 11,232,211 | 431,564 |
| Events in quadrant D | 17,038,532 | 69,421 |
| Mode M0 | |||
|---|---|---|---|
| Quadrant | BADHDUFLAG | Total packets | Discarded packets |
| A | 0 | 19872 | 0 |
| B | 0 | 19491 | 0 |
| C | 0 | 38305 | 0 |
| D | 0 | 55299 | 0 |
| Mode SS | |||
|---|---|---|---|
| Quadrant | BADHDUFLAG | Total packets | Discarded packets |
| A | 0 | 140 | 0 |
| B | 0 | 140 | 0 |
| C | 0 | 140 | 0 |
| D | 0 | 140 | 0 |
| Quadrant | Total seconds | Saturated seconds | Saturation percentage |
|---|---|---|---|
| A | 7053 | 256 | 3.629661% |
| B | 7053 | 450 | 6.380264% |
| C | 7053 | 2490 | 35.304126% |
| D | 7053 | 6422 | 91.053452% |
Noise dominated data is calculated using 1-second bins in cleaned event files. If a bin has >2000 counts, and if more than 50% of those come from <1% of pixels, then it is considered to be noise-dominated and hence unusable.
| Quadrant | # 1 sec bins | Bins with >0 counts | Bins with >2000 counts | High rate bins dominated by noise | Noise dominated (total time) | Noise dominated (detector-on time) | Marked lightcurve |
|---|---|---|---|---|---|---|---|
| A | 7053 | 7053 | 232 | 232 | 3.29% | 3.29% | 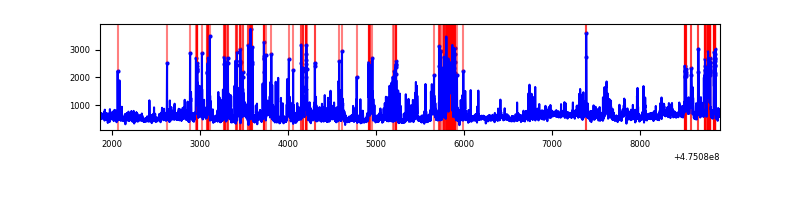 |
| B | 7053 | 7053 | 343 | 343 | 4.86% | 4.86% | 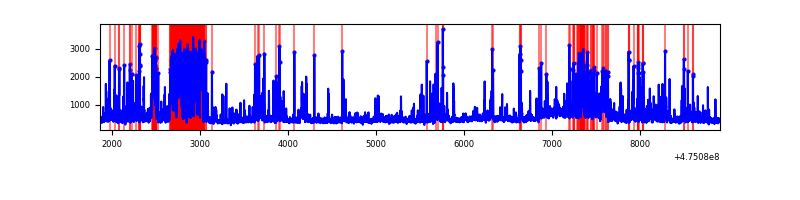 |
| C | 7053 | 7053 | 2406 | 2406 | 34.11% | 34.11% | 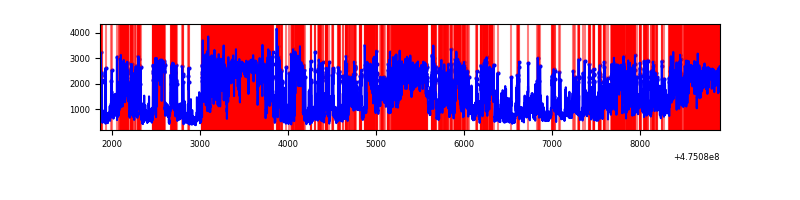 |
| D | 7052 | 7052 | 6314 | 6314 | 89.53% | 89.53% | 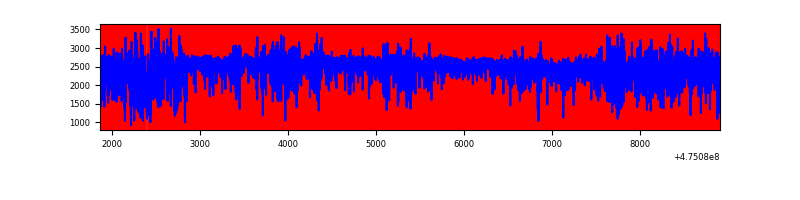 |
Top three noisy pixels from each quadrant. If the there are fewer than three noisy pixels in the level2.evt file, extra rows are filled as -1
| Pixel properties | Quadrant properties | ||||||
|---|---|---|---|---|---|---|---|
| Quadrant | DetID | PixID | Counts | Sigma | Mean | Median | Sigma |
| A | 3 | 63 | 835679 | 4523.35 | 736 | 717 | 184.6 |
| A | 4 | 3 | 374426 | 2024.54 | 736 | 717 | 184.6 |
| A | 3 | 14 | 251024 | 1356.02 | 736 | 717 | 184.6 |
| B | 10 | 43 | 957347 | 6121.8 | 726 | 701 | 156.3 |
| B | 5 | 185 | 237263 | 1513.82 | 726 | 701 | 156.3 |
| B | 0 | 213 | 152844 | 973.6 | 726 | 701 | 156.3 |
| C | 15 | 127 | 1678833 | 9405.27 | 632 | 628 | 178.4 |
| C | 0 | 208 | 1241903 | 6956.56 | 632 | 628 | 178.4 |
| C | 14 | 245 | 863280 | 4834.62 | 632 | 628 | 178.4 |
| D | 7 | 61 | 10961640 | 88505.13 | 418 | 402 | 123.8 |
| D | 15 | 169 | 753982 | 6084.69 | 418 | 402 | 123.8 |
| D | 7 | 60 | 524522 | 4231.94 | 418 | 402 | 123.8 |
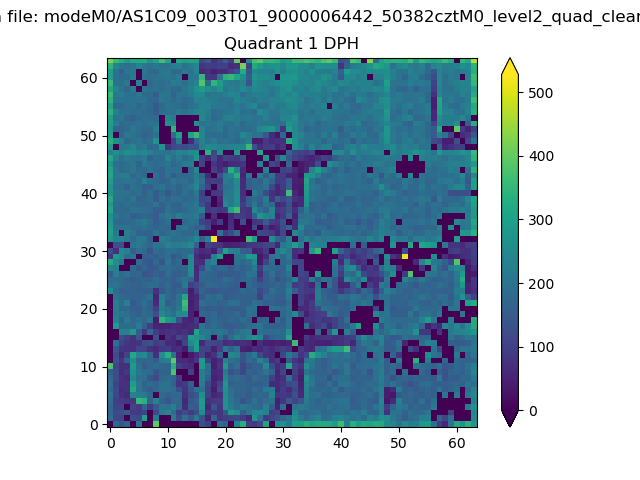
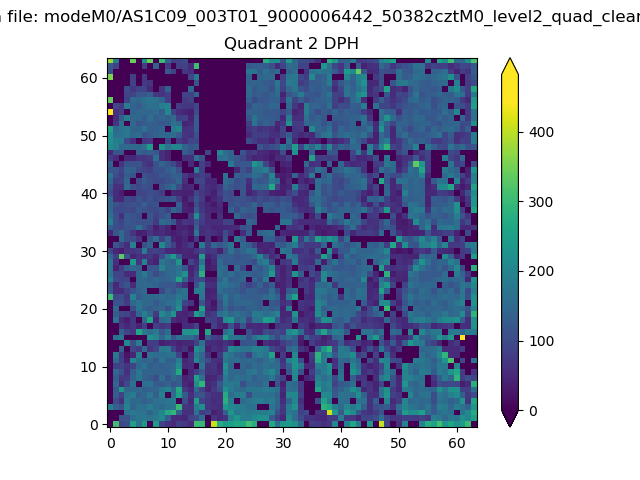
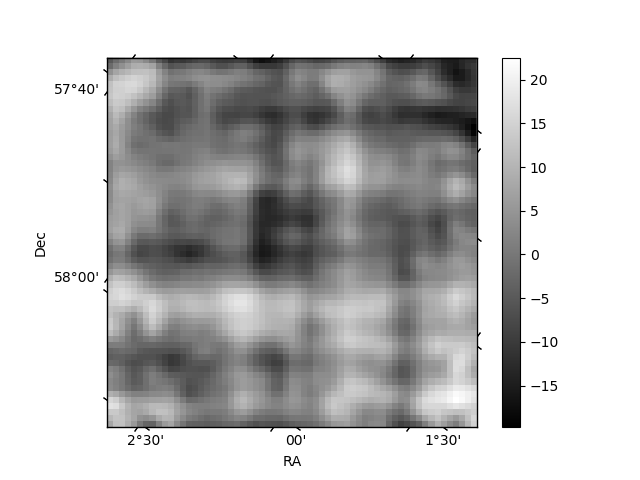
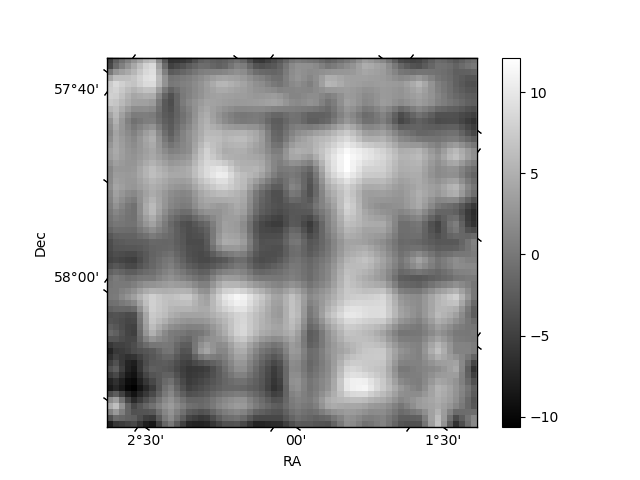
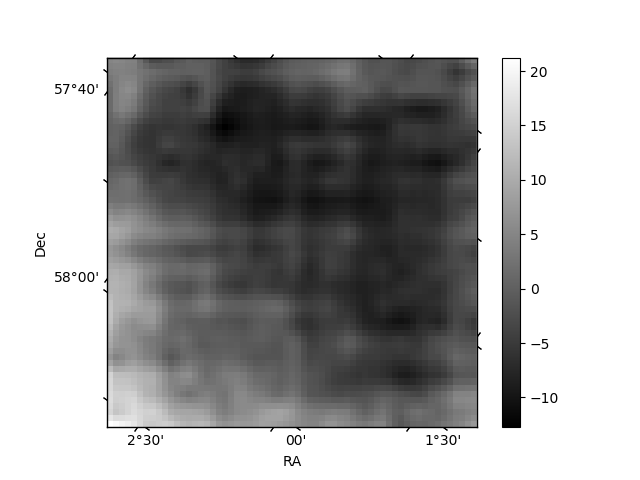
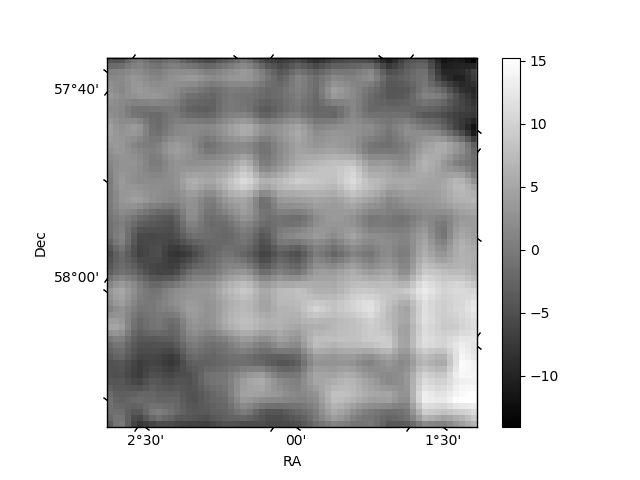
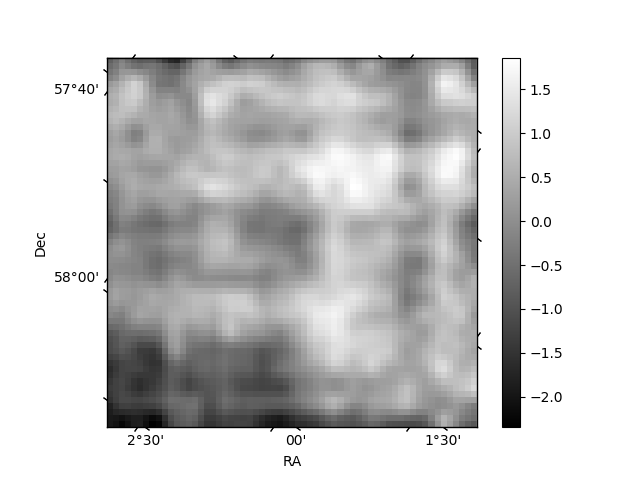
Histogram calculated using DETX and DETY for each event in the final _common_clean file
| Quadrant A |  |
 |
Quadrant B |
|---|---|---|---|
| Quadrant D | 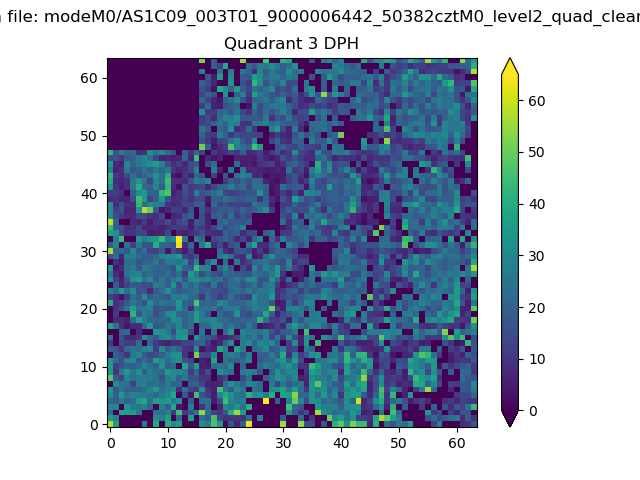 |
 |
Quadrant C |
| Plot type | Count rate plots | Images |
|---|---|---|
| Comparison with Poisson distribution Blue bars denote a histogram of data divided into 1 sec bins. Red curve is a Poisson curve with rate = median count rate of data. |
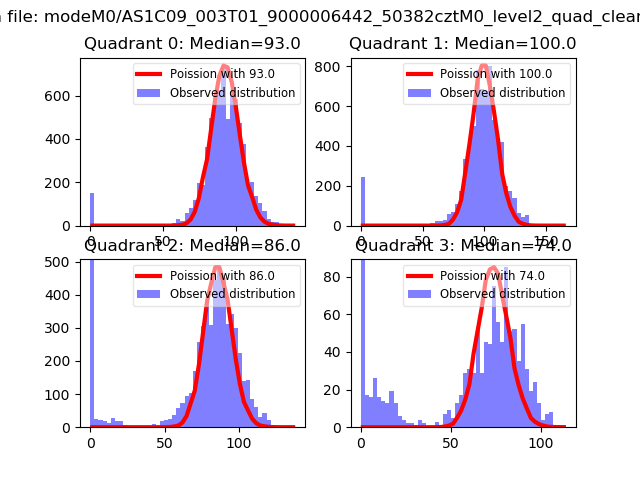 |
 |
| Quadrant-wise count rates Data is divided into 100 sec bins |
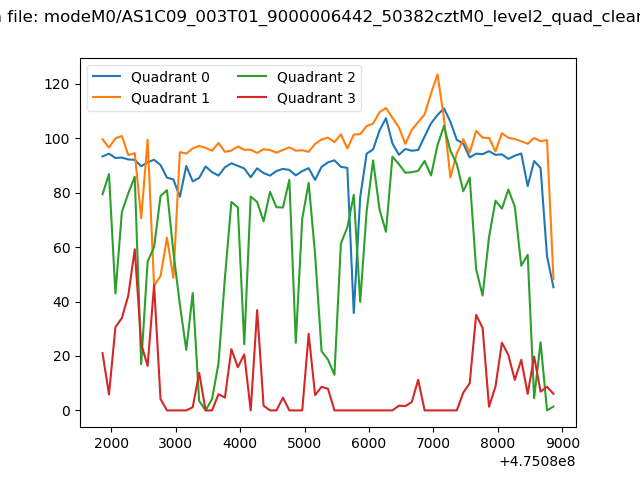 |
|
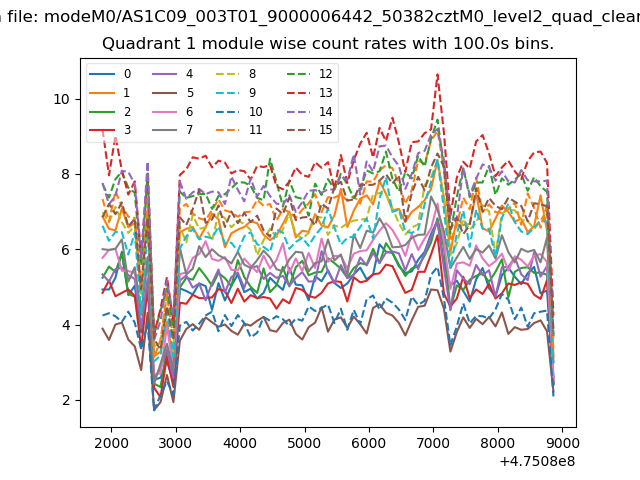
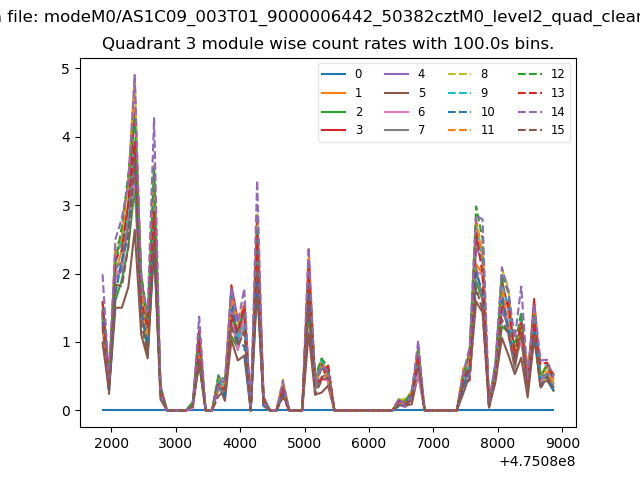
| Module-wise count rates for Quadrant A Data is divided into 100 sec bins |
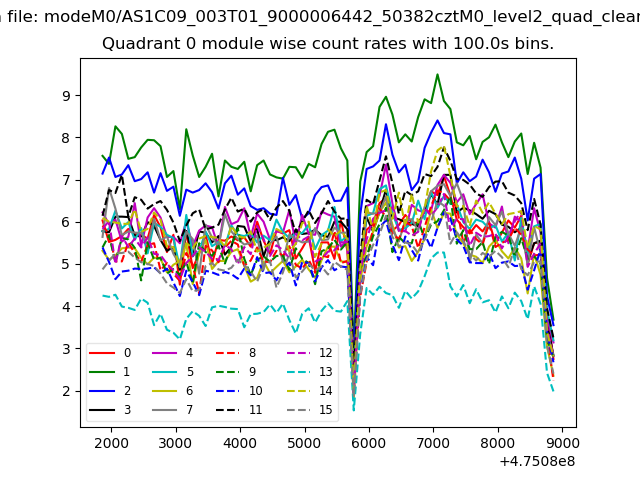 |
 |
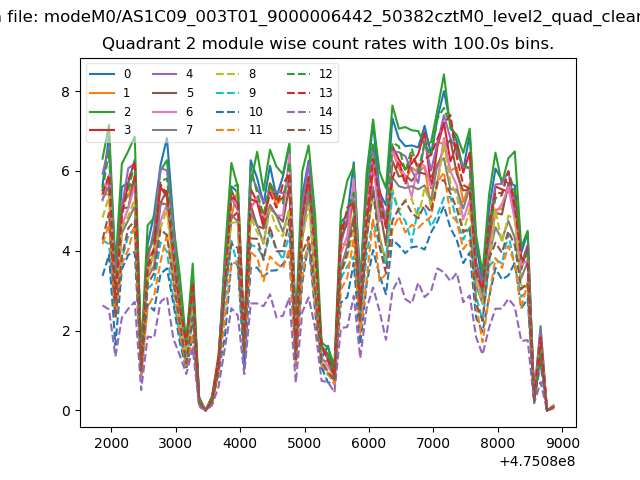
| Module-wise count rates for Quadrant B Data is divided into 100 sec bins |
 |
 |
| Module-wise count rates for Quadrant C Data is divided into 100 sec bins |
 |
 |
| Module-wise count rates for Quadrant D Data is divided into 100 sec bins |
 |
 |
| Parameter | Plot |
|---|---|
| CZT HV Monitor | 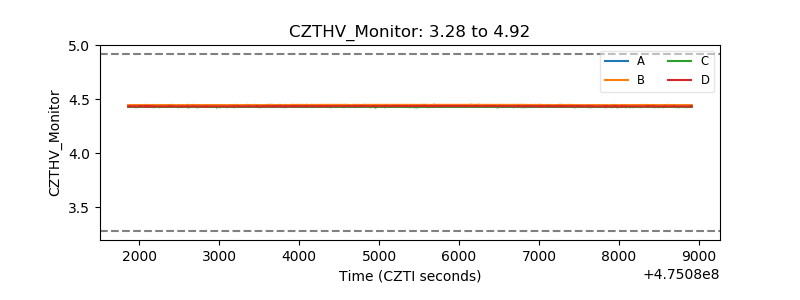 |
| D_VDD | 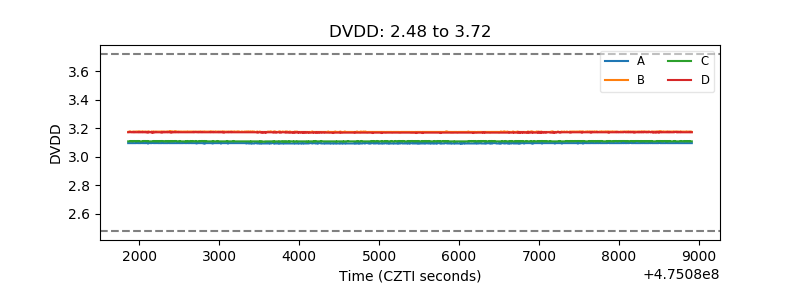 |
| Temperature 1 | 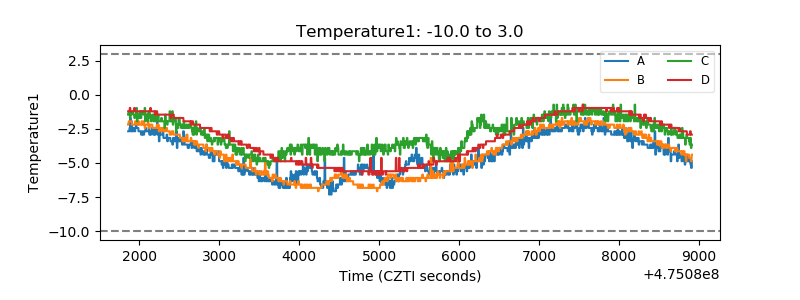 |
| Veto HV Monitor |  |
| Veto LLD | 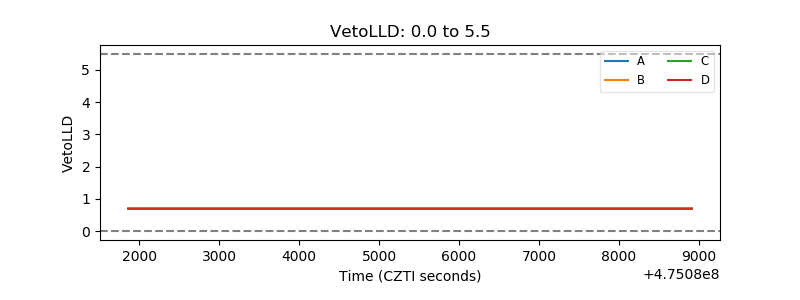 |
| Alpha Counter | 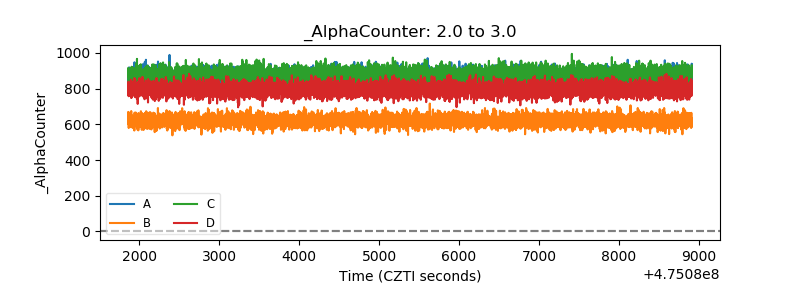 |
| _CPM_Rate | 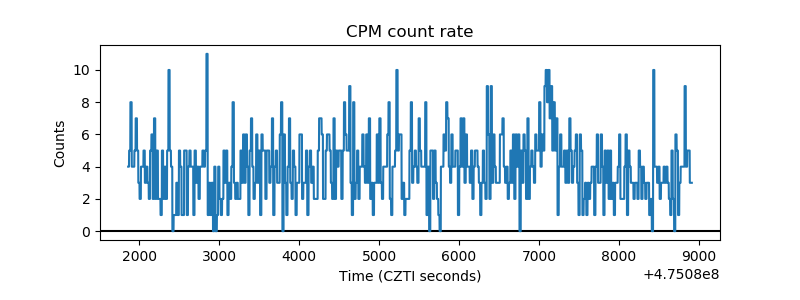 |
| CZT Counter | 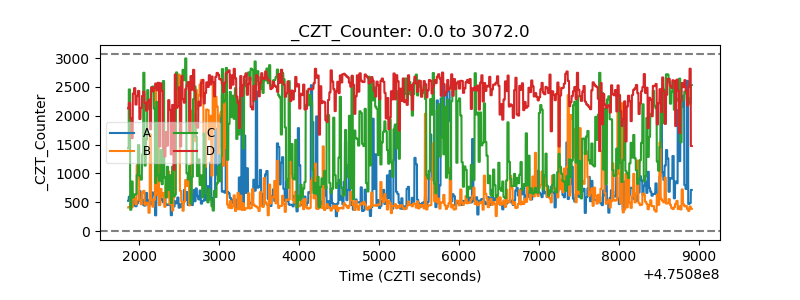 |
| +2.5 Volts monitor | 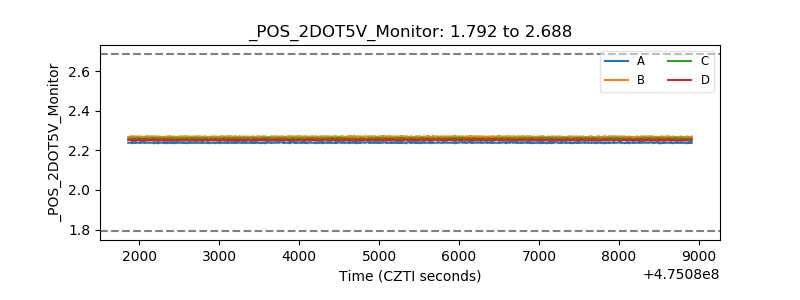 |
| +5 Volts monitor |  |
| _ROLL_ROT | 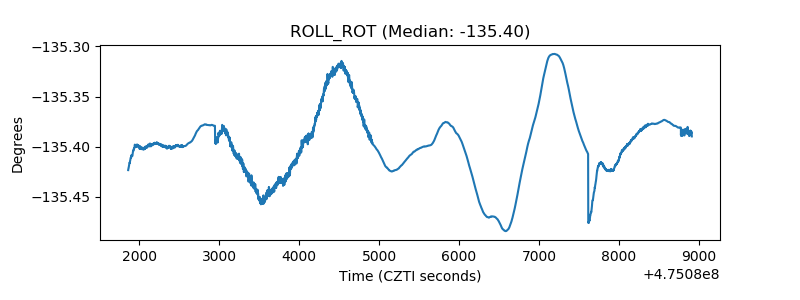 |
| _Roll_DEC | 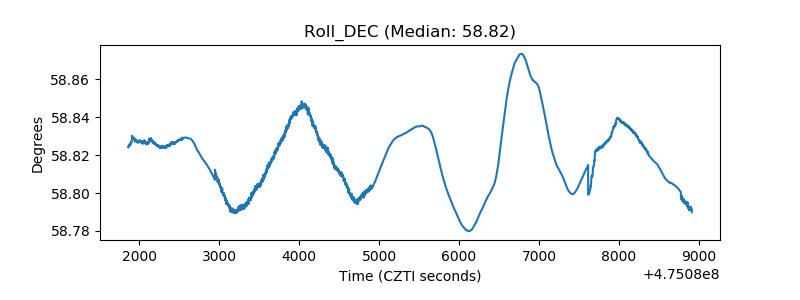 |
| _Roll_RA | 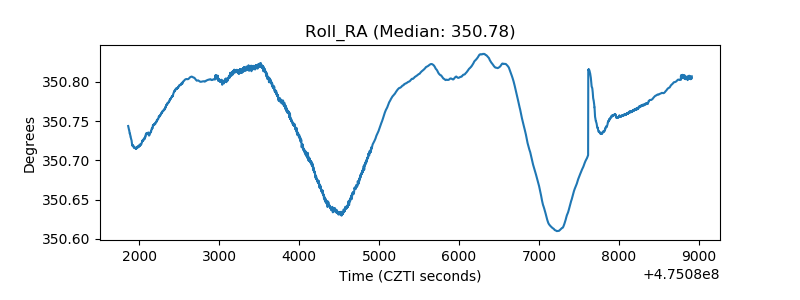 |
| Veto Counter | 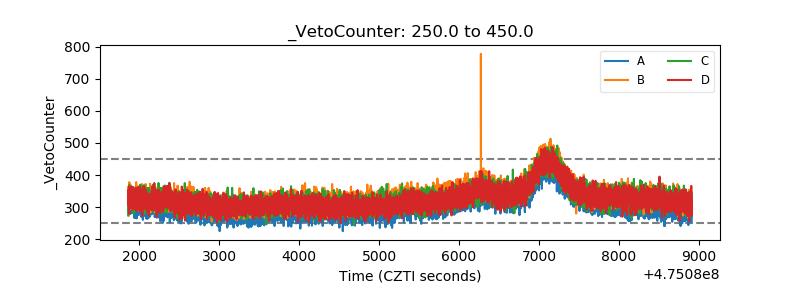 |