| Param | Original file | Final file |
|---|---|---|
| Filename | modeM0/AS1C09_003T01_9000006442_50389cztM0_level2.fits | modeM0/AS1C09_003T01_9000006442_50389cztM0_level2_quad_clean.evt |
| Size (bytes) | 535,392,000 | 93,784,320 |
| Size | 510.6 MB | 89.4 MB |
| Events in quadrant A | 4,647,544 | 602,230 |
| Events in quadrant B | 4,207,081 | 648,862 |
| Events in quadrant C | 4,918,885 | 593,662 |
| Events in quadrant D | 5,530,658 | 532,823 |
| Mode M9 | |||
|---|---|---|---|
| Quadrant | BADHDUFLAG | Total packets | Discarded packets |
| A | 0 | 15 | 0 |
| B | 0 | 16 | 0 |
| C | 0 | 16 | 0 |
| D | 0 | 16 | 0 |
| Mode M0 | |||
|---|---|---|---|
| Quadrant | BADHDUFLAG | Total packets | Discarded packets |
| A | 0 | 18185 | 2 |
| B | 0 | 17224 | 2 |
| C | 0 | 19141 | 2 |
| D | 0 | 21097 | 3 |
| Mode SS | |||
|---|---|---|---|
| Quadrant | BADHDUFLAG | Total packets | Discarded packets |
| A | 0 | 134 | 0 |
| B | 0 | 134 | 0 |
| C | 0 | 134 | 0 |
| D | 0 | 134 | 0 |
| Quadrant | Total seconds | Saturated seconds | Saturation percentage |
|---|---|---|---|
| A | 6629 | 343 | 5.174234% |
| B | 6629 | 399 | 6.019007% |
| C | 6629 | 308 | 4.646251% |
| D | 6628 | 579 | 8.735667% |
Noise dominated data is calculated using 1-second bins in cleaned event files. If a bin has >2000 counts, and if more than 50% of those come from <1% of pixels, then it is considered to be noise-dominated and hence unusable.
| Quadrant | # 1 sec bins | Bins with >0 counts | Bins with >2000 counts | High rate bins dominated by noise | Noise dominated (total time) | Noise dominated (detector-on time) | Marked lightcurve |
|---|---|---|---|---|---|---|---|
| A | 7659 | 6629 | 257 | 257 | 3.36% | 3.88% | 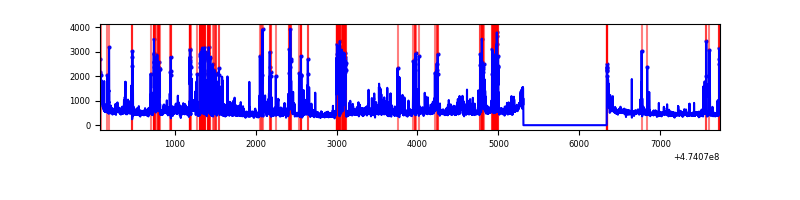 |
| B | 7659 | 6630 | 291 | 291 | 3.80% | 4.39% | 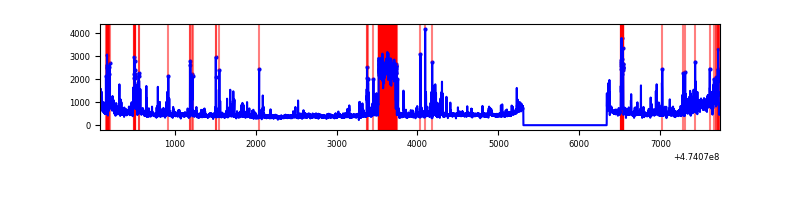 |
| C | 7659 | 6630 | 233 | 233 | 3.04% | 3.51% | 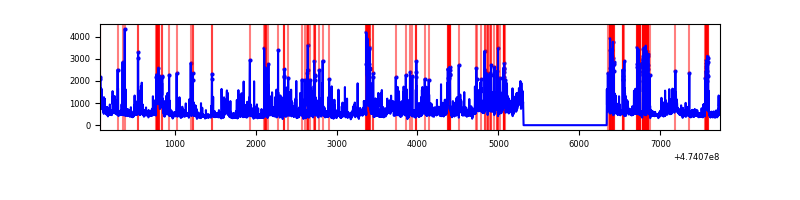 |
| D | 7658 | 6628 | 505 | 505 | 6.59% | 7.62% | 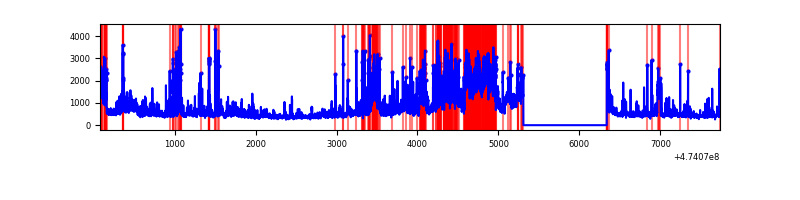 |
Top three noisy pixels from each quadrant. If the there are fewer than three noisy pixels in the level2.evt file, extra rows are filled as -1
| Pixel properties | Quadrant properties | ||||||
|---|---|---|---|---|---|---|---|
| Quadrant | DetID | PixID | Counts | Sigma | Mean | Median | Sigma |
| A | 3 | 98 | 415659 | 2415.85 | 699 | 683 | 171.8 |
| A | 10 | 253 | 214319 | 1243.72 | 699 | 683 | 171.8 |
| A | 3 | 231 | 195759 | 1135.67 | 699 | 683 | 171.8 |
| B | 5 | 185 | 794403 | 5343.04 | 698 | 674 | 148.6 |
| B | 3 | 249 | 255866 | 1717.84 | 698 | 674 | 148.6 |
| B | 8 | 128 | 93928 | 627.75 | 698 | 674 | 148.6 |
| C | 0 | 208 | 417293 | 2138.45 | 690 | 683 | 194.8 |
| C | 14 | 245 | 266326 | 1363.54 | 690 | 683 | 194.8 |
| C | 4 | 110 | 223190 | 1142.12 | 690 | 683 | 194.8 |
| D | 3 | 12 | 507278 | 2698.04 | 670 | 646 | 187.8 |
| D | 7 | 61 | 433401 | 2304.61 | 670 | 646 | 187.8 |
| D | 8 | 192 | 298724 | 1587.4 | 670 | 646 | 187.8 |
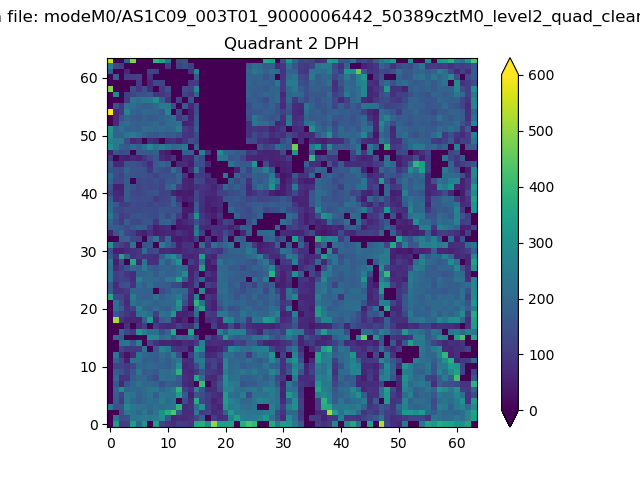
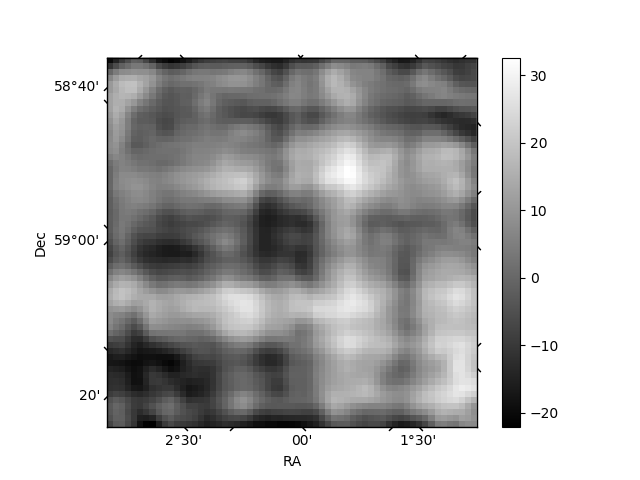
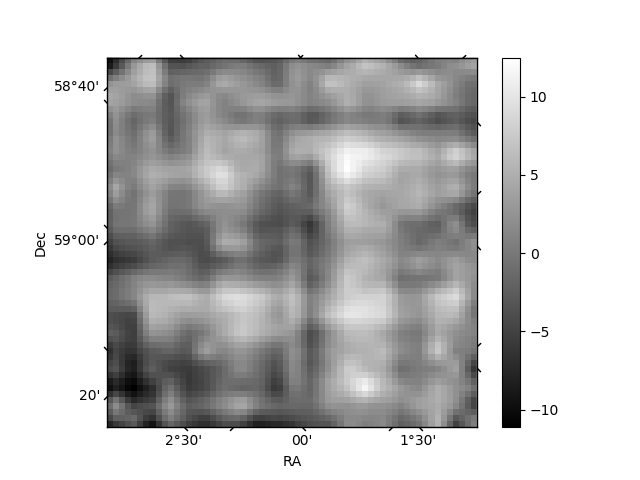
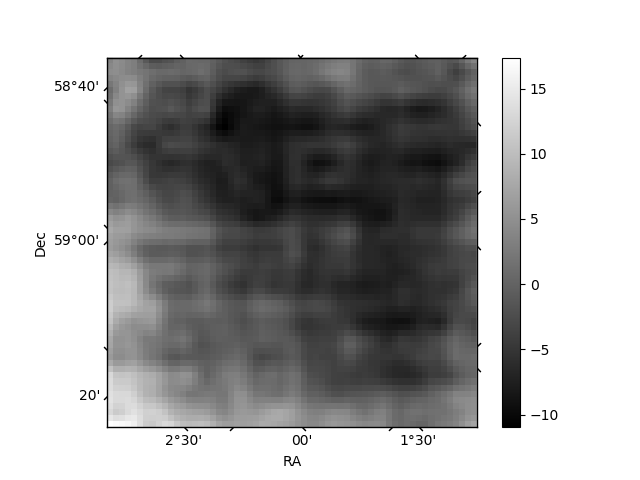
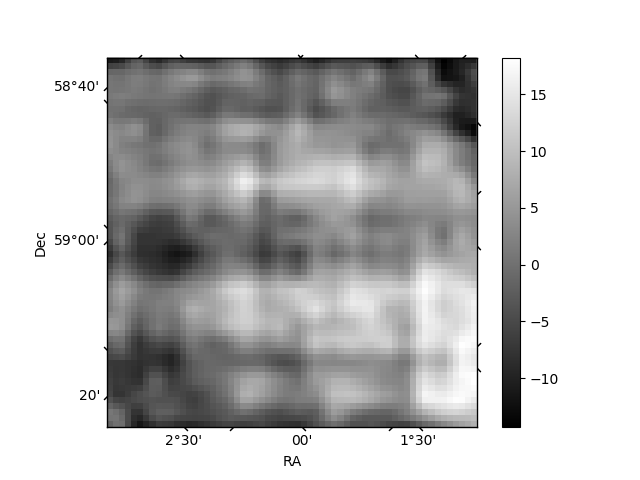
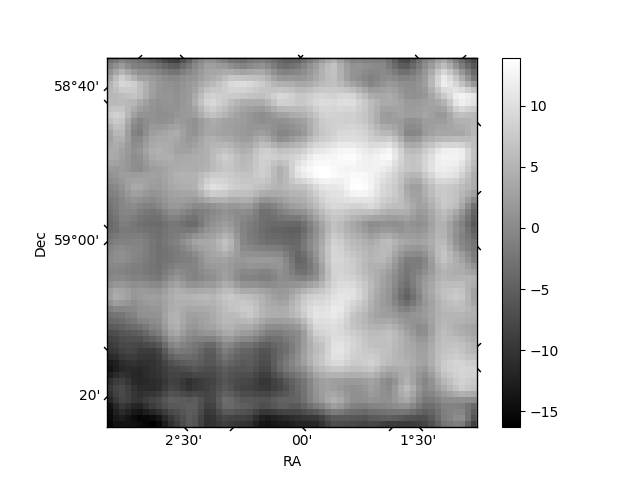
Histogram calculated using DETX and DETY for each event in the final _common_clean file
| Quadrant A | 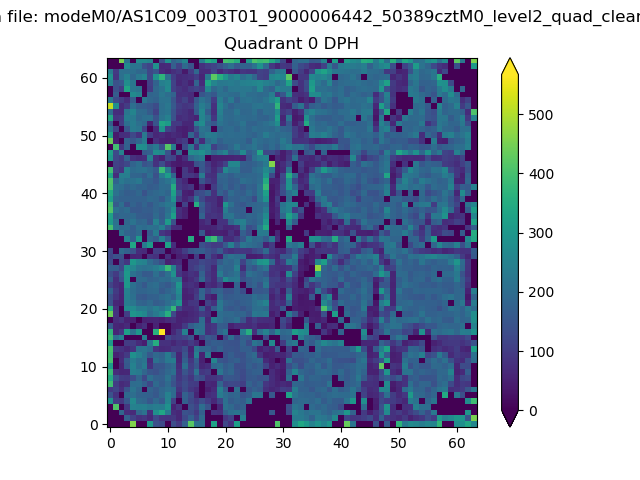 |
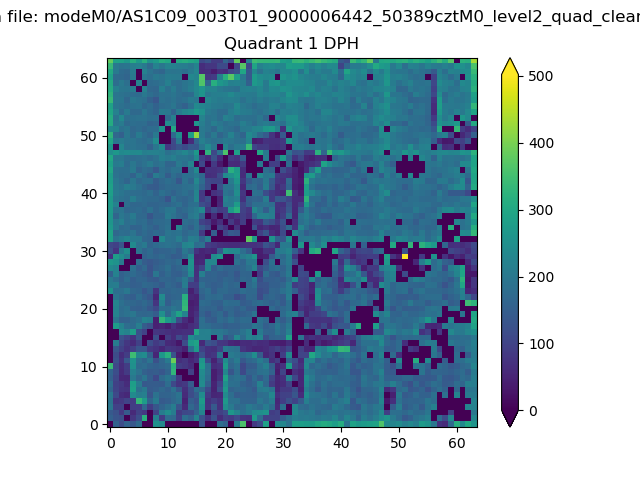 |
Quadrant B |
|---|---|---|---|
| Quadrant D | 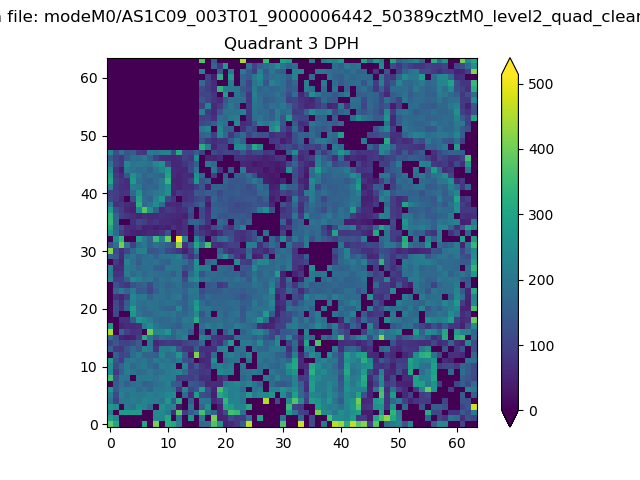 |
 |
Quadrant C |
| Plot type | Count rate plots | Images |
|---|---|---|
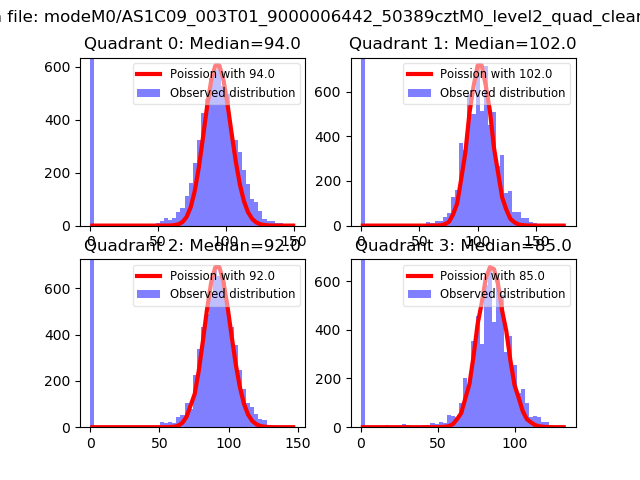
| Comparison with Poisson distribution Blue bars denote a histogram of data divided into 1 sec bins. Red curve is a Poisson curve with rate = median count rate of data. |
 |
 |
| Quadrant-wise count rates Data is divided into 100 sec bins |
 |
|
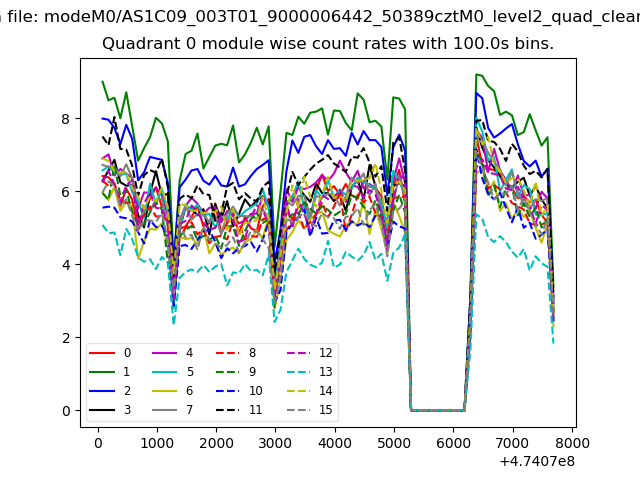
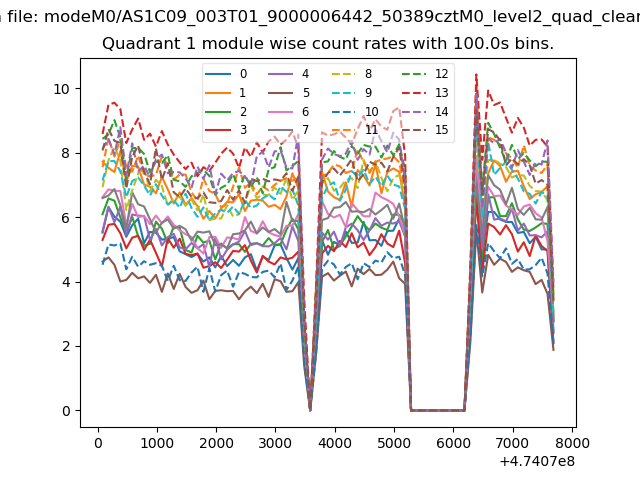
| Module-wise count rates for Quadrant A Data is divided into 100 sec bins |
 |
 |
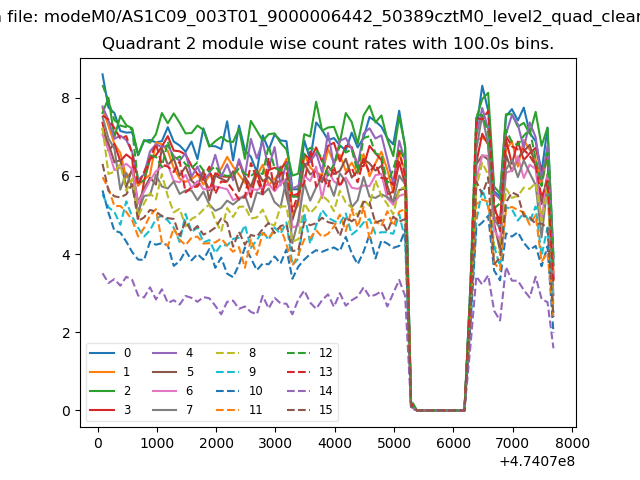
| Module-wise count rates for Quadrant B Data is divided into 100 sec bins |
 |
 |
| Module-wise count rates for Quadrant C Data is divided into 100 sec bins |
 |
 |
| Module-wise count rates for Quadrant D Data is divided into 100 sec bins |
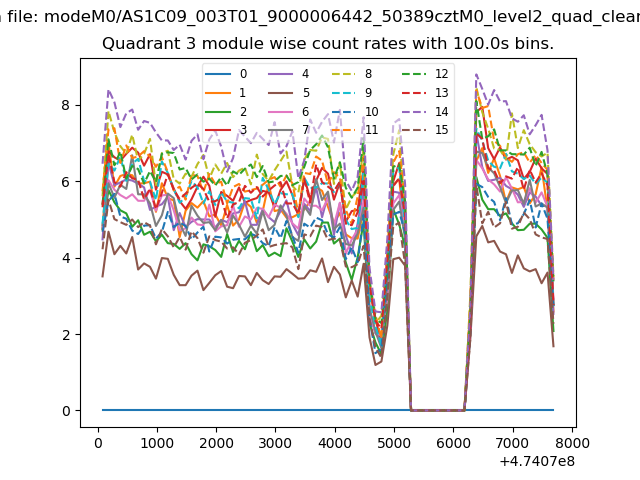 |
 |
| Parameter | Plot |
|---|---|
| CZT HV Monitor | 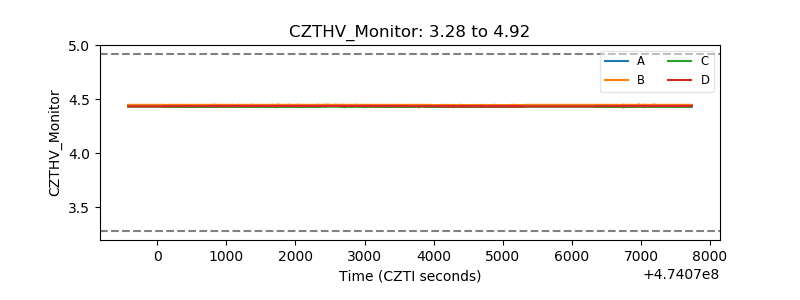 |
| D_VDD | 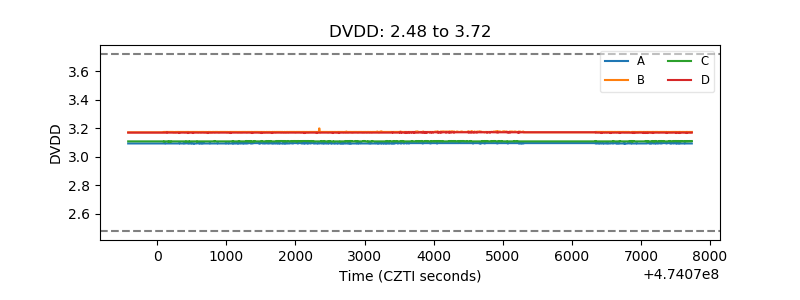 |
| Temperature 1 | 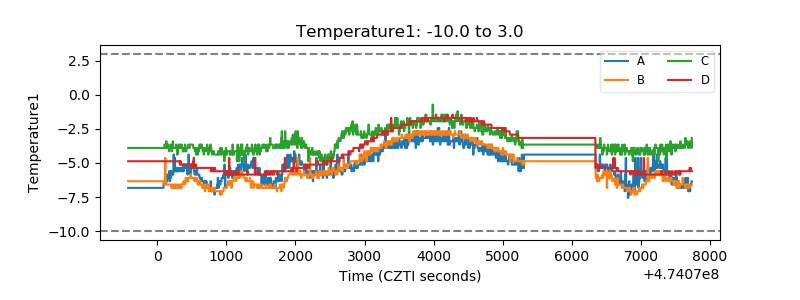 |
| Veto HV Monitor | 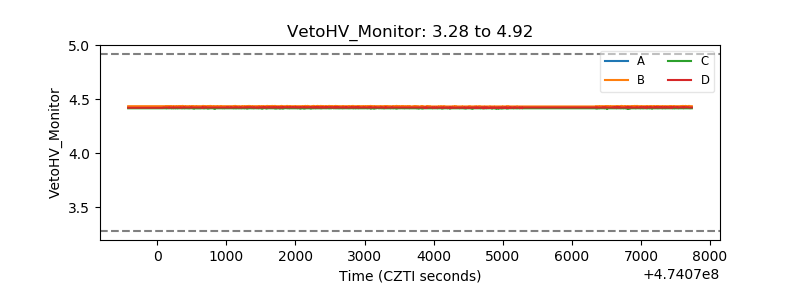 |
| Veto LLD |  |
| Alpha Counter | 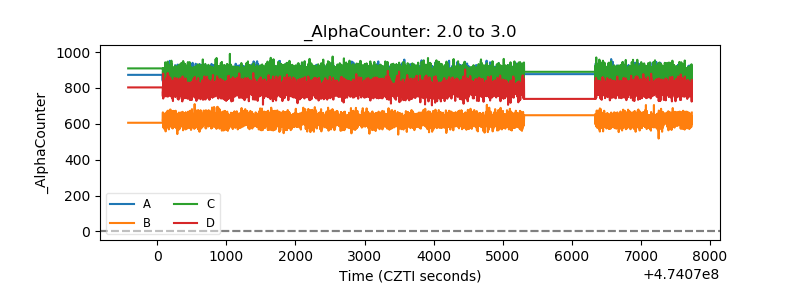 |
| _CPM_Rate | 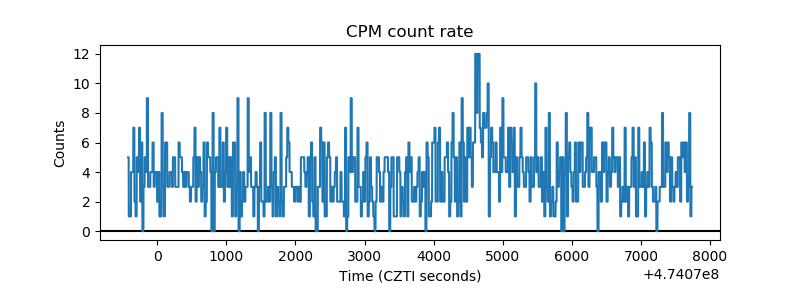 |
| CZT Counter | 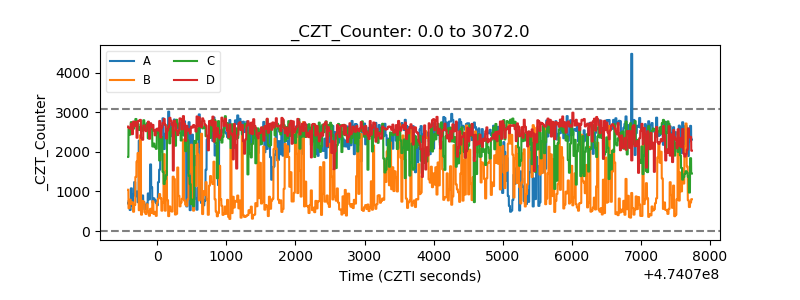 |
| +2.5 Volts monitor | 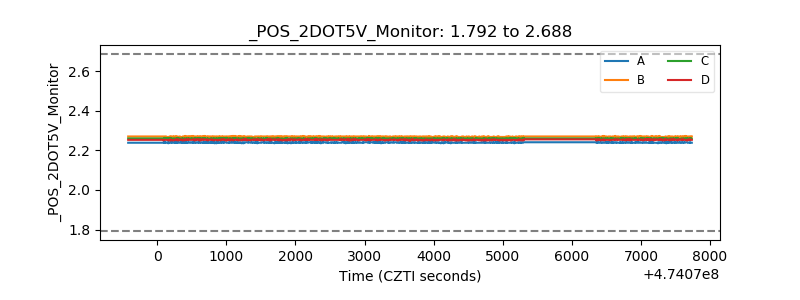 |
| +5 Volts monitor |  |
| _ROLL_ROT | 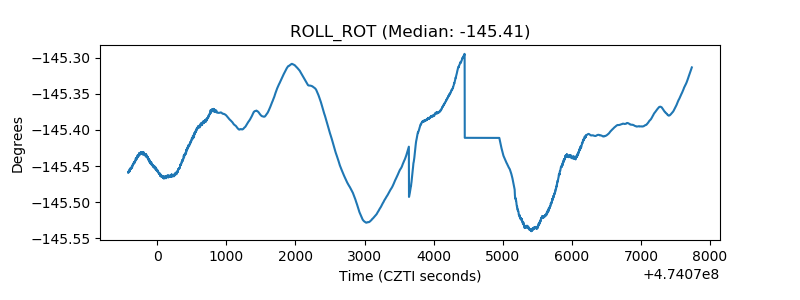 |
| _Roll_DEC | 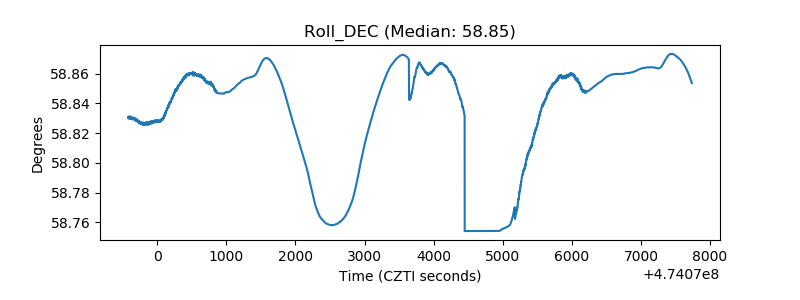 |
| _Roll_RA | 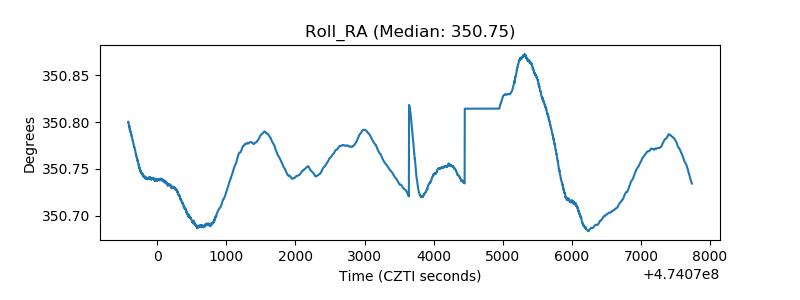 |
| Veto Counter | 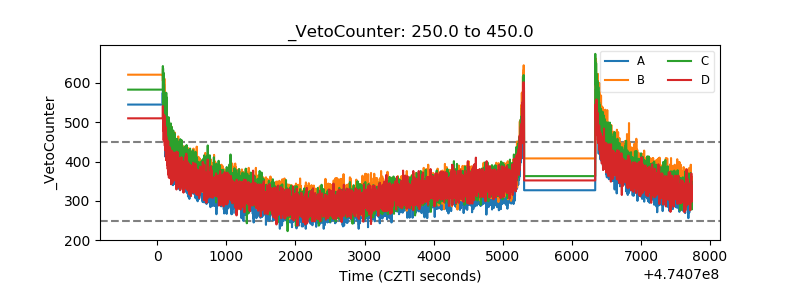 |