| Param | Original file | Final file |
|---|---|---|
| Filename | modeM0/AS1T05_239T01_9000006444cztM0_level2.fits | modeM0/AS1T05_239T01_9000006444cztM0_level2_quad_clean.evt |
| Size (bytes) | 5,374,759,680 | 7,452,072,000 |
| Size | 5.0 GB | 6.9 GB |
| Events in quadrant A | 32,891,908 | 51,418,362 |
| Events in quadrant B | 30,439,812 | 51,406,198 |
| Events in quadrant C | 27,051,566 | 37,811,135 |
| Events in quadrant D | 24,382,628 | 37,287,448 |
| Mode M0 | |||
|---|---|---|---|
| Quadrant | BADHDUFLAG | Total packets | Discarded packets |
| A | 0 | 1980058 | 0 |
| B | 0 | 2376047 | 0 |
| C | 0 | 3102922 | 0 |
| D | 0 | 2911268 | 0 |
| Mode M9 | |||
|---|---|---|---|
| Quadrant | BADHDUFLAG | Total packets | Discarded packets |
| A | 0 | 823 | 0 |
| B | 0 | 824 | 0 |
| C | 0 | 824 | 0 |
| D | 0 | 824 | 0 |
| Mode SS | |||
|---|---|---|---|
| Quadrant | BADHDUFLAG | Total packets | Discarded packets |
| A | 0 | 14142 | 0 |
| B | 0 | 14146 | 0 |
| C | 0 | 14142 | 0 |
| D | 0 | 14142 | 0 |
| Quadrant | Total seconds | Saturated seconds | Saturation percentage |
|---|---|---|---|
| A | 697646 | 46007 | 6.594605% |
| B | 697423 | 99489 | 14.265231% |
| C | 697226 | 204257 | 29.295666% |
| D | 697519 | 167513 | 24.015547% |
Noise dominated data is calculated using 1-second bins in cleaned event files. If a bin has >2000 counts, and if more than 50% of those come from <1% of pixels, then it is considered to be noise-dominated and hence unusable.
| Quadrant | # 1 sec bins | Bins with >0 counts | Bins with >2000 counts | High rate bins dominated by noise | Noise dominated (total time) | Noise dominated (detector-on time) | Marked lightcurve |
|---|---|---|---|---|---|---|---|
| A | 832421 | 696849 | 0 | 0 | 0.00% | 0.00% | 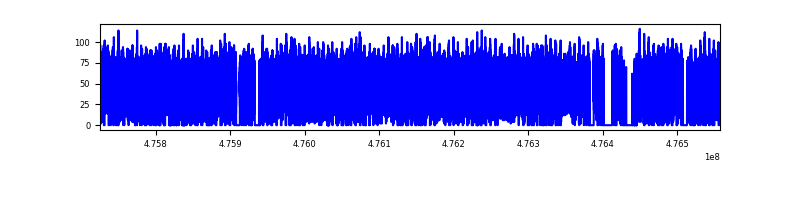 |
| B | 832421 | 696794 | 0 | 0 | 0.00% | 0.00% | 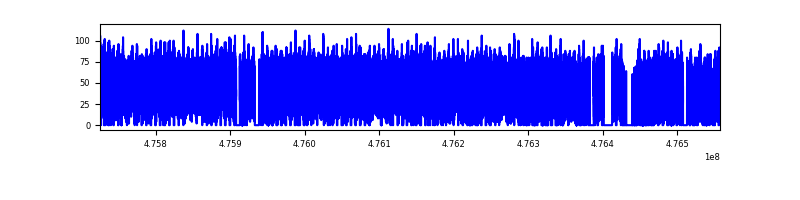 |
| C | 832421 | 687584 | 0 | 0 | 0.00% | 0.00% | 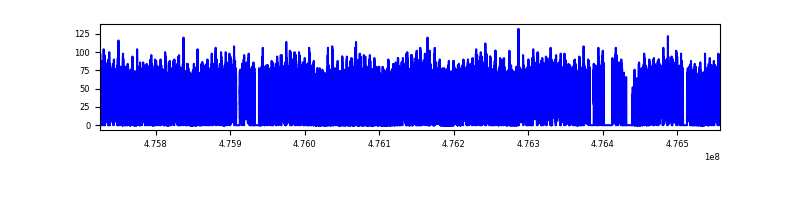 |
| D | 832421 | 686386 | 0 | 0 | 0.00% | 0.00% | 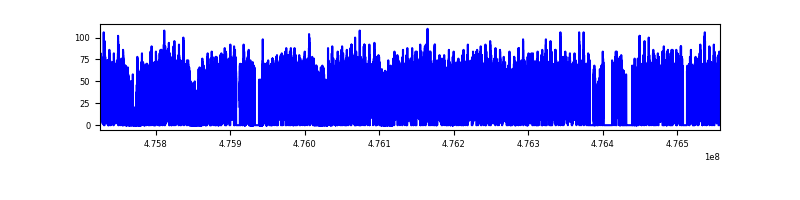 |
Top three noisy pixels from each quadrant. If the there are fewer than three noisy pixels in the level2.evt file, extra rows are filled as -1
| Pixel properties | Quadrant properties | ||||||
|---|---|---|---|---|---|---|---|
| Quadrant | DetID | PixID | Counts | Sigma | Mean | Median | Sigma |
| A | 14 | 188 | 34957 | 9.54 | 8734 | 8073 | 2817.4 |
| A | 9 | 255 | 33210 | 8.92 | 8734 | 8073 | 2817.4 |
| A | 14 | 204 | 28193 | 7.14 | 8734 | 8073 | 2817.4 |
| B | 2 | 9 | 33848 | 14.17 | 8119 | 7720 | 1844.4 |
| B | 2 | 8 | 31165 | 12.71 | 8119 | 7720 | 1844.4 |
| B | 2 | 245 | 24598 | 9.15 | 8119 | 7720 | 1844.4 |
| C | 7 | 221 | 21500 | 6.04 | 7363 | 6711 | 2446.8 |
| C | 6 | 64 | 21118 | 5.89 | 7363 | 6711 | 2446.8 |
| C | 3 | 203 | 20874 | 5.79 | 7363 | 6711 | 2446.8 |
| D | 6 | 218 | 32176 | 11.12 | 7068 | 6288 | 2328.1 |
| D | 14 | 31 | 21601 | 6.58 | 7068 | 6288 | 2328.1 |
| D | 3 | 30 | 21599 | 6.58 | 7068 | 6288 | 2328.1 |
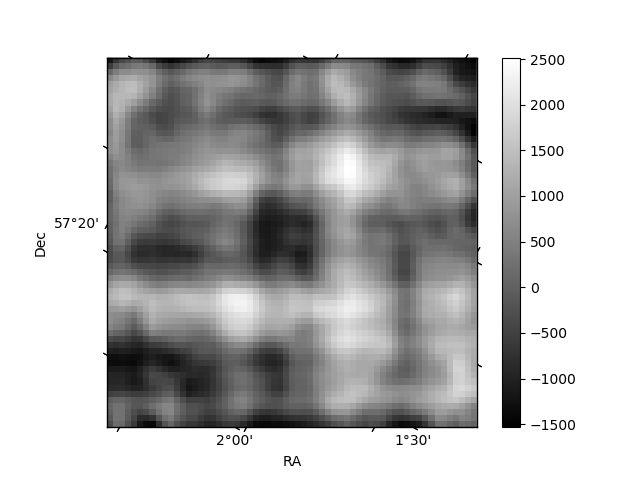
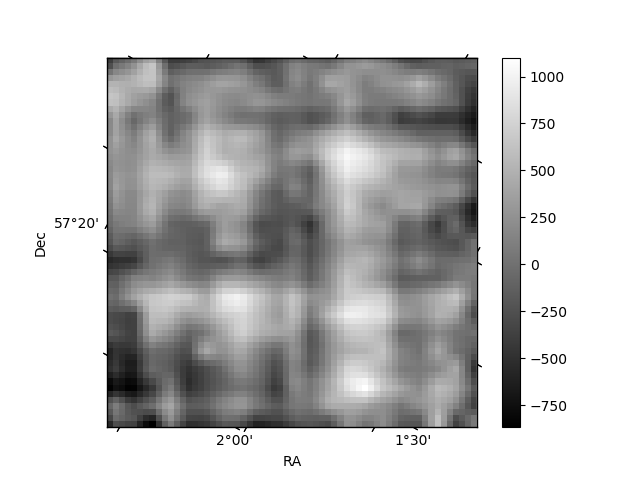
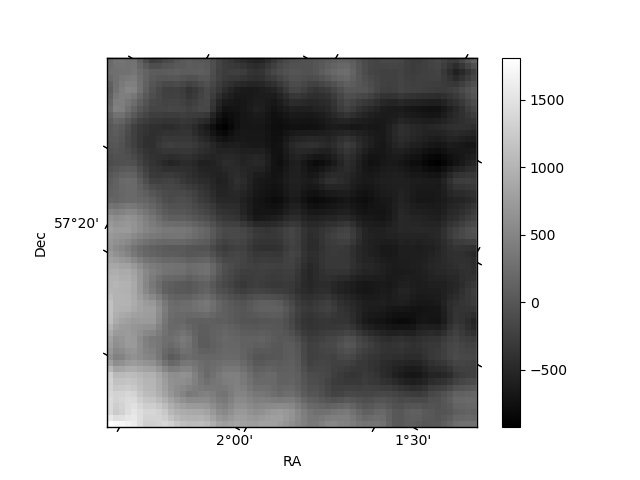
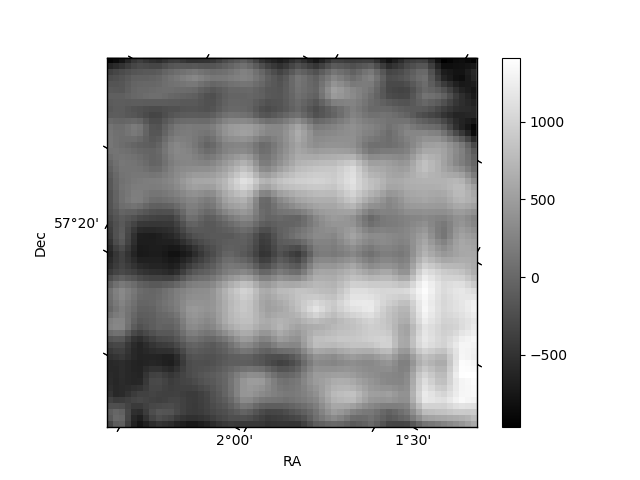
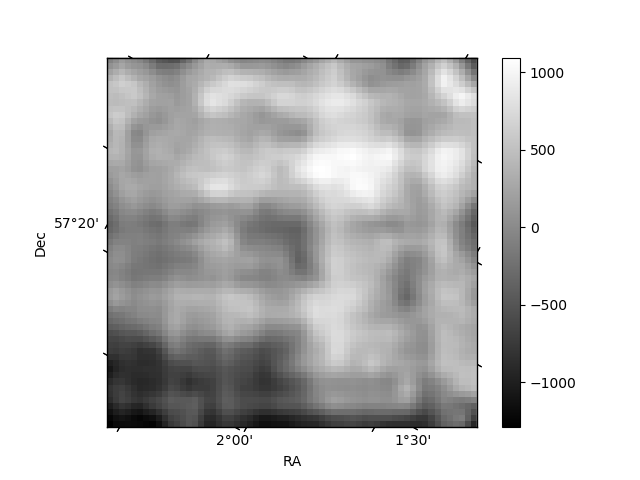
Histogram calculated using DETX and DETY for each event in the final _common_clean file
| Quadrant A | 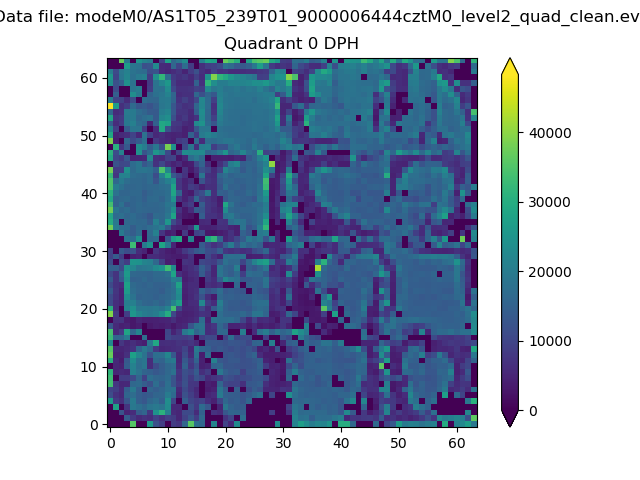 |
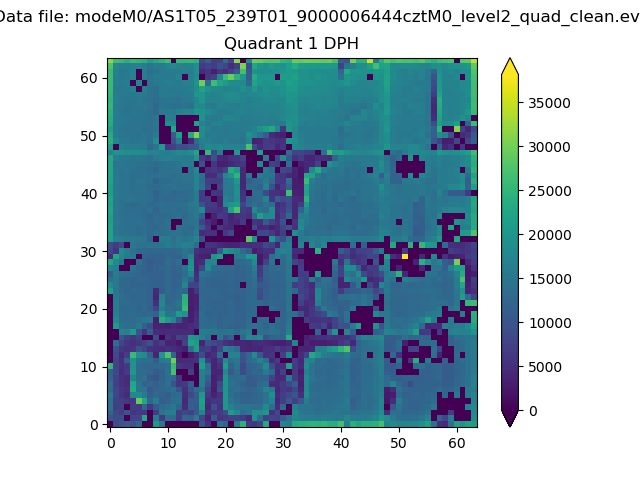 |
Quadrant B |
|---|---|---|---|
| Quadrant D | 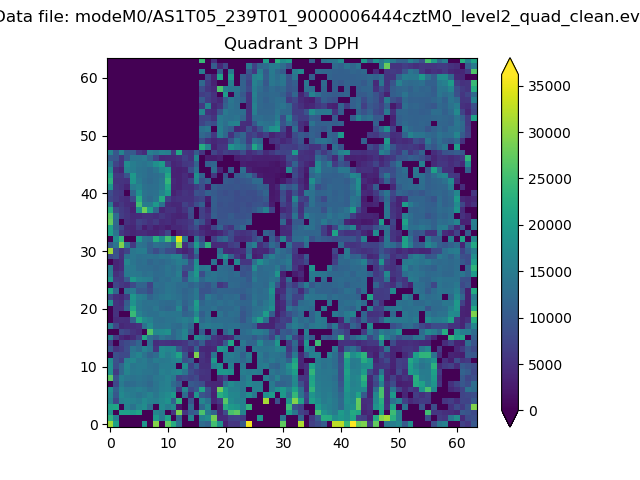 |
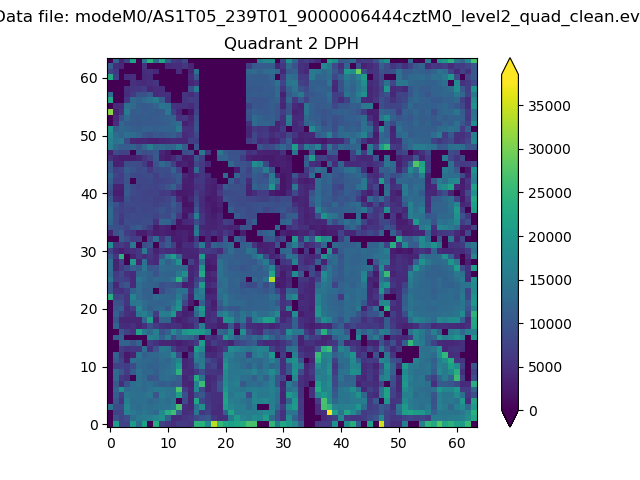 |
Quadrant C |
| Plot type | Count rate plots | Images |
|---|---|---|
| Comparison with Poisson distribution Blue bars denote a histogram of data divided into 1 sec bins. Red curve is a Poisson curve with rate = median count rate of data. |
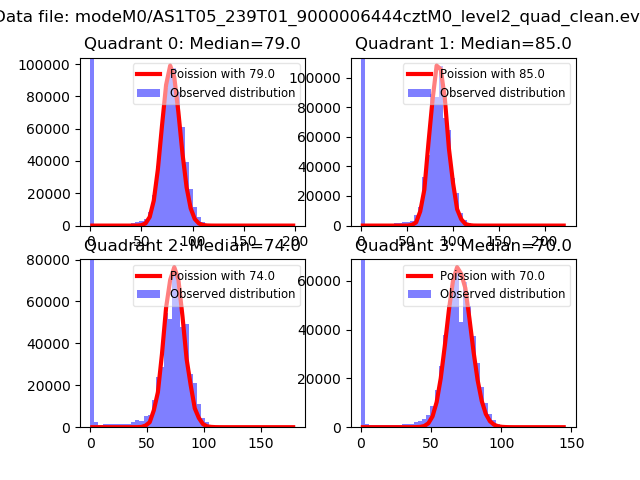 |
 |
| Quadrant-wise count rates Data is divided into 100 sec bins |
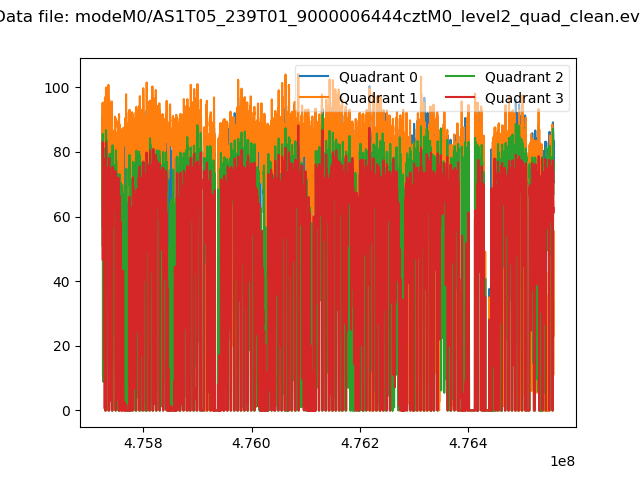 |
|
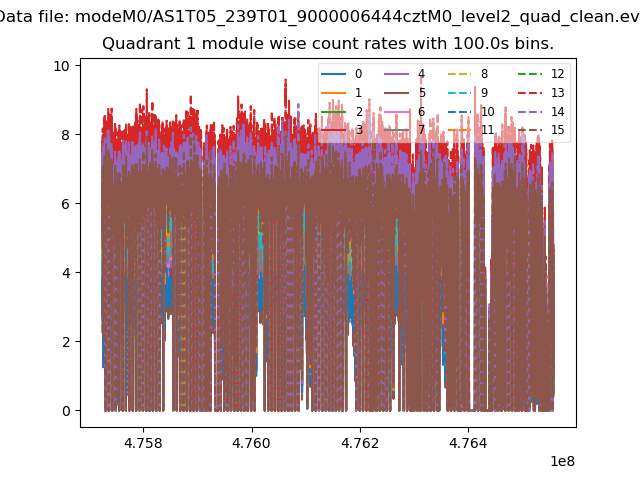
| Module-wise count rates for Quadrant A Data is divided into 100 sec bins |
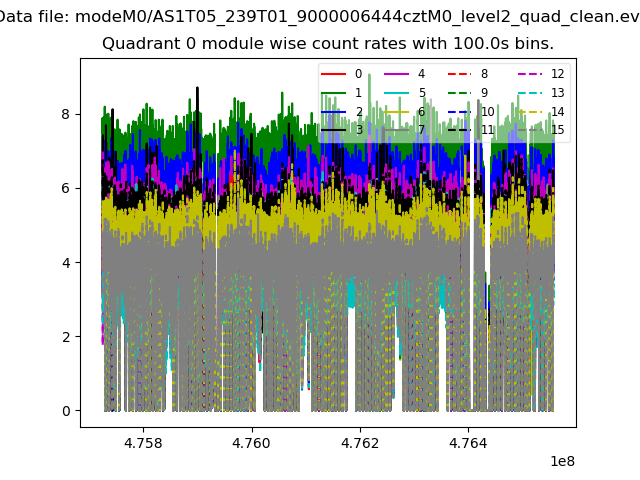 |
 |
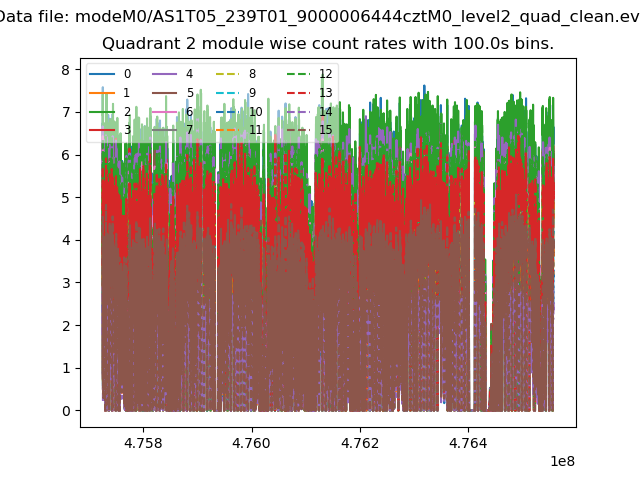
| Module-wise count rates for Quadrant B Data is divided into 100 sec bins |
 |
 |
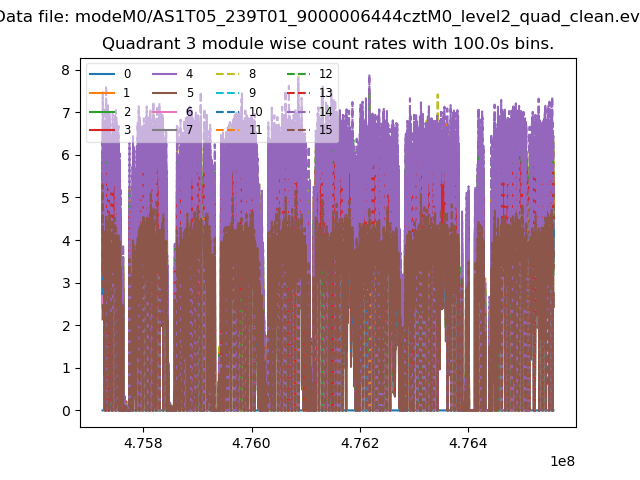
| Module-wise count rates for Quadrant C Data is divided into 100 sec bins |
 |
 |
| Module-wise count rates for Quadrant D Data is divided into 100 sec bins |
 |
 |
| Parameter | Plot |
|---|---|
| CZT HV Monitor | 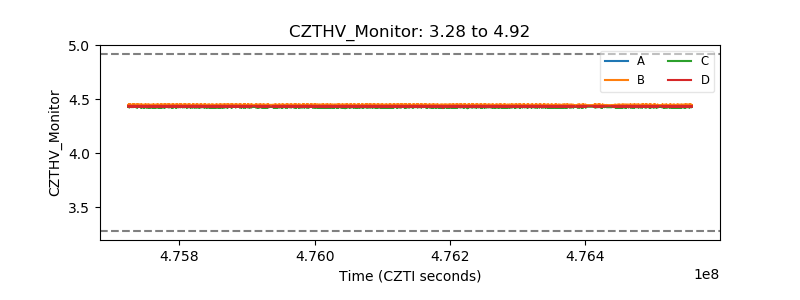 |
| D_VDD | 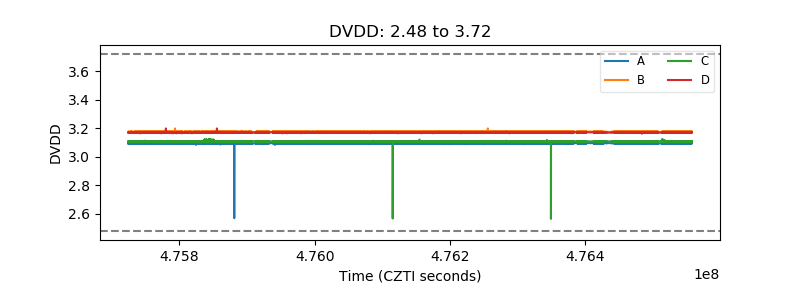 |
| Temperature 1 | 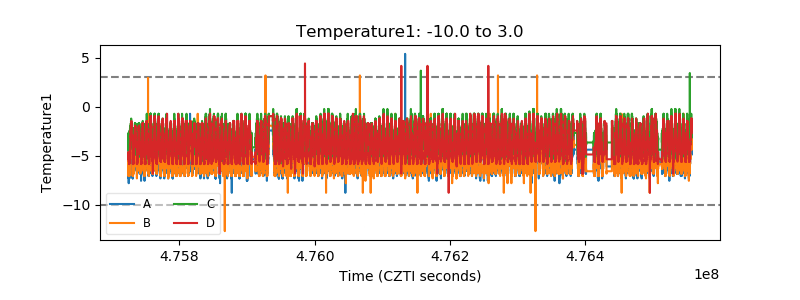 |
| Veto HV Monitor | 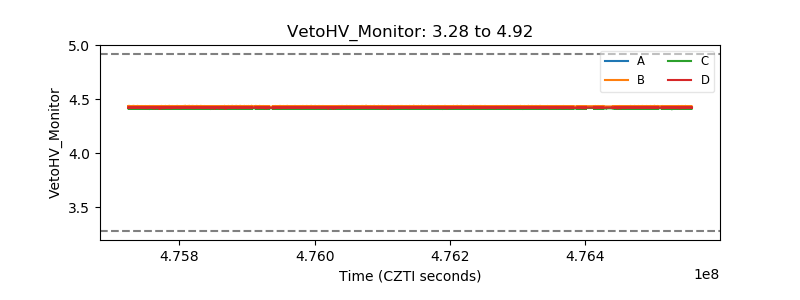 |
| Veto LLD | 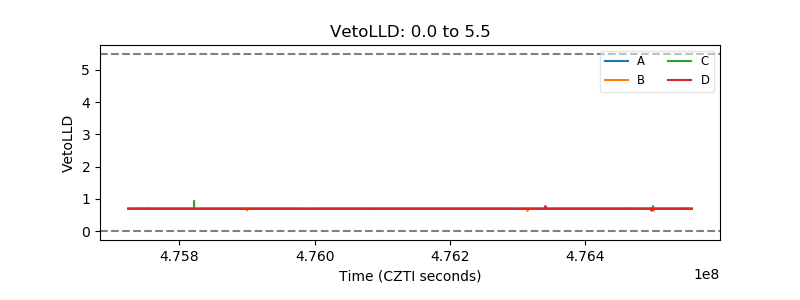 |
| Alpha Counter | 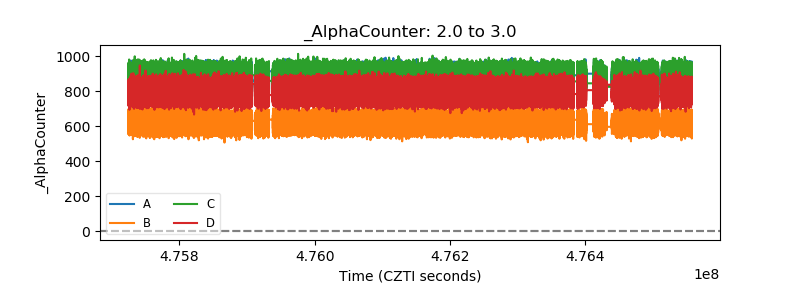 |
| _CPM_Rate | 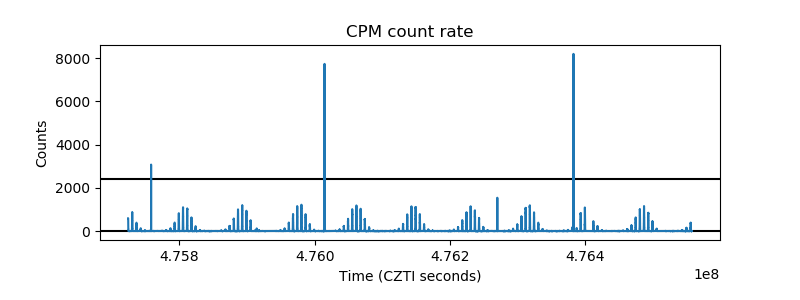 |
| CZT Counter | 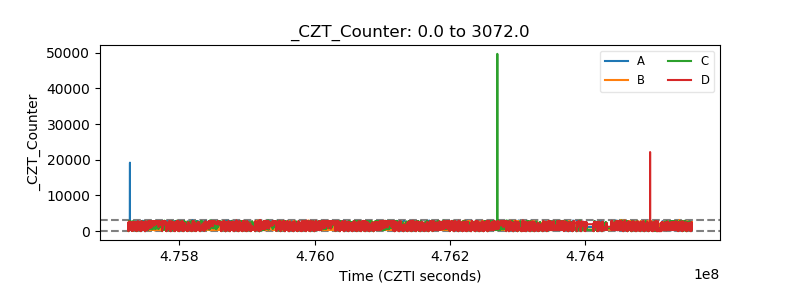 |
| +2.5 Volts monitor | 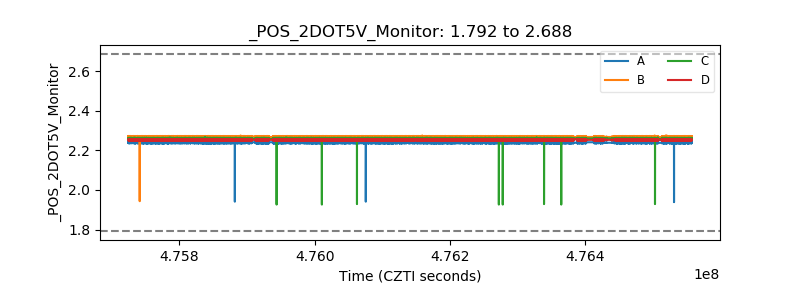 |
| +5 Volts monitor | 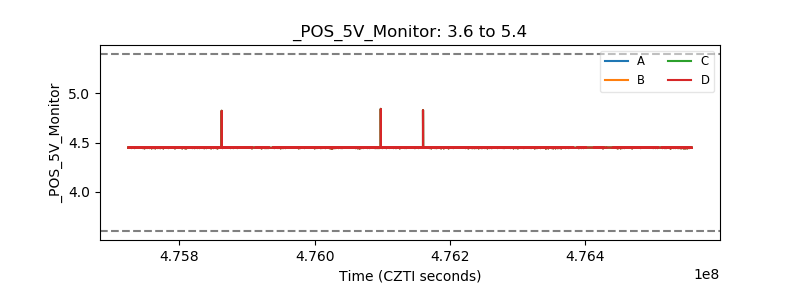 |
| _ROLL_ROT | 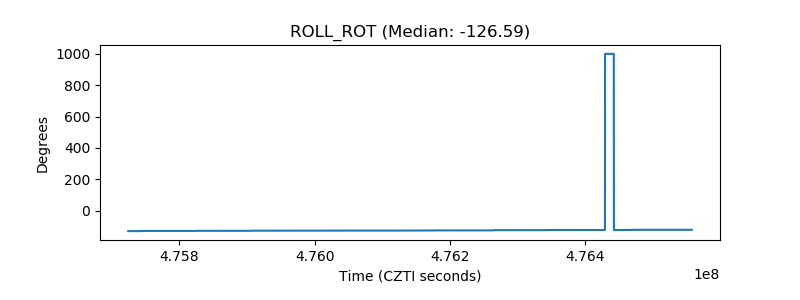 |
| _Roll_DEC | 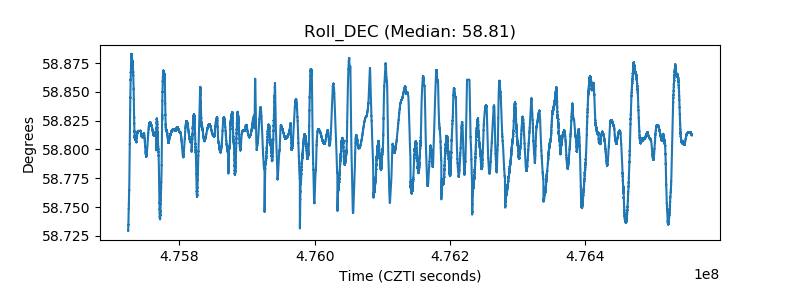 |
| _Roll_RA | 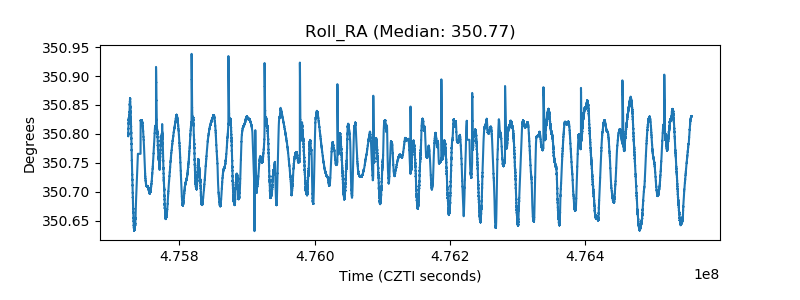 |
| Veto Counter | 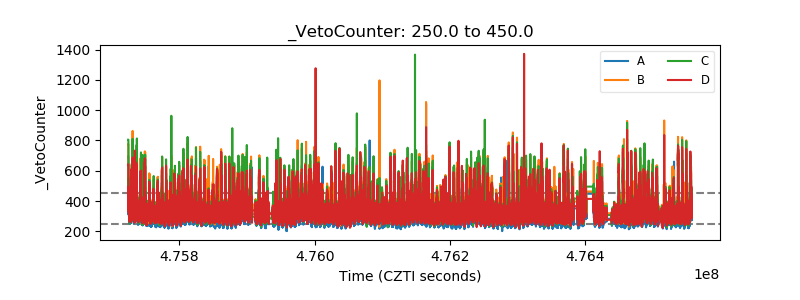 |