| Param | Original file | Final file |
|---|---|---|
| Filename | modeM0/AS1T05_239T01_9000006444_50493cztM0_level2.fits | modeM0/AS1T05_239T01_9000006444_50493cztM0_level2_quad_clean.evt |
| Size (bytes) | 589,968,000 | 94,602,240 |
| Size | 562.6 MB | 90.2 MB |
| Events in quadrant A | 4,129,987 | 635,369 |
| Events in quadrant B | 4,187,994 | 695,072 |
| Events in quadrant C | 7,471,697 | 531,635 |
| Events in quadrant D | 5,537,128 | 542,906 |
| Mode M0 | |||
|---|---|---|---|
| Quadrant | BADHDUFLAG | Total packets | Discarded packets |
| A | 0 | 16772 | 3 |
| B | 0 | 16972 | 2 |
| C | 0 | 26668 | 2 |
| D | 0 | 21172 | 2 |
| Mode M9 | |||
|---|---|---|---|
| Quadrant | BADHDUFLAG | Total packets | Discarded packets |
| A | 0 | 15 | 0 |
| B | 0 | 16 | 0 |
| C | 0 | 16 | 0 |
| D | 0 | 16 | 0 |
| Mode SS | |||
|---|---|---|---|
| Quadrant | BADHDUFLAG | Total packets | Discarded packets |
| A | 0 | 132 | 0 |
| B | 0 | 132 | 0 |
| C | 0 | 132 | 0 |
| D | 0 | 132 | 0 |
| Quadrant | Total seconds | Saturated seconds | Saturation percentage |
|---|---|---|---|
| A | 6596 | 330 | 5.003032% |
| B | 6596 | 365 | 5.533657% |
| C | 6596 | 1357 | 20.573075% |
| D | 6596 | 689 | 10.445725% |
Noise dominated data is calculated using 1-second bins in cleaned event files. If a bin has >2000 counts, and if more than 50% of those come from <1% of pixels, then it is considered to be noise-dominated and hence unusable.
| Quadrant | # 1 sec bins | Bins with >0 counts | Bins with >2000 counts | High rate bins dominated by noise | Noise dominated (total time) | Noise dominated (detector-on time) | Marked lightcurve |
|---|---|---|---|---|---|---|---|
| A | 7761 | 6597 | 211 | 211 | 2.72% | 3.20% | 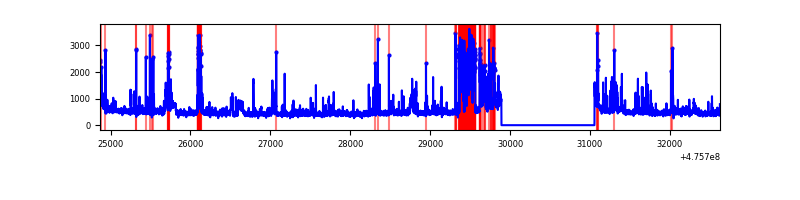 |
| B | 7761 | 6597 | 203 | 203 | 2.62% | 3.08% | 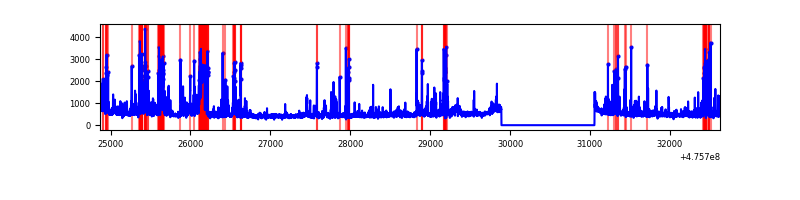 |
| C | 7761 | 6597 | 1206 | 1206 | 15.54% | 18.28% | 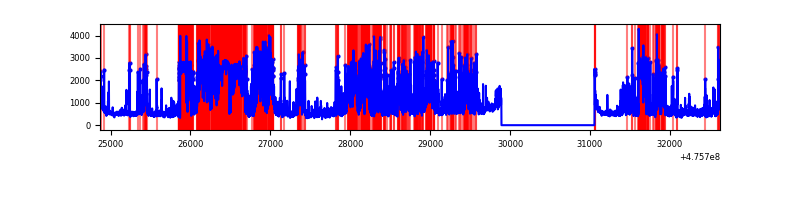 |
| D | 7761 | 6597 | 620 | 620 | 7.99% | 9.40% | 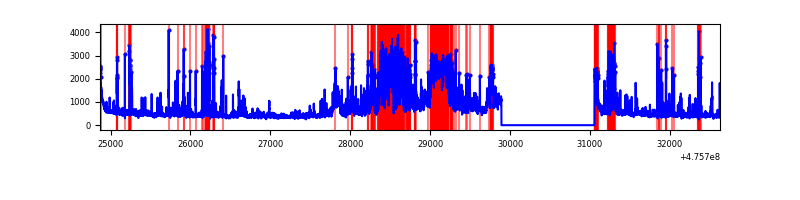 |
Top three noisy pixels from each quadrant. If the there are fewer than three noisy pixels in the level2.evt file, extra rows are filled as -1
| Pixel properties | Quadrant properties | ||||||
|---|---|---|---|---|---|---|---|
| Quadrant | DetID | PixID | Counts | Sigma | Mean | Median | Sigma |
| A | 10 | 253 | 672231 | 3795.66 | 722 | 706 | 176.9 |
| A | 8 | 38 | 107417 | 603.16 | 722 | 706 | 176.9 |
| A | 4 | 249 | 106224 | 596.42 | 722 | 706 | 176.9 |
| B | 7 | 0 | 517461 | 3403.34 | 721 | 694 | 151.8 |
| B | 4 | 206 | 343201 | 2255.69 | 721 | 694 | 151.8 |
| B | 10 | 247 | 89099 | 582.22 | 721 | 694 | 151.8 |
| C | 15 | 196 | 1688323 | 9380.12 | 653 | 648 | 179.9 |
| C | 15 | 235 | 1267699 | 7042.28 | 653 | 648 | 179.9 |
| C | 15 | 162 | 461076 | 2559.06 | 653 | 648 | 179.9 |
| D | 7 | 61 | 929599 | 4911.22 | 674 | 651 | 189.1 |
| D | 11 | 161 | 756633 | 3996.77 | 674 | 651 | 189.1 |
| D | 8 | 246 | 334758 | 1766.37 | 674 | 651 | 189.1 |
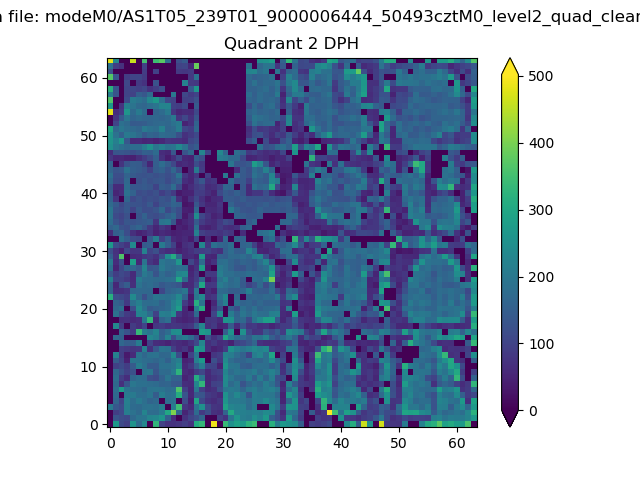
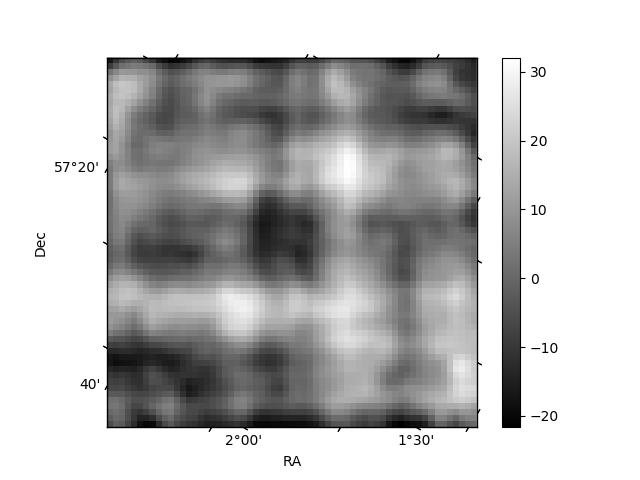
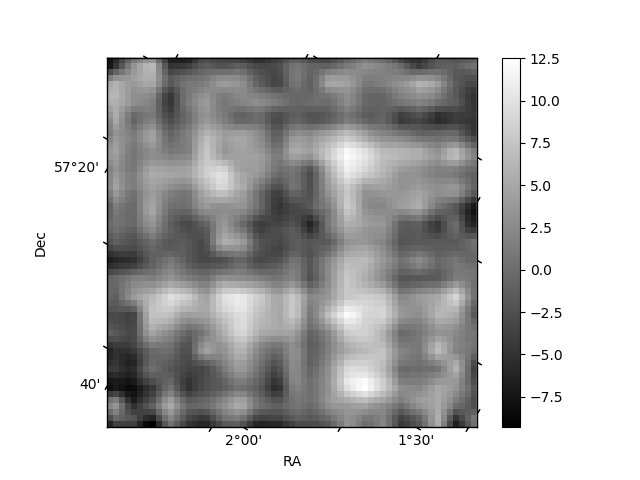
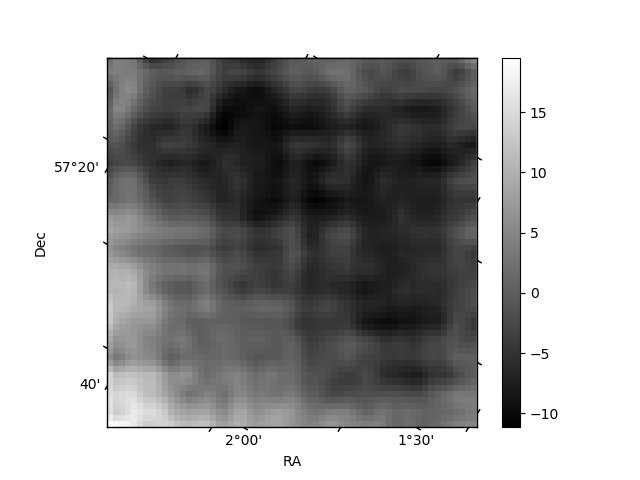
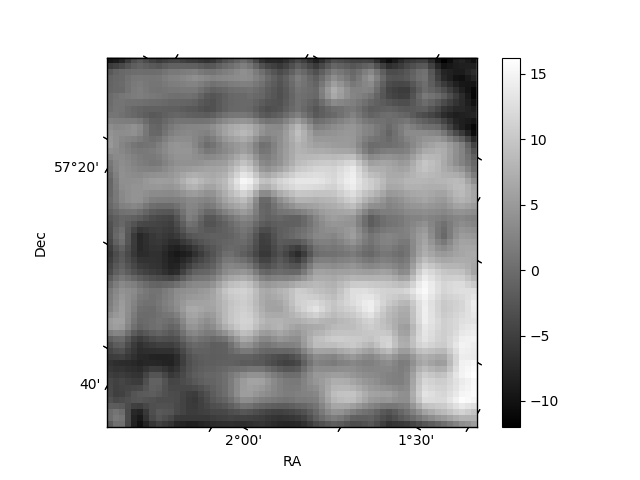
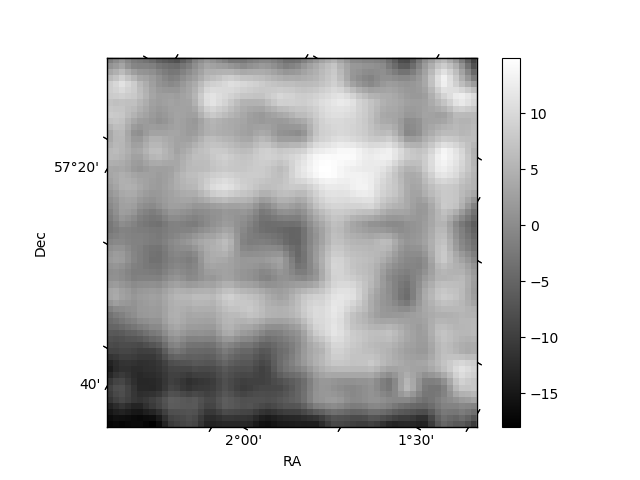
Histogram calculated using DETX and DETY for each event in the final _common_clean file
| Quadrant A | 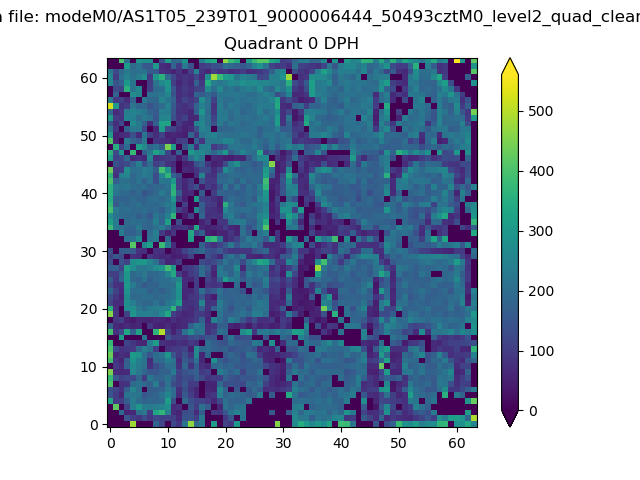 |
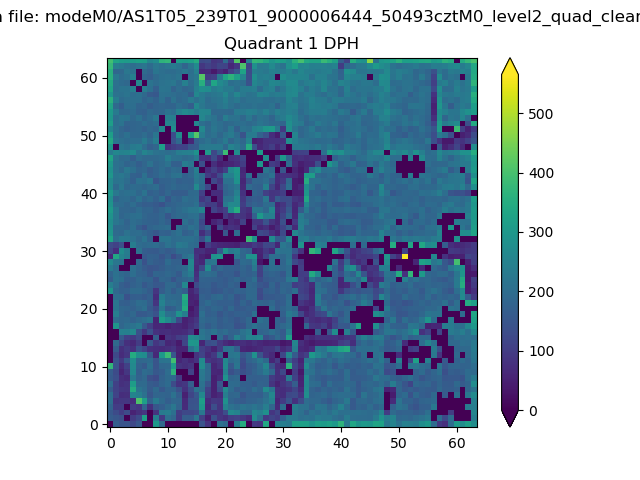 |
Quadrant B |
|---|---|---|---|
| Quadrant D | 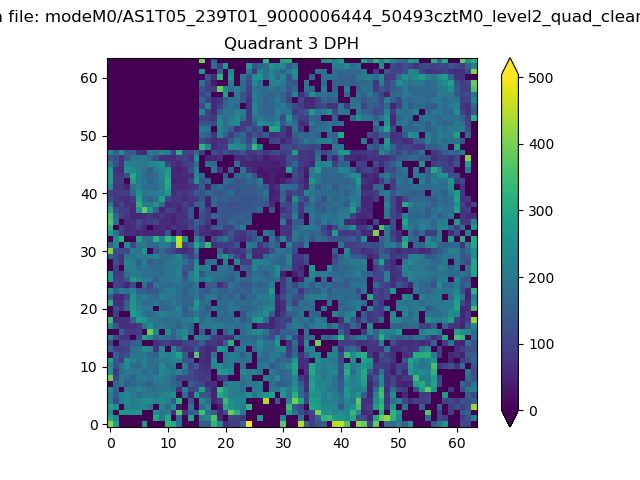 |
 |
Quadrant C |
| Plot type | Count rate plots | Images |
|---|---|---|
| Comparison with Poisson distribution Blue bars denote a histogram of data divided into 1 sec bins. Red curve is a Poisson curve with rate = median count rate of data. |
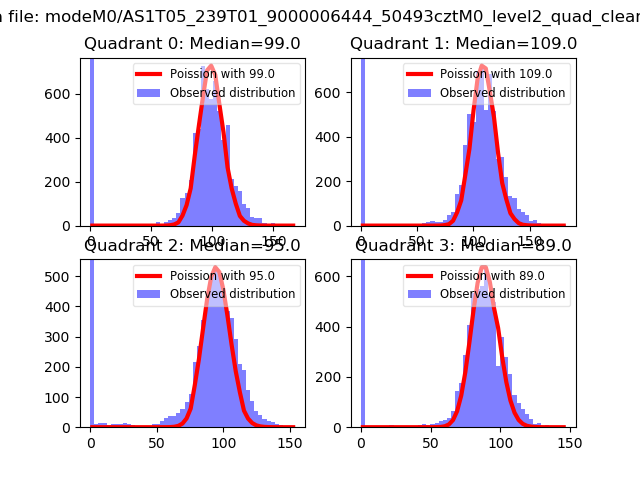 |
 |
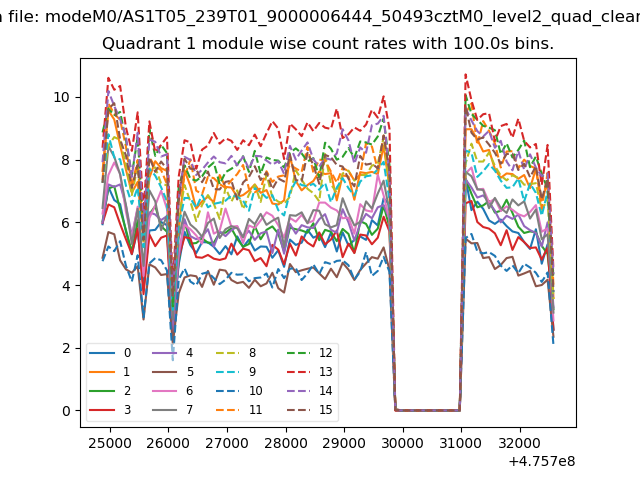
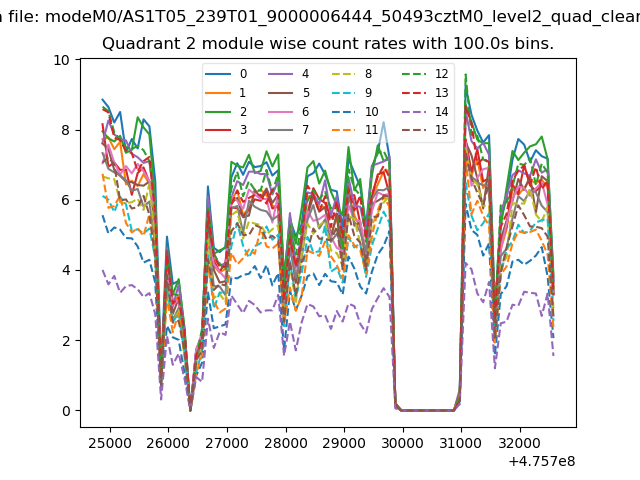
| Quadrant-wise count rates Data is divided into 100 sec bins |
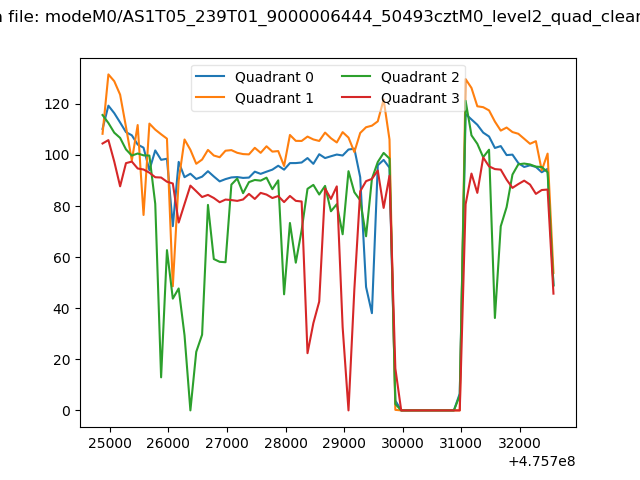 |
|
| Module-wise count rates for Quadrant A Data is divided into 100 sec bins |
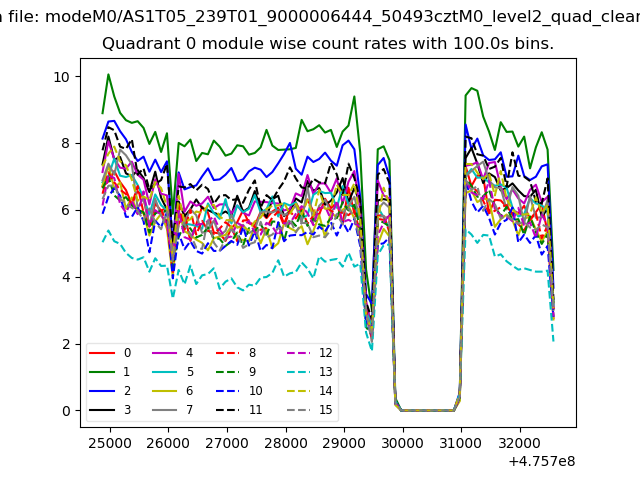 |
 |
| Module-wise count rates for Quadrant B Data is divided into 100 sec bins |
 |
 |
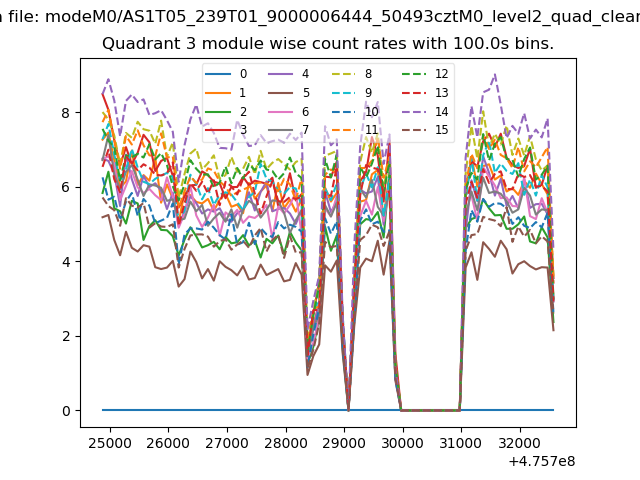
| Module-wise count rates for Quadrant C Data is divided into 100 sec bins |
 |
 |
| Module-wise count rates for Quadrant D Data is divided into 100 sec bins |
 |
 |
| Parameter | Plot |
|---|---|
| CZT HV Monitor | 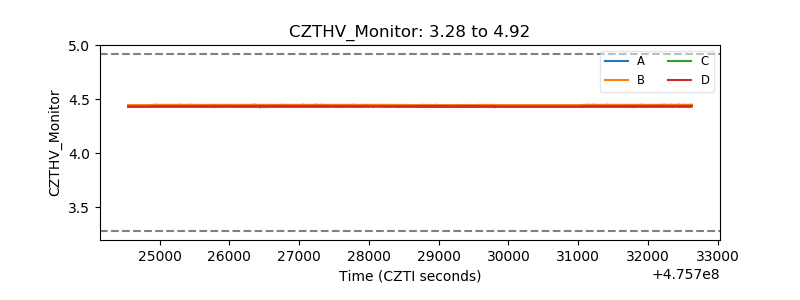 |
| D_VDD | 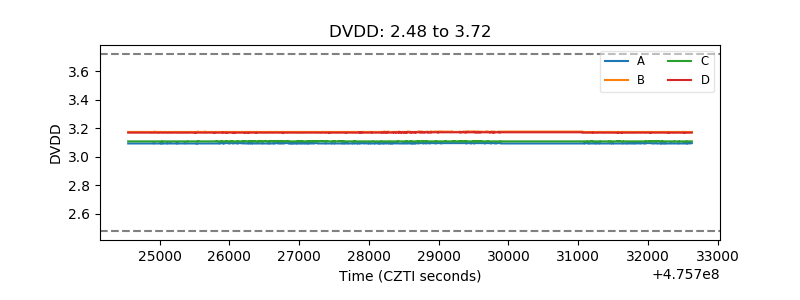 |
| Temperature 1 | 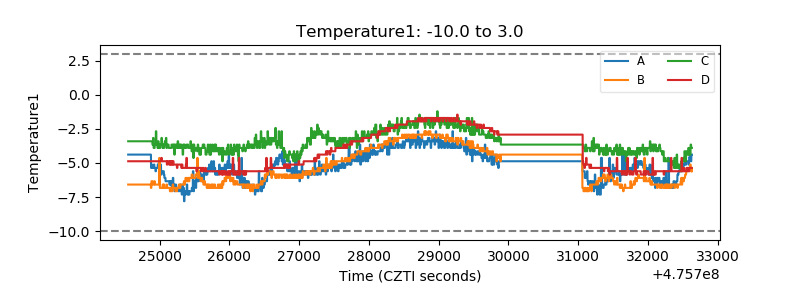 |
| Veto HV Monitor | 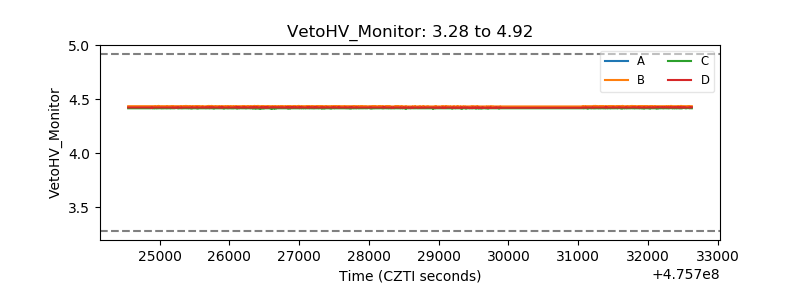 |
| Veto LLD | 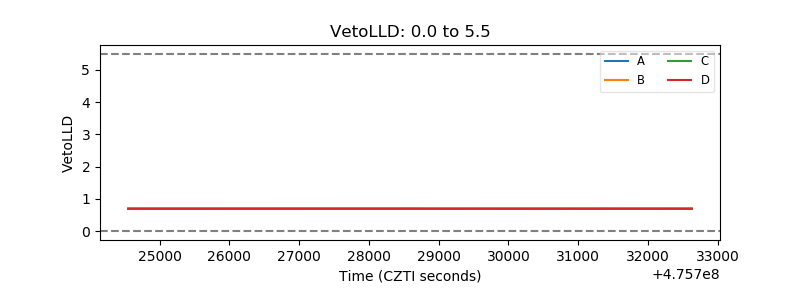 |
| Alpha Counter | 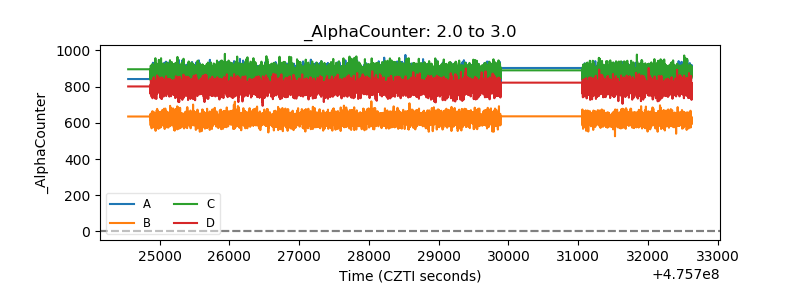 |
| _CPM_Rate | 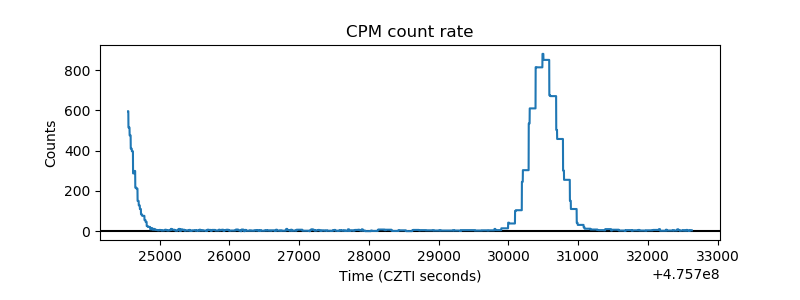 |
| CZT Counter | 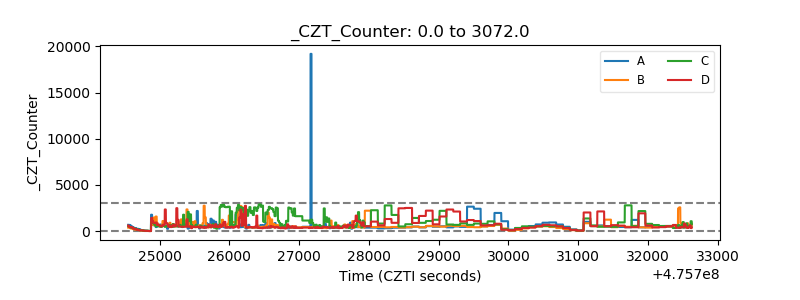 |
| +2.5 Volts monitor | 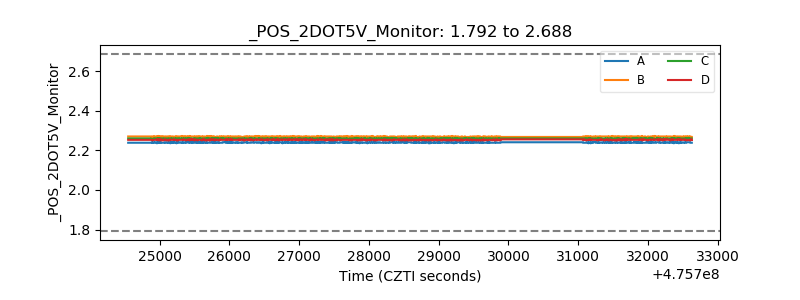 |
| +5 Volts monitor |  |
| _ROLL_ROT | 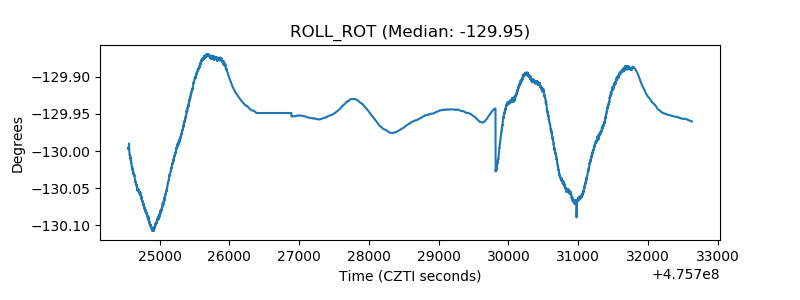 |
| _Roll_DEC | 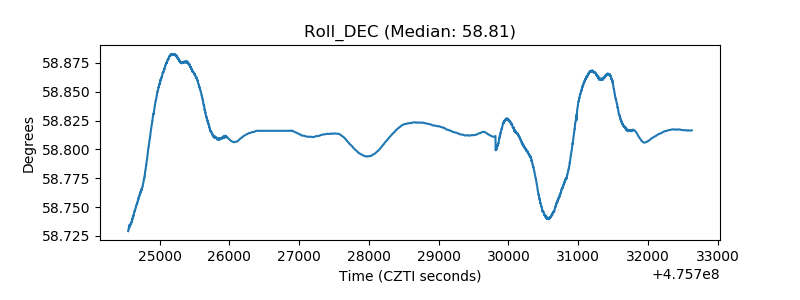 |
| _Roll_RA | 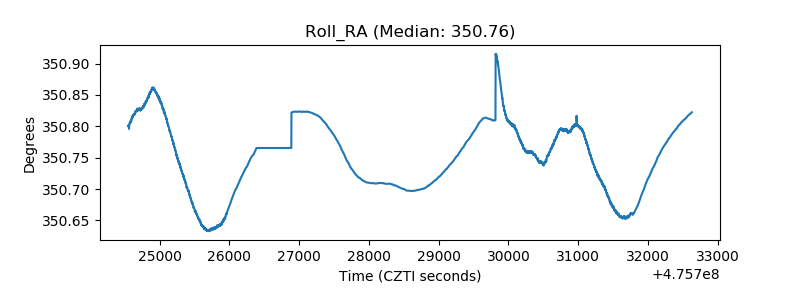 |
| Veto Counter | 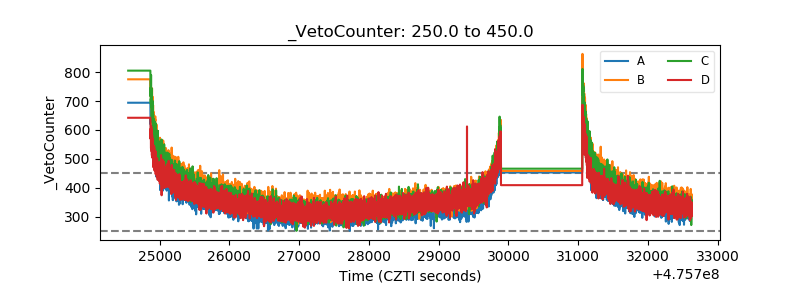 |