| Param | Original file | Final file |
|---|---|---|
| Filename | modeM0/AS1T05_239T01_9000006444_50494cztM0_level2.fits | modeM0/AS1T05_239T01_9000006444_50494cztM0_level2_quad_clean.evt |
| Size (bytes) | 519,183,360 | 82,261,440 |
| Size | 495.1 MB | 78.5 MB |
| Events in quadrant A | 3,774,717 | 539,315 |
| Events in quadrant B | 3,453,565 | 607,725 |
| Events in quadrant C | 5,947,119 | 485,294 |
| Events in quadrant D | 5,586,843 | 447,802 |
| Mode M0 | |||
|---|---|---|---|
| Quadrant | BADHDUFLAG | Total packets | Discarded packets |
| A | 0 | 15224 | 1 |
| B | 0 | 14291 | 1 |
| C | 0 | 21624 | 1 |
| D | 0 | 20787 | 3 |
| Mode M9 | |||
|---|---|---|---|
| Quadrant | BADHDUFLAG | Total packets | Discarded packets |
| A | 0 | 11 | 0 |
| B | 0 | 11 | 0 |
| C | 0 | 11 | 0 |
| D | 0 | 11 | 0 |
| Mode SS | |||
|---|---|---|---|
| Quadrant | BADHDUFLAG | Total packets | Discarded packets |
| A | 0 | 120 | 0 |
| B | 0 | 120 | 0 |
| C | 0 | 120 | 0 |
| D | 0 | 120 | 0 |
| Quadrant | Total seconds | Saturated seconds | Saturation percentage |
|---|---|---|---|
| A | 5874 | 380 | 6.469186% |
| B | 5875 | 256 | 4.357447% |
| C | 5875 | 884 | 15.046809% |
| D | 5874 | 883 | 15.032346% |
Noise dominated data is calculated using 1-second bins in cleaned event files. If a bin has >2000 counts, and if more than 50% of those come from <1% of pixels, then it is considered to be noise-dominated and hence unusable.
| Quadrant | # 1 sec bins | Bins with >0 counts | Bins with >2000 counts | High rate bins dominated by noise | Noise dominated (total time) | Noise dominated (detector-on time) | Marked lightcurve |
|---|---|---|---|---|---|---|---|
| A | 6939 | 5874 | 152 | 152 | 2.19% | 2.59% | 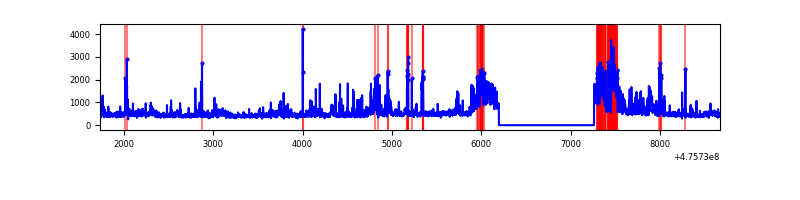 |
| B | 6940 | 5875 | 87 | 87 | 1.25% | 1.48% | 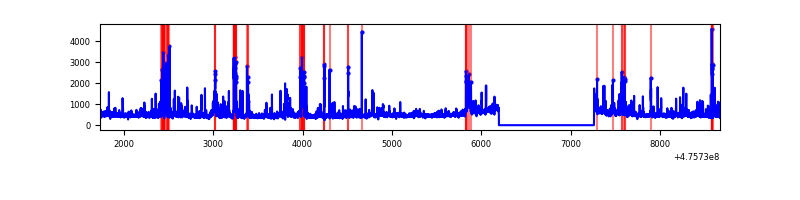 |
| C | 6940 | 5875 | 712 | 712 | 10.26% | 12.12% | 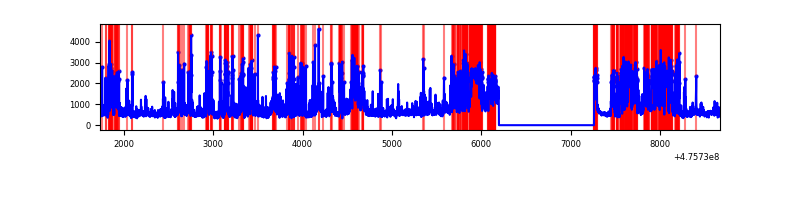 |
| D | 6938 | 5873 | 816 | 816 | 11.76% | 13.89% | 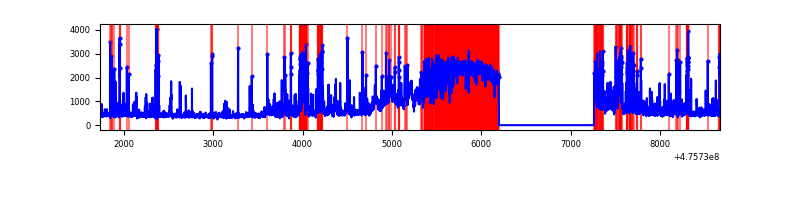 |
Top three noisy pixels from each quadrant. If the there are fewer than three noisy pixels in the level2.evt file, extra rows are filled as -1
| Pixel properties | Quadrant properties | ||||||
|---|---|---|---|---|---|---|---|
| Quadrant | DetID | PixID | Counts | Sigma | Mean | Median | Sigma |
| A | 10 | 253 | 886592 | 5712.07 | 633 | 618 | 155.1 |
| A | 3 | 63 | 67513 | 431.28 | 633 | 618 | 155.1 |
| A | 4 | 249 | 65143 | 416.0 | 633 | 618 | 155.1 |
| B | 4 | 206 | 309186 | 2274.5 | 636 | 613 | 135.7 |
| B | 7 | 0 | 257663 | 1894.73 | 636 | 613 | 135.7 |
| B | 10 | 247 | 94167 | 689.59 | 636 | 613 | 135.7 |
| C | 15 | 235 | 1126427 | 7021.33 | 579 | 574 | 160.3 |
| C | 15 | 195 | 621054 | 3869.59 | 579 | 574 | 160.3 |
| C | 0 | 177 | 327593 | 2039.44 | 579 | 574 | 160.3 |
| D | 7 | 61 | 1903388 | 12149.58 | 561 | 541 | 156.6 |
| D | 6 | 42 | 286105 | 1823.31 | 561 | 541 | 156.6 |
| D | 11 | 161 | 218270 | 1390.19 | 561 | 541 | 156.6 |
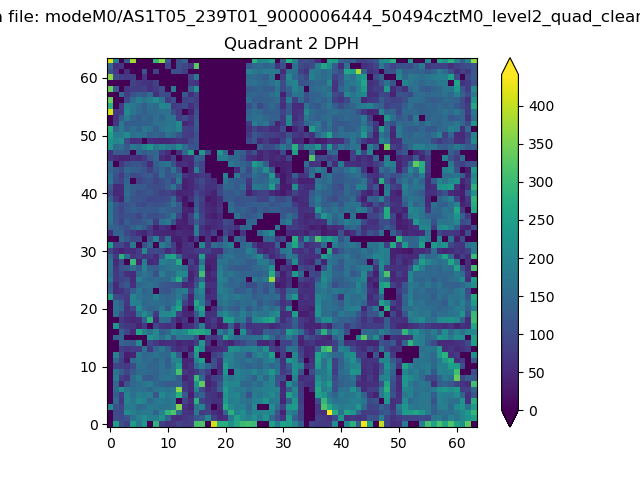
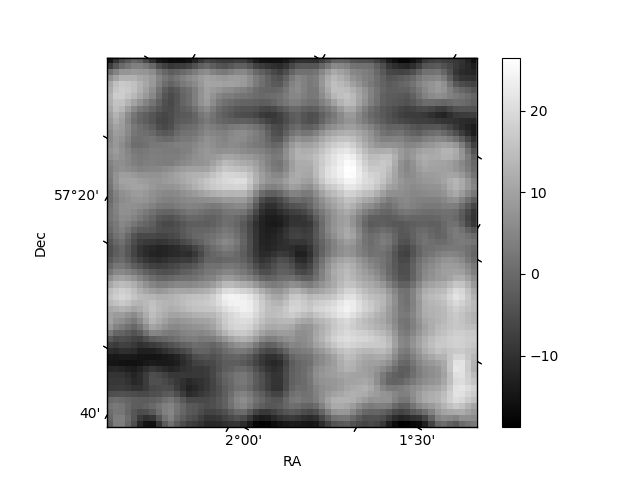
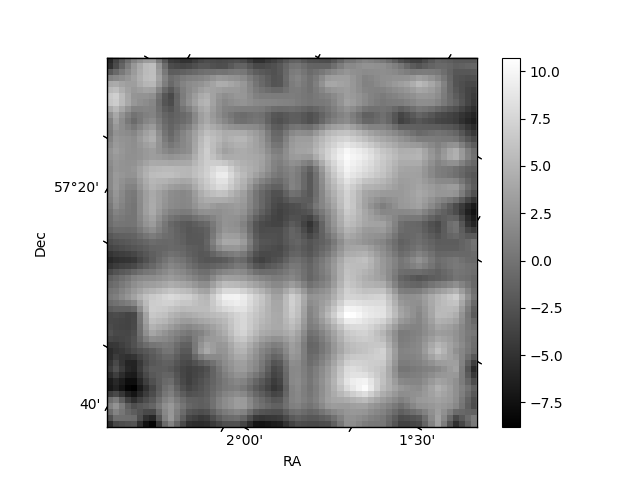
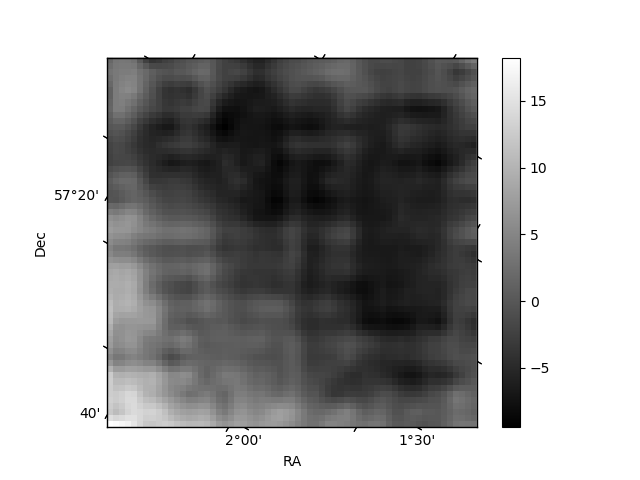
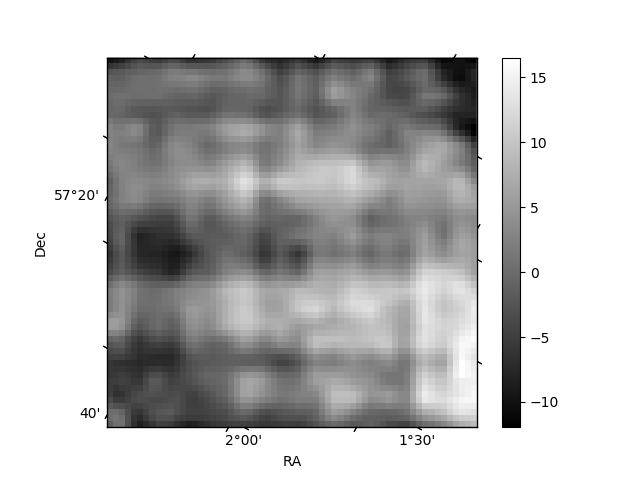
Histogram calculated using DETX and DETY for each event in the final _common_clean file
| Quadrant A | 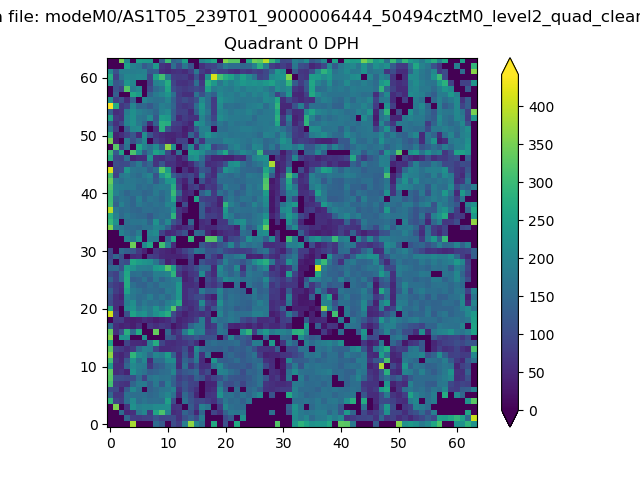 |
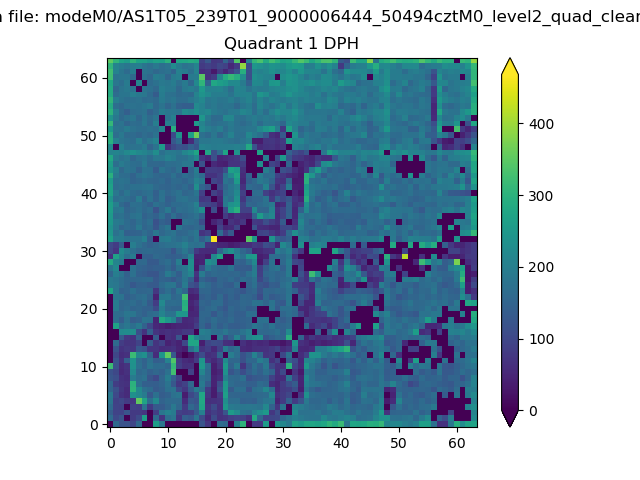 |
Quadrant B |
|---|---|---|---|
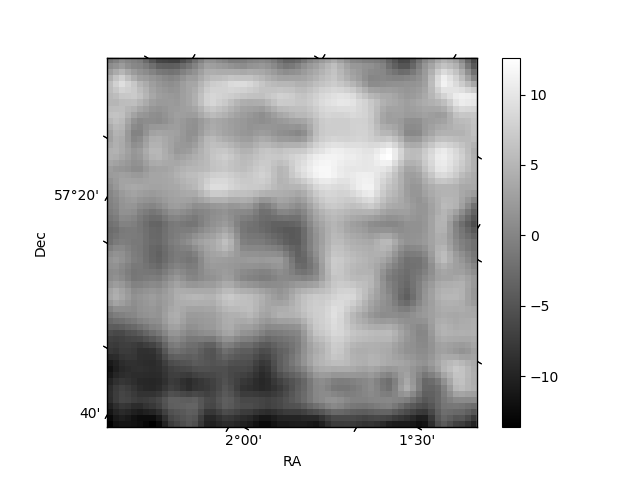
| Quadrant D | 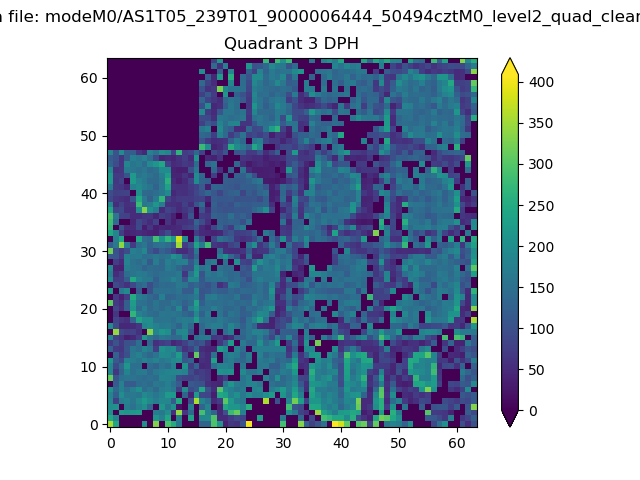 |
 |
Quadrant C |
| Plot type | Count rate plots | Images |
|---|---|---|
| Comparison with Poisson distribution Blue bars denote a histogram of data divided into 1 sec bins. Red curve is a Poisson curve with rate = median count rate of data. |
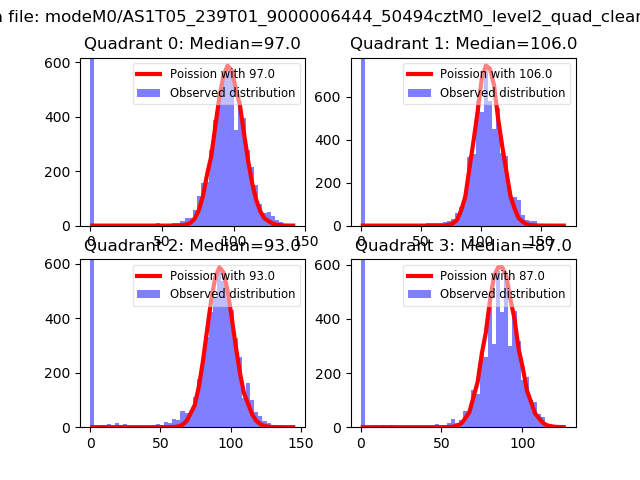 |
 |
| Quadrant-wise count rates Data is divided into 100 sec bins |
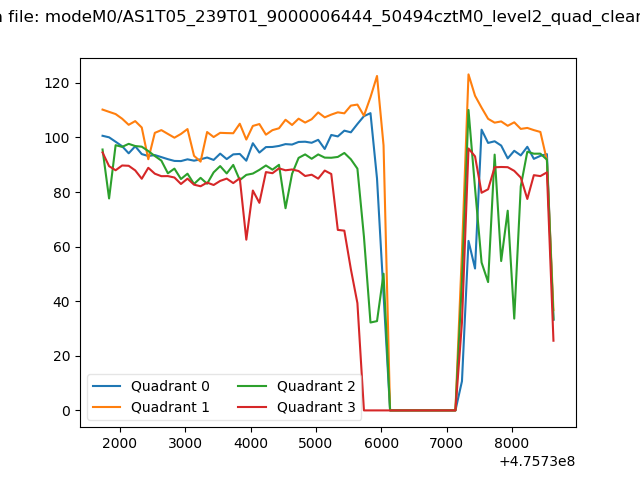 |
|
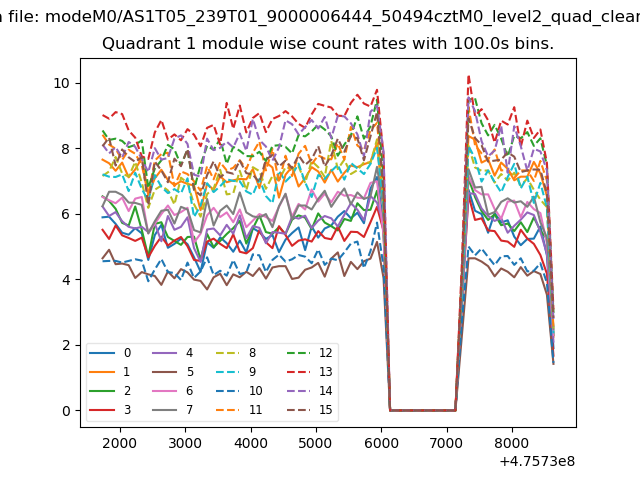
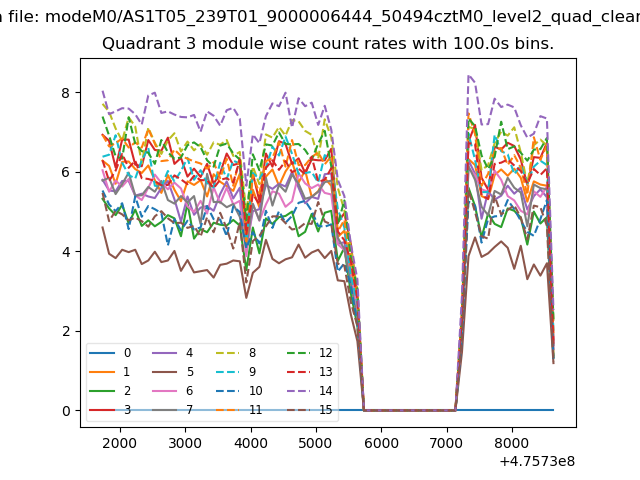
| Module-wise count rates for Quadrant A Data is divided into 100 sec bins |
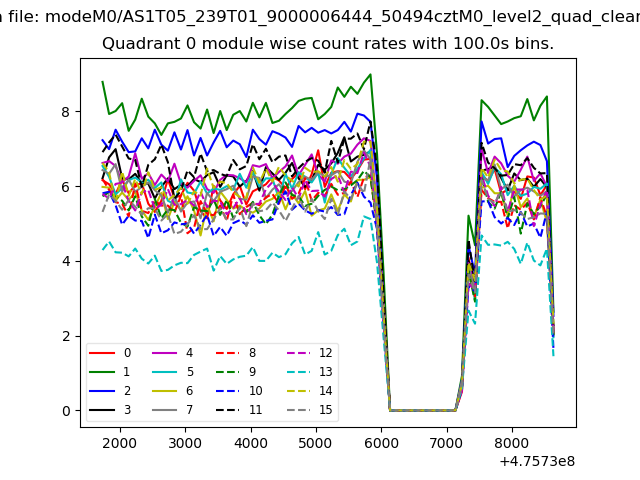 |
 |
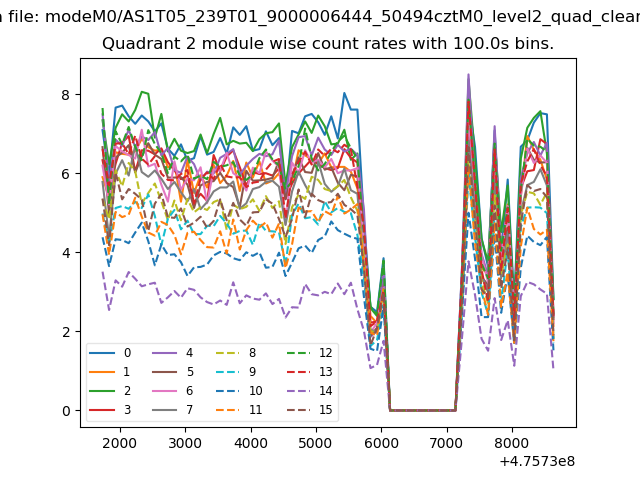
| Module-wise count rates for Quadrant B Data is divided into 100 sec bins |
 |
 |
| Module-wise count rates for Quadrant C Data is divided into 100 sec bins |
 |
 |
| Module-wise count rates for Quadrant D Data is divided into 100 sec bins |
 |
 |
| Parameter | Plot |
|---|---|
| CZT HV Monitor | 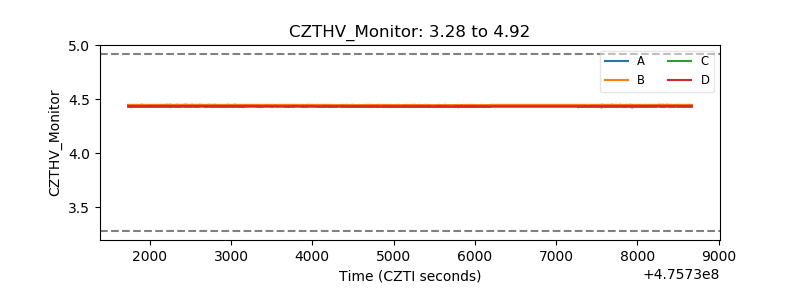 |
| D_VDD | 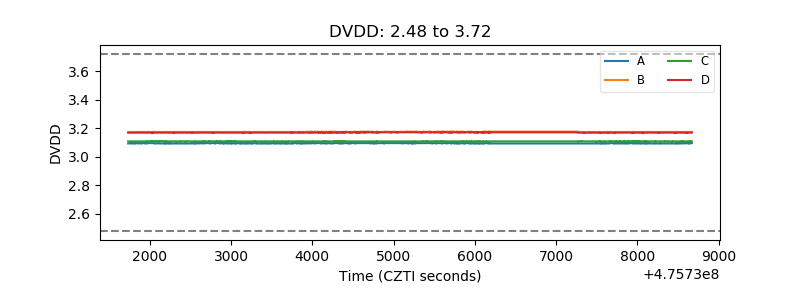 |
| Temperature 1 | 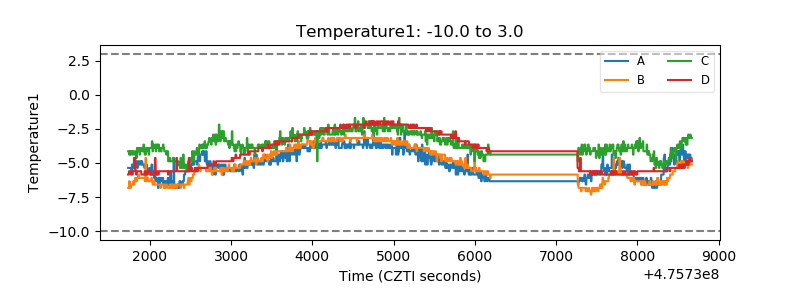 |
| Veto HV Monitor | 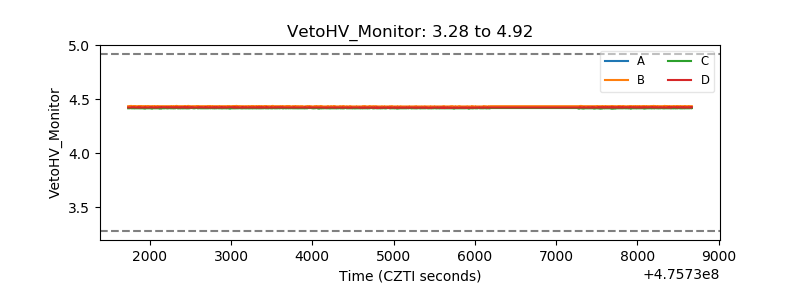 |
| Veto LLD | 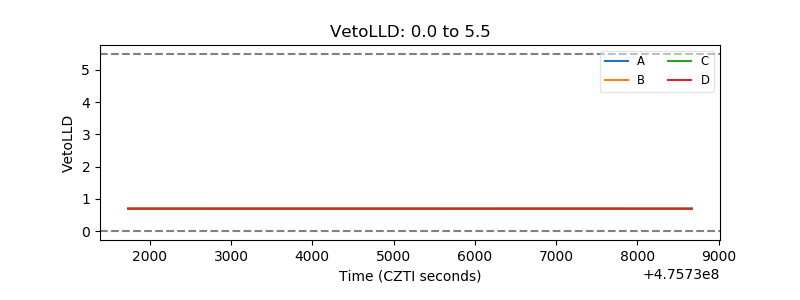 |
| Alpha Counter | 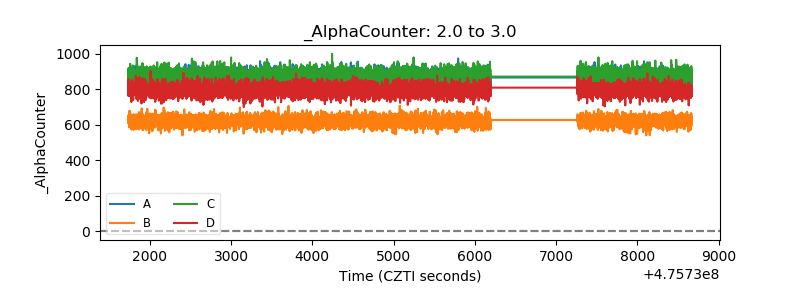 |
| _CPM_Rate | 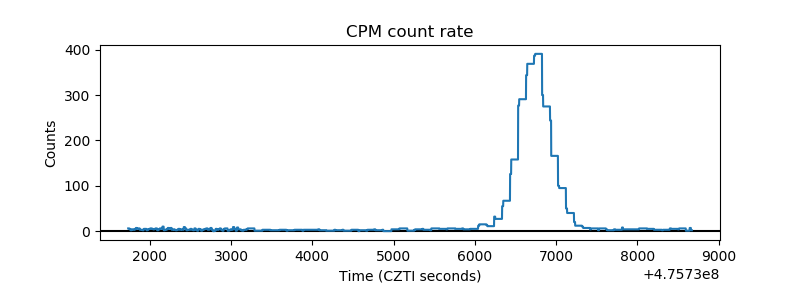 |
| CZT Counter | 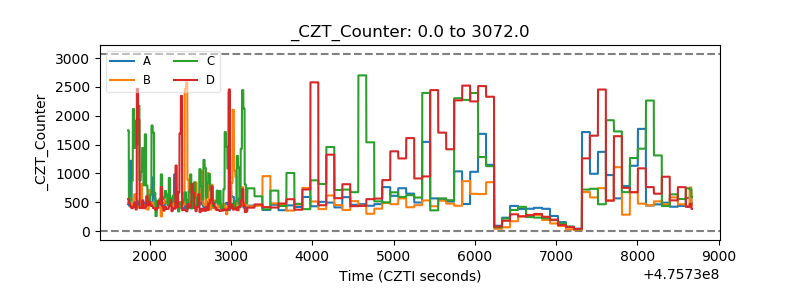 |
| +2.5 Volts monitor |  |
| +5 Volts monitor |  |
| _ROLL_ROT | 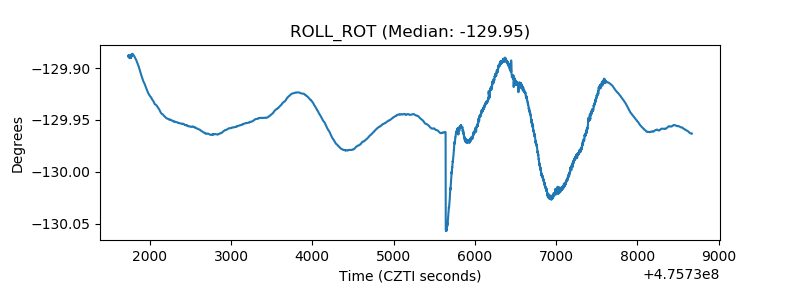 |
| _Roll_DEC | 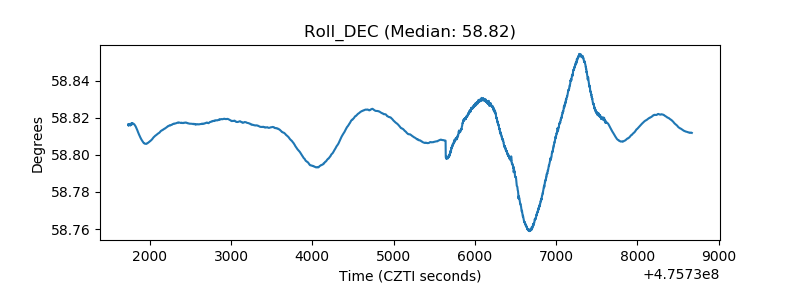 |
| _Roll_RA | 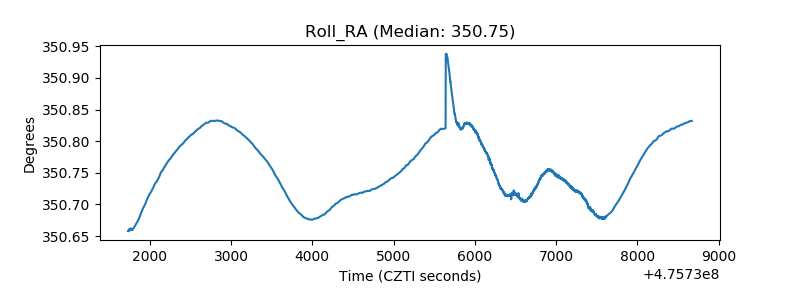 |
| Veto Counter | 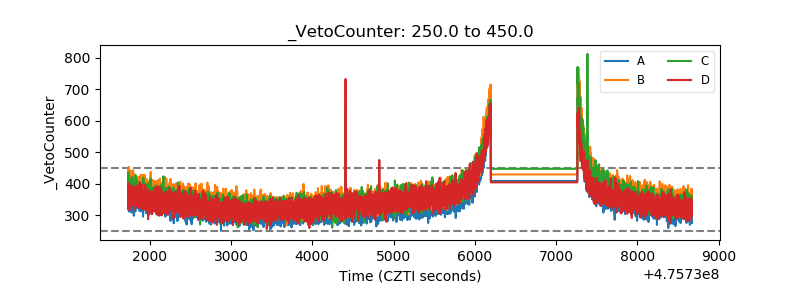 |