| Param | Original file | Final file |
|---|---|---|
| Filename | modeM0/AS1T05_239T01_9000006444_50495cztM0_level2.fits | modeM0/AS1T05_239T01_9000006444_50495cztM0_level2_quad_clean.evt |
| Size (bytes) | 641,263,680 | 88,678,080 |
| Size | 611.6 MB | 84.6 MB |
| Events in quadrant A | 4,421,524 | 599,776 |
| Events in quadrant B | 4,375,081 | 644,561 |
| Events in quadrant C | 5,737,299 | 555,058 |
| Events in quadrant D | 8,695,602 | 428,441 |
| Mode M0 | |||
|---|---|---|---|
| Quadrant | BADHDUFLAG | Total packets | Discarded packets |
| A | 0 | 17600 | 1 |
| B | 0 | 17660 | 1 |
| C | 0 | 21621 | 1 |
| D | 0 | 30366 | 2 |
| Mode M9 | |||
|---|---|---|---|
| Quadrant | BADHDUFLAG | Total packets | Discarded packets |
| A | 0 | 9 | 0 |
| B | 0 | 9 | 0 |
| C | 0 | 9 | 0 |
| D | 0 | 9 | 0 |
| Mode SS | |||
|---|---|---|---|
| Quadrant | BADHDUFLAG | Total packets | Discarded packets |
| A | 0 | 134 | 0 |
| B | 0 | 134 | 0 |
| C | 0 | 134 | 0 |
| D | 0 | 134 | 0 |
| Quadrant | Total seconds | Saturated seconds | Saturation percentage |
|---|---|---|---|
| A | 6552 | 353 | 5.387668% |
| B | 6553 | 486 | 7.416450% |
| C | 6553 | 629 | 9.598657% |
| D | 6552 | 1771 | 27.029915% |
Noise dominated data is calculated using 1-second bins in cleaned event files. If a bin has >2000 counts, and if more than 50% of those come from <1% of pixels, then it is considered to be noise-dominated and hence unusable.
| Quadrant | # 1 sec bins | Bins with >0 counts | Bins with >2000 counts | High rate bins dominated by noise | Noise dominated (total time) | Noise dominated (detector-on time) | Marked lightcurve |
|---|---|---|---|---|---|---|---|
| A | 7457 | 6552 | 229 | 229 | 3.07% | 3.50% | 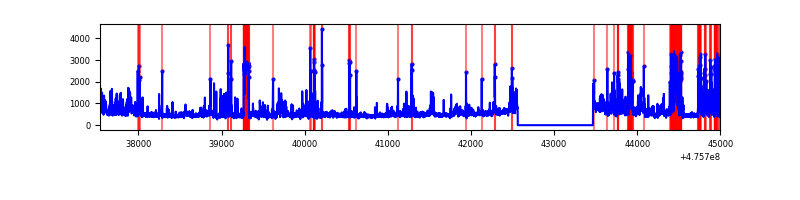 |
| B | 7458 | 6553 | 252 | 252 | 3.38% | 3.85% | 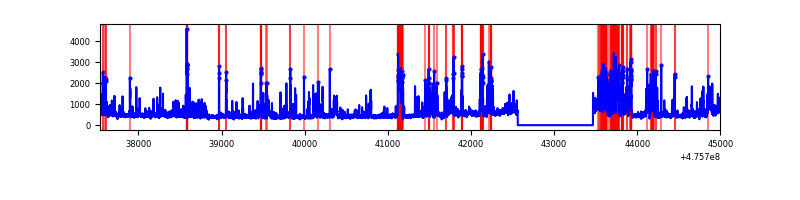 |
| C | 7458 | 6554 | 464 | 464 | 6.22% | 7.08% | 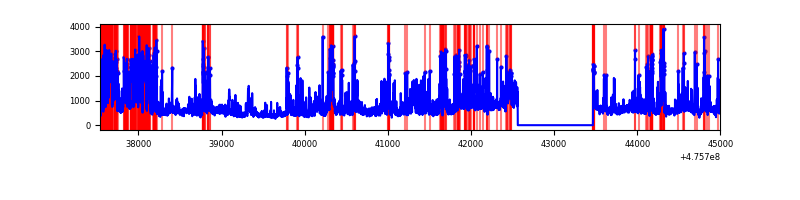 |
| D | 7457 | 6552 | 1770 | 1770 | 23.74% | 27.01% | 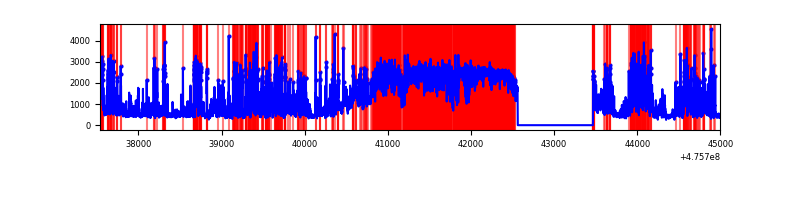 |
Top three noisy pixels from each quadrant. If the there are fewer than three noisy pixels in the level2.evt file, extra rows are filled as -1
| Pixel properties | Quadrant properties | ||||||
|---|---|---|---|---|---|---|---|
| Quadrant | DetID | PixID | Counts | Sigma | Mean | Median | Sigma |
| A | 10 | 253 | 1012145 | 5995.95 | 693 | 677 | 168.7 |
| A | 3 | 130 | 140114 | 826.58 | 693 | 677 | 168.7 |
| A | 4 | 249 | 104904 | 617.85 | 693 | 677 | 168.7 |
| B | 7 | 0 | 824273 | 5648.59 | 685 | 661 | 145.8 |
| B | 4 | 206 | 312676 | 2139.89 | 685 | 661 | 145.8 |
| B | 0 | 246 | 169056 | 1154.9 | 685 | 661 | 145.8 |
| C | 15 | 235 | 1032637 | 5609.52 | 660 | 654 | 184.0 |
| C | 15 | 195 | 234269 | 1269.85 | 660 | 654 | 184.0 |
| C | 12 | 247 | 228012 | 1235.84 | 660 | 654 | 184.0 |
| D | 7 | 61 | 2837524 | 17290.21 | 596 | 575 | 164.1 |
| D | 11 | 161 | 1678878 | 10228.67 | 596 | 575 | 164.1 |
| D | 6 | 42 | 310927 | 1891.49 | 596 | 575 | 164.1 |
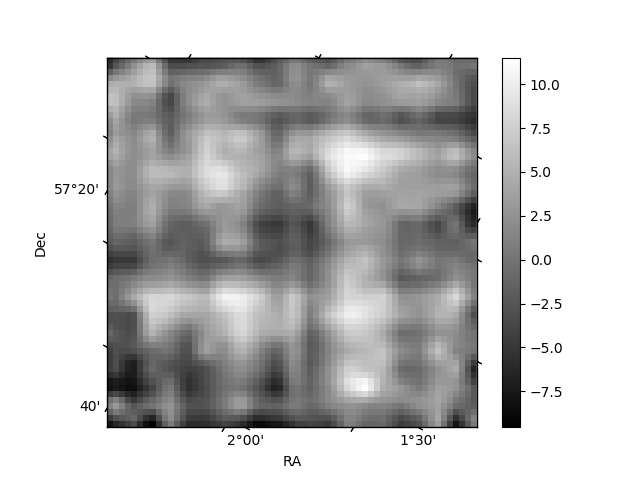
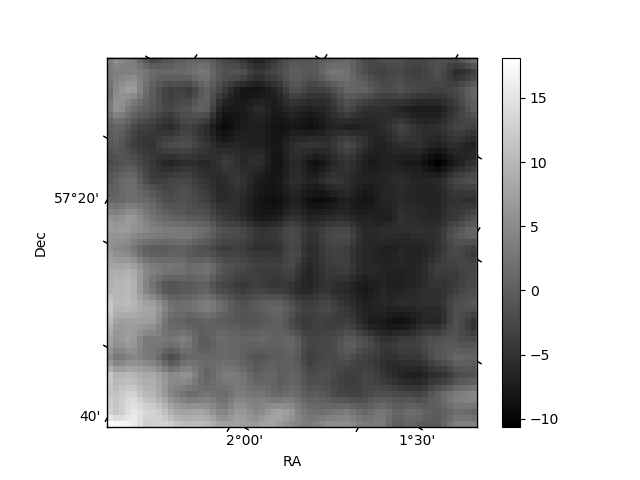
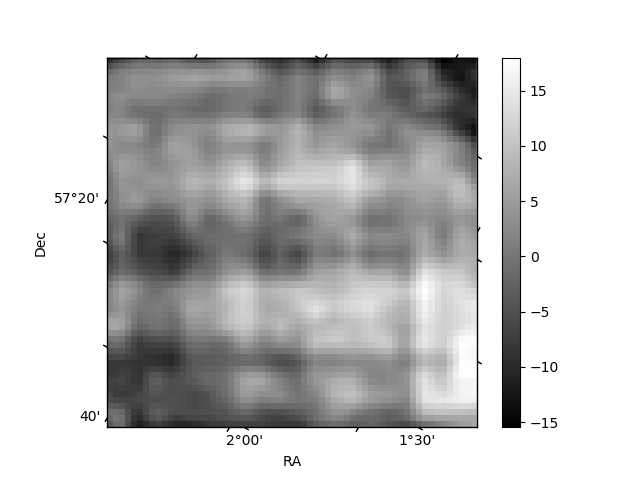
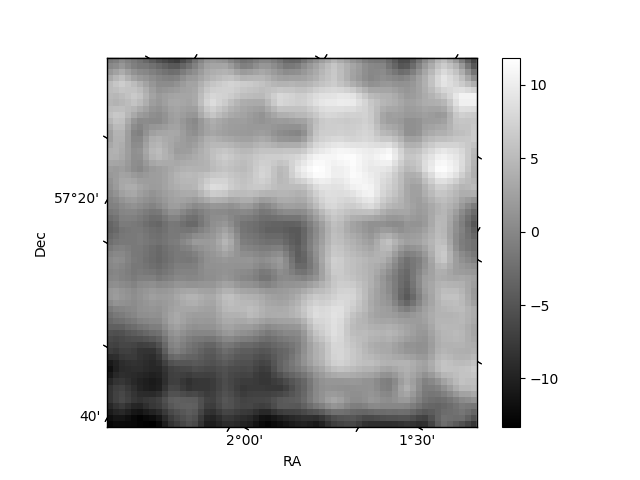
Histogram calculated using DETX and DETY for each event in the final _common_clean file
| Quadrant A | 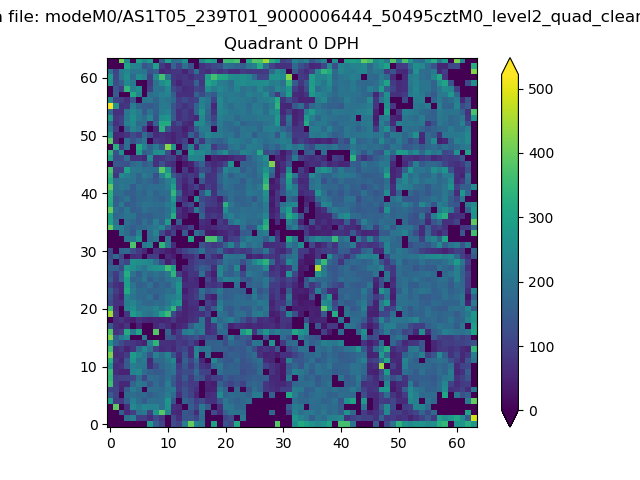 |
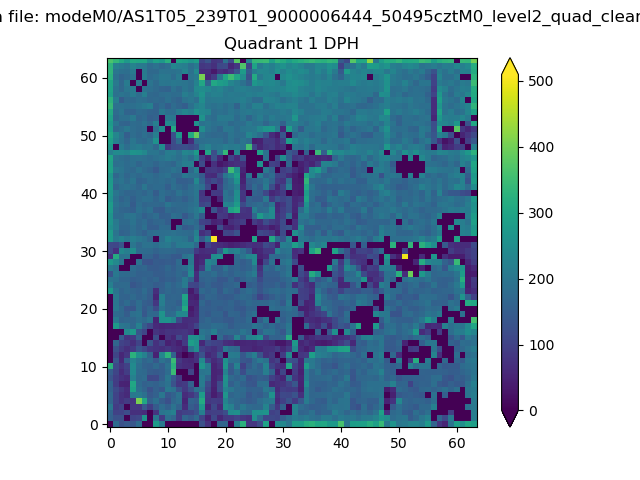 |
Quadrant B |
|---|---|---|---|
| Quadrant D | 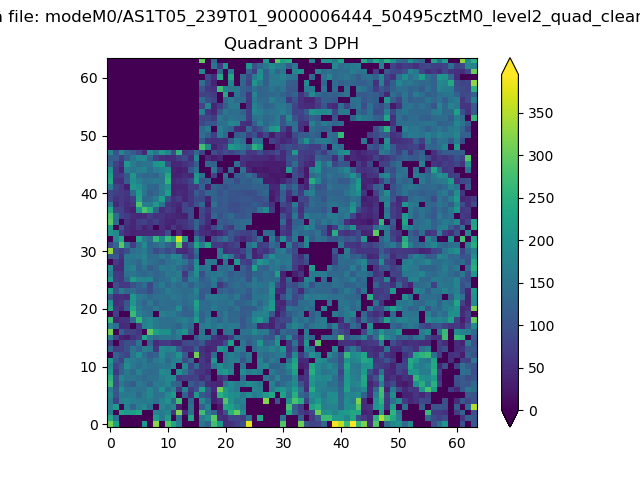 |
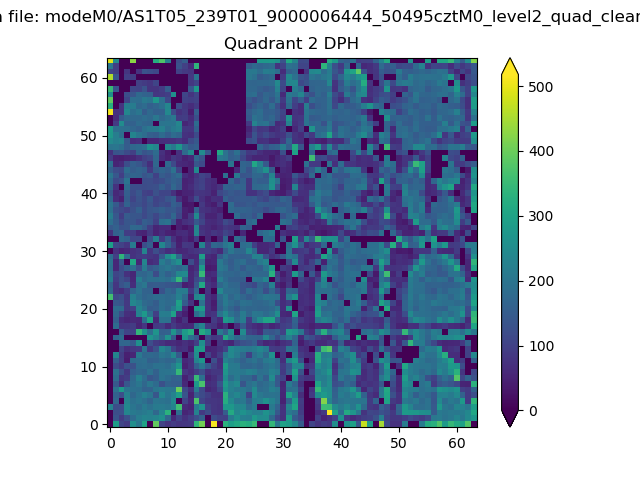 |
Quadrant C |
| Plot type | Count rate plots | Images |
|---|---|---|
| Comparison with Poisson distribution Blue bars denote a histogram of data divided into 1 sec bins. Red curve is a Poisson curve with rate = median count rate of data. |
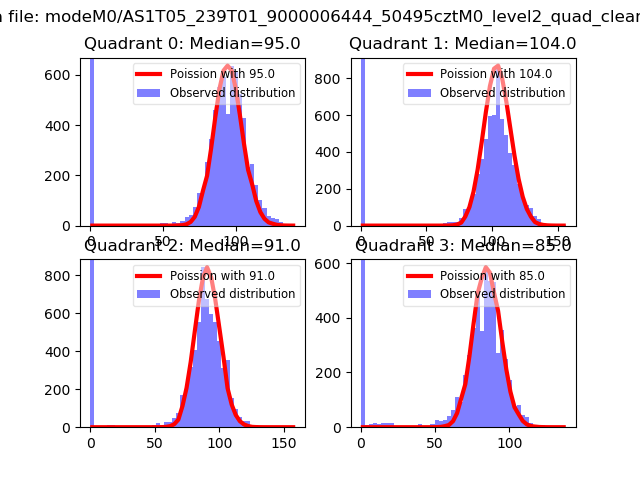 |
 |
| Quadrant-wise count rates Data is divided into 100 sec bins |
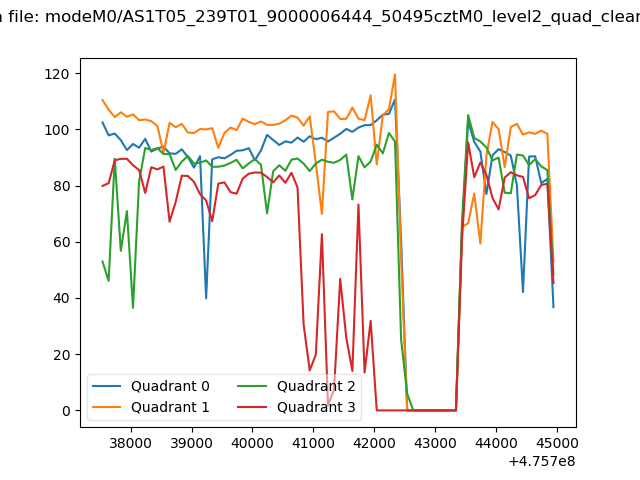 |
|
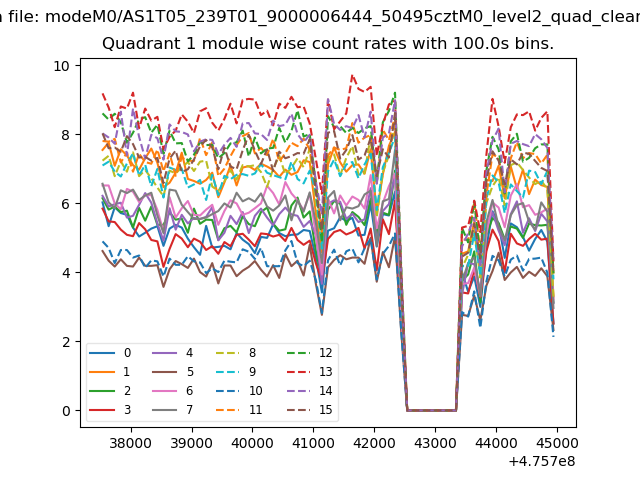
| Module-wise count rates for Quadrant A Data is divided into 100 sec bins |
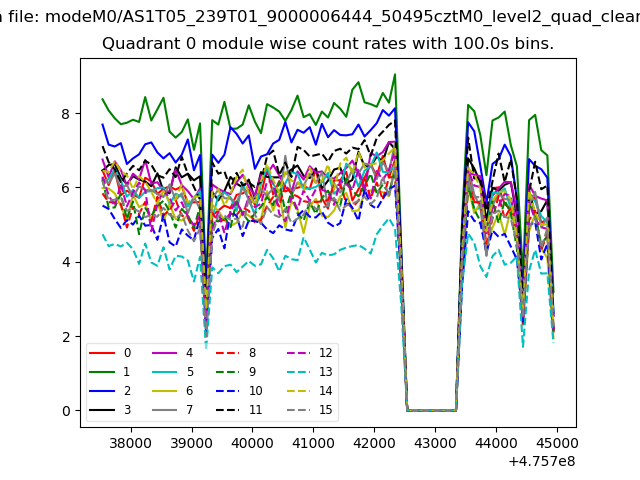 |
 |
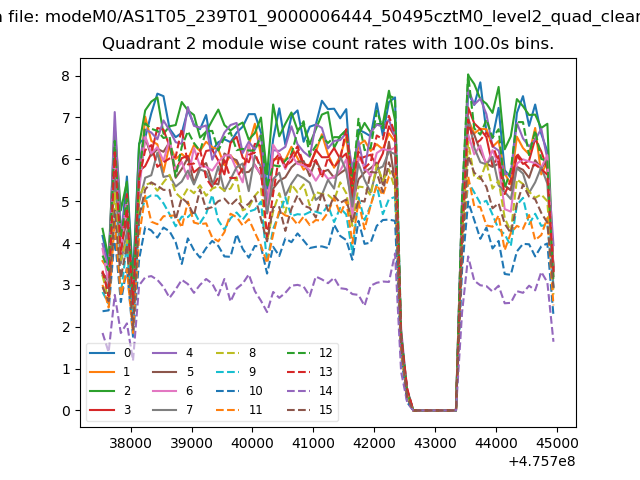
| Module-wise count rates for Quadrant B Data is divided into 100 sec bins |
 |
 |
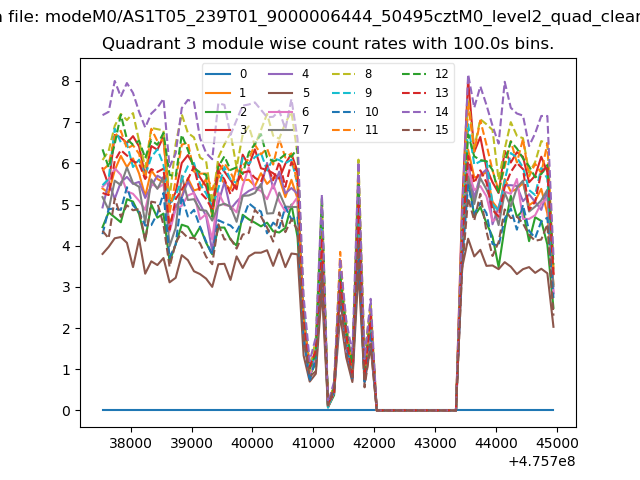
| Module-wise count rates for Quadrant C Data is divided into 100 sec bins |
 |
 |
| Module-wise count rates for Quadrant D Data is divided into 100 sec bins |
 |
 |
| Parameter | Plot |
|---|---|
| CZT HV Monitor | 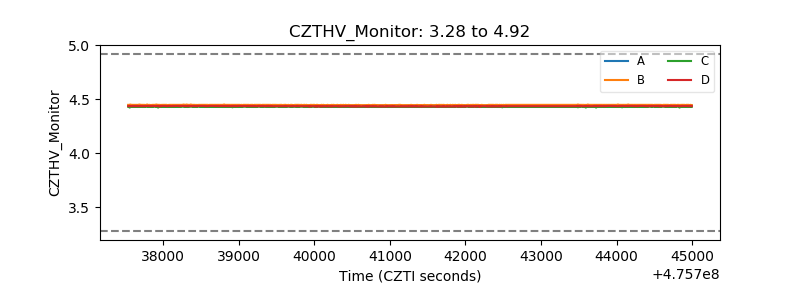 |
| D_VDD | 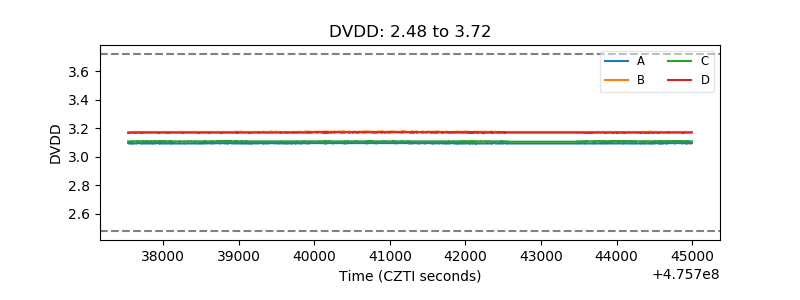 |
| Temperature 1 | 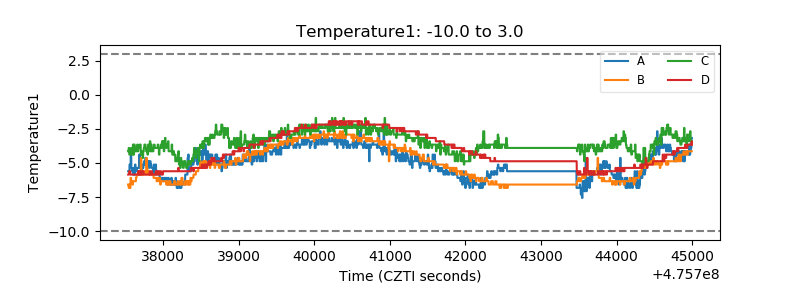 |
| Veto HV Monitor | 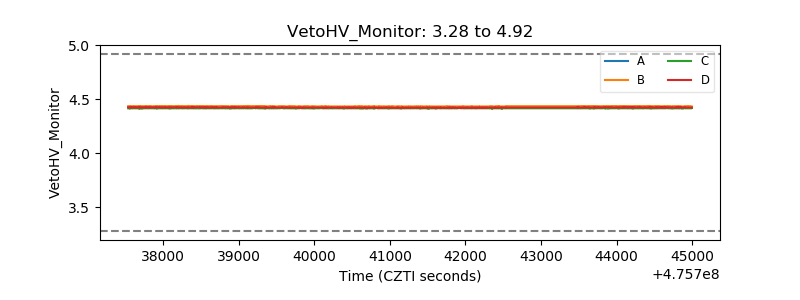 |
| Veto LLD | 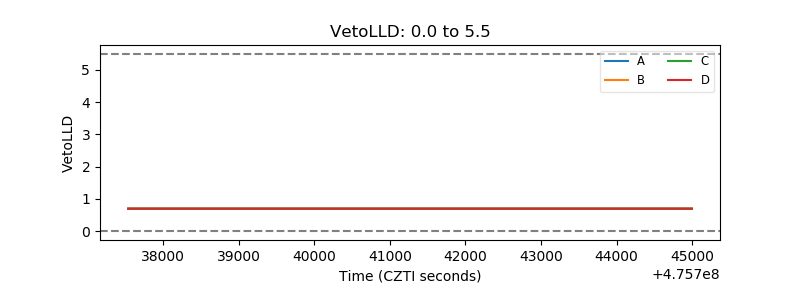 |
| Alpha Counter | 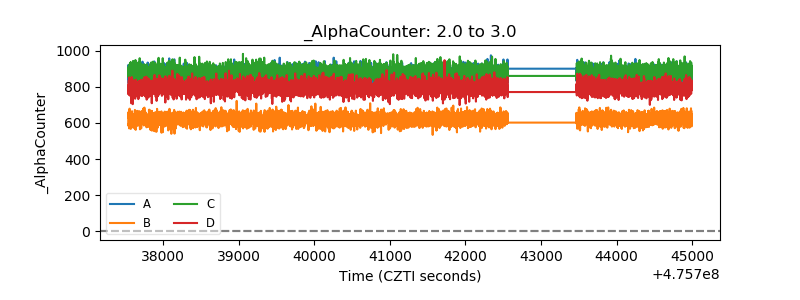 |
| _CPM_Rate | 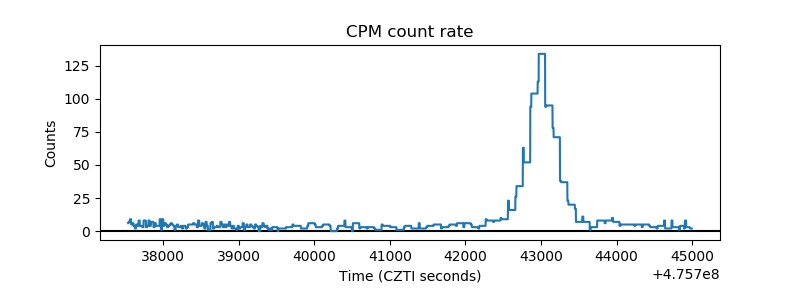 |
| CZT Counter | 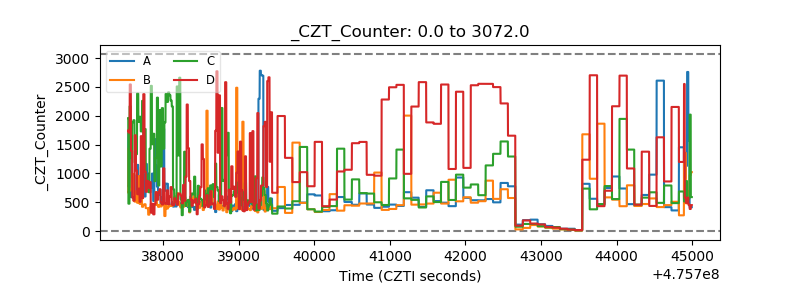 |
| +2.5 Volts monitor | 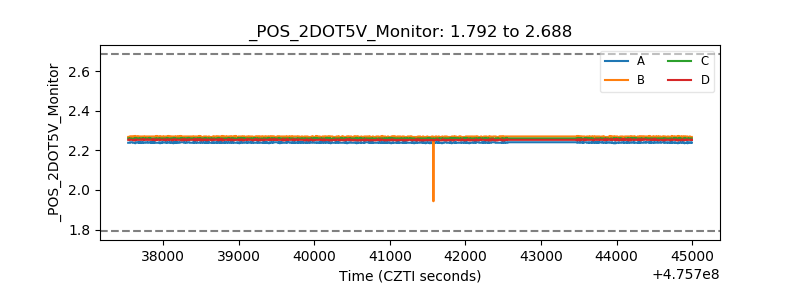 |
| +5 Volts monitor |  |
| _ROLL_ROT | 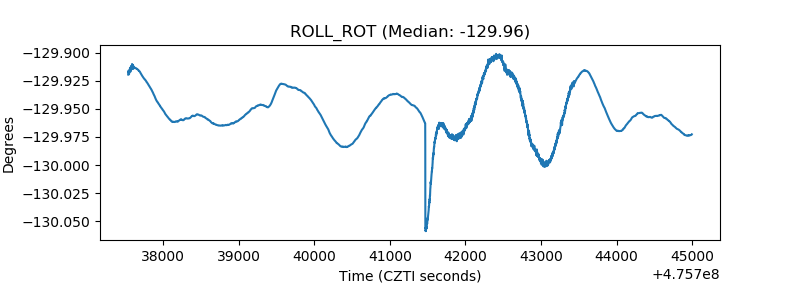 |
| _Roll_DEC | 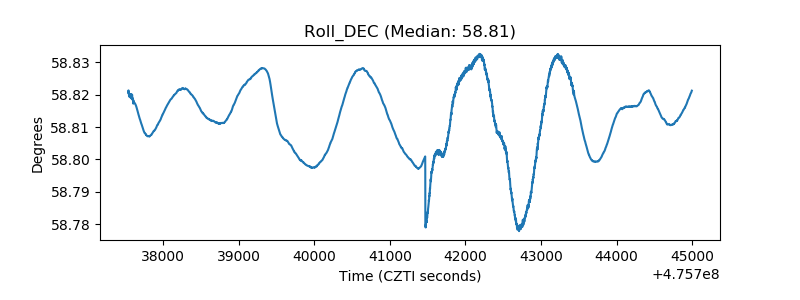 |
| _Roll_RA | 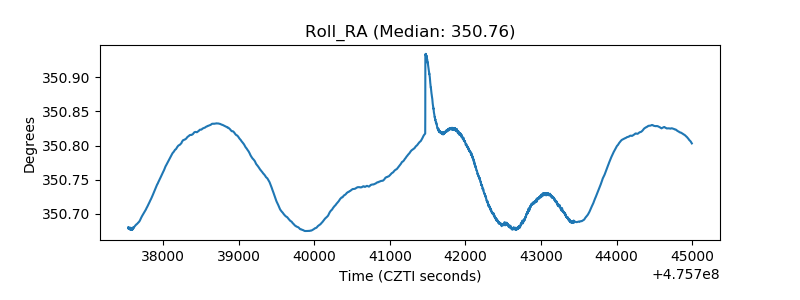 |
| Veto Counter | 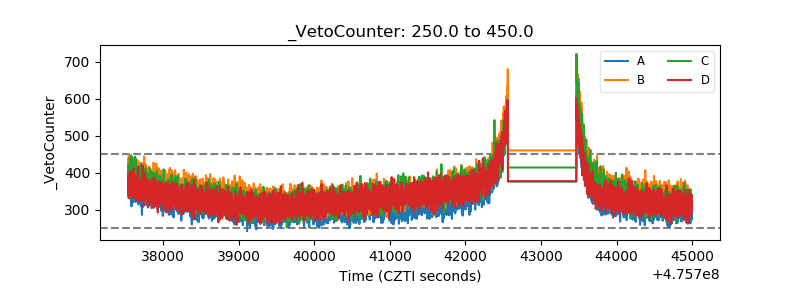 |