| Param | Original file | Final file |
|---|---|---|
| Filename | modeM0/AS1T05_239T01_9000006444_50496cztM0_level2.fits | modeM0/AS1T05_239T01_9000006444_50496cztM0_level2_quad_clean.evt |
| Size (bytes) | 642,424,320 | 92,969,280 |
| Size | 612.7 MB | 88.7 MB |
| Events in quadrant A | 5,337,659 | 583,412 |
| Events in quadrant B | 6,215,272 | 656,793 |
| Events in quadrant C | 6,227,775 | 551,155 |
| Events in quadrant D | 5,476,638 | 552,341 |
| Mode M0 | |||
|---|---|---|---|
| Quadrant | BADHDUFLAG | Total packets | Discarded packets |
| A | 0 | 20439 | 5 |
| B | 0 | 23218 | 2 |
| C | 0 | 23182 | 2 |
| D | 0 | 21083 | 2 |
| Mode M9 | |||
|---|---|---|---|
| Quadrant | BADHDUFLAG | Total packets | Discarded packets |
| A | 0 | 4 | 0 |
| B | 0 | 4 | 0 |
| C | 0 | 4 | 0 |
| D | 0 | 4 | 0 |
| Mode SS | |||
|---|---|---|---|
| Quadrant | BADHDUFLAG | Total packets | Discarded packets |
| A | 0 | 138 | 0 |
| B | 0 | 138 | 0 |
| C | 0 | 138 | 0 |
| D | 0 | 138 | 0 |
| Quadrant | Total seconds | Saturated seconds | Saturation percentage |
|---|---|---|---|
| A | 6758 | 681 | 10.076946% |
| B | 6759 | 531 | 7.856192% |
| C | 6759 | 810 | 11.984021% |
| D | 6759 | 378 | 5.592543% |
Noise dominated data is calculated using 1-second bins in cleaned event files. If a bin has >2000 counts, and if more than 50% of those come from <1% of pixels, then it is considered to be noise-dominated and hence unusable.
| Quadrant | # 1 sec bins | Bins with >0 counts | Bins with >2000 counts | High rate bins dominated by noise | Noise dominated (total time) | Noise dominated (detector-on time) | Marked lightcurve |
|---|---|---|---|---|---|---|---|
| A | 7228 | 6759 | 538 | 538 | 7.44% | 7.96% | 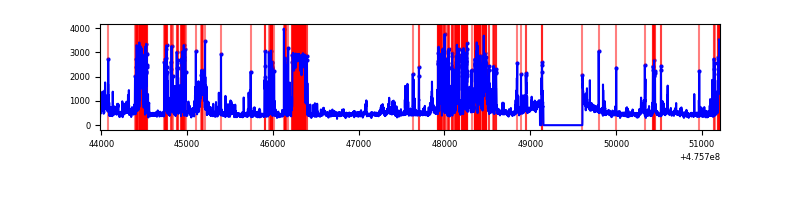 |
| B | 7229 | 6760 | 271 | 271 | 3.75% | 4.01% | 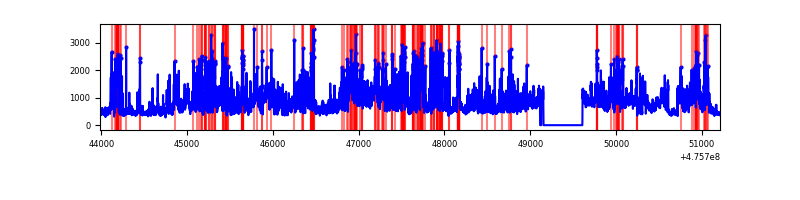 |
| C | 7229 | 6761 | 628 | 628 | 8.69% | 9.29% | 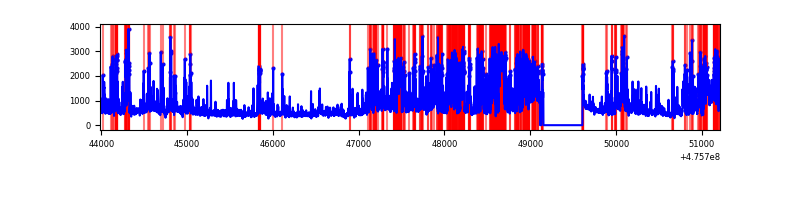 |
| D | 7229 | 6761 | 324 | 324 | 4.48% | 4.79% | 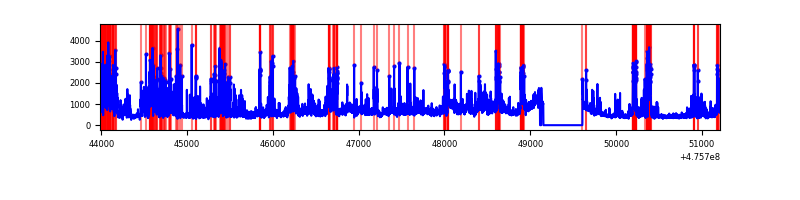 |
Top three noisy pixels from each quadrant. If the there are fewer than three noisy pixels in the level2.evt file, extra rows are filled as -1
| Pixel properties | Quadrant properties | ||||||
|---|---|---|---|---|---|---|---|
| Quadrant | DetID | PixID | Counts | Sigma | Mean | Median | Sigma |
| A | 10 | 253 | 1134641 | 6651.71 | 698 | 679 | 170.5 |
| A | 4 | 249 | 608351 | 3564.55 | 698 | 679 | 170.5 |
| A | 3 | 130 | 179575 | 1049.39 | 698 | 679 | 170.5 |
| B | 4 | 170 | 1775715 | 11747.94 | 704 | 679 | 151.1 |
| B | 7 | 0 | 987666 | 6532.3 | 704 | 679 | 151.1 |
| B | 4 | 206 | 411929 | 2721.83 | 704 | 679 | 151.1 |
| C | 0 | 208 | 633084 | 3431.8 | 666 | 661 | 184.3 |
| C | 15 | 235 | 434058 | 2351.8 | 666 | 661 | 184.3 |
| C | 15 | 213 | 368350 | 1995.24 | 666 | 661 | 184.3 |
| D | 11 | 161 | 751313 | 3905.84 | 691 | 667 | 192.2 |
| D | 6 | 42 | 391916 | 2035.79 | 691 | 667 | 192.2 |
| D | 7 | 61 | 385443 | 2002.11 | 691 | 667 | 192.2 |
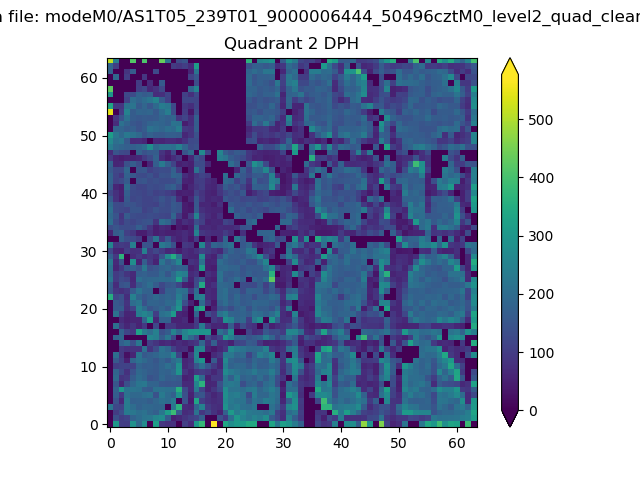
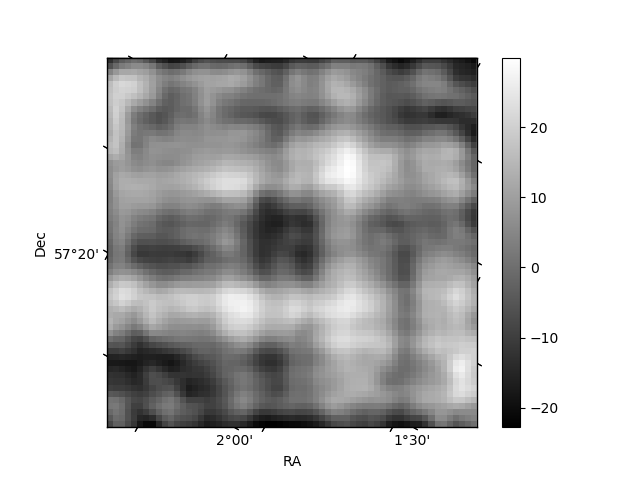
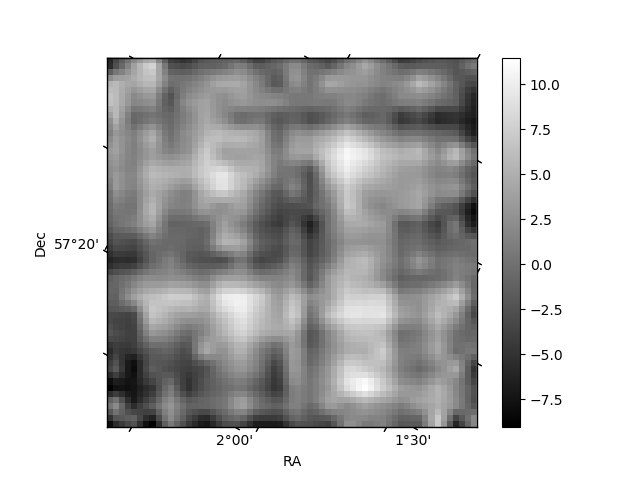
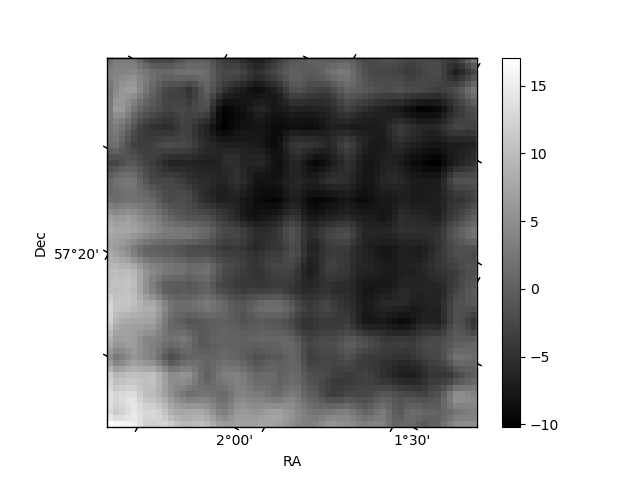
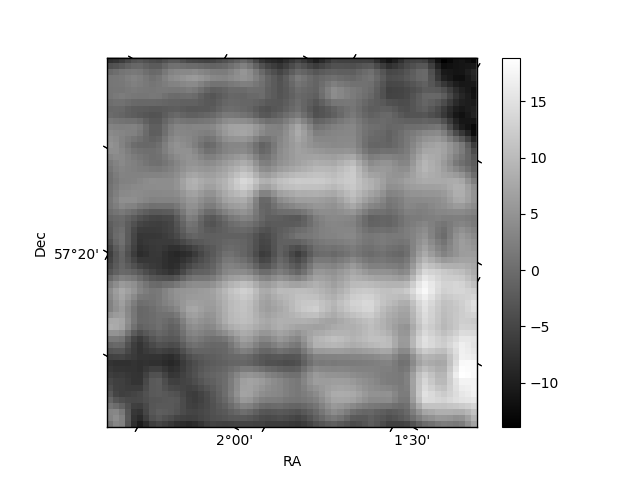
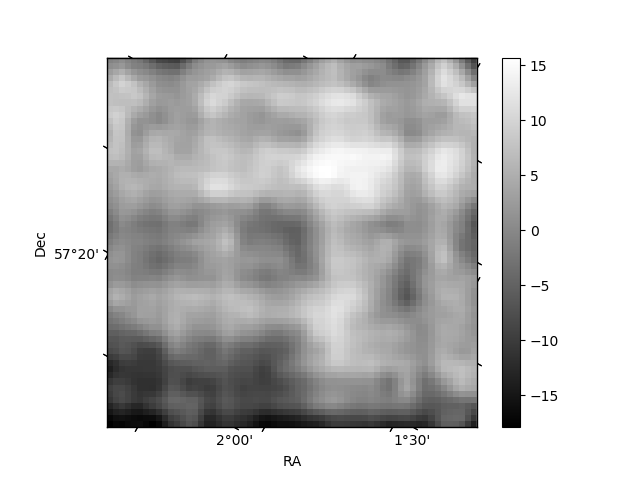
Histogram calculated using DETX and DETY for each event in the final _common_clean file
| Quadrant A | 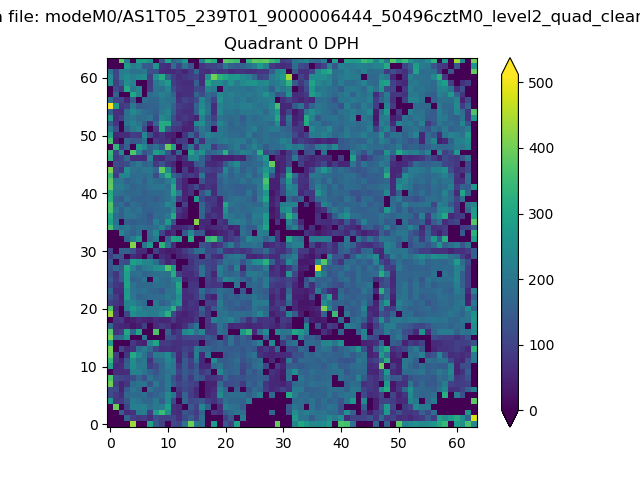 |
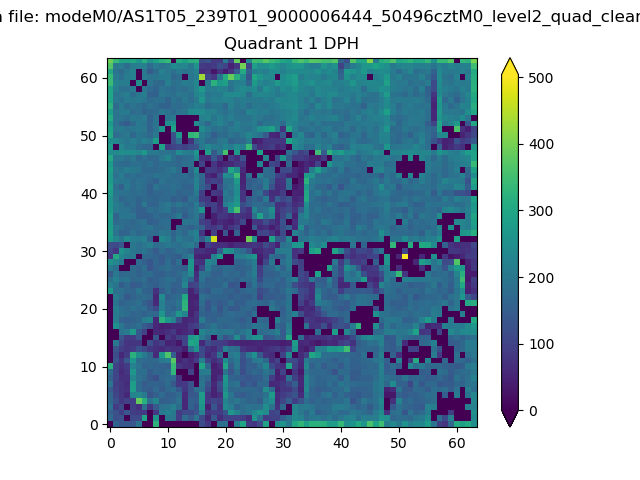 |
Quadrant B |
|---|---|---|---|
| Quadrant D | 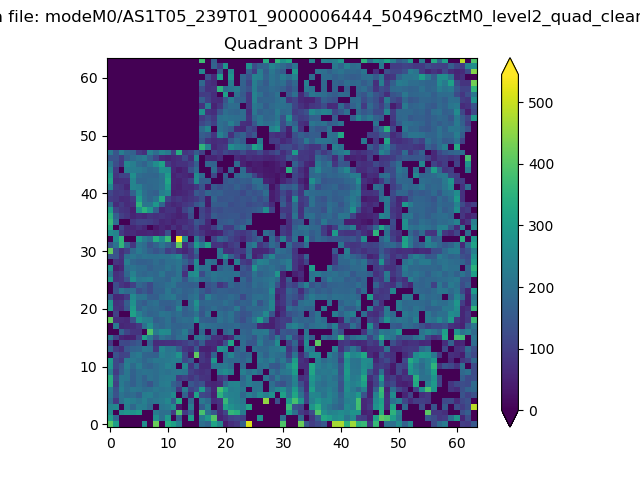 |
 |
Quadrant C |
| Plot type | Count rate plots | Images |
|---|---|---|
| Comparison with Poisson distribution Blue bars denote a histogram of data divided into 1 sec bins. Red curve is a Poisson curve with rate = median count rate of data. |
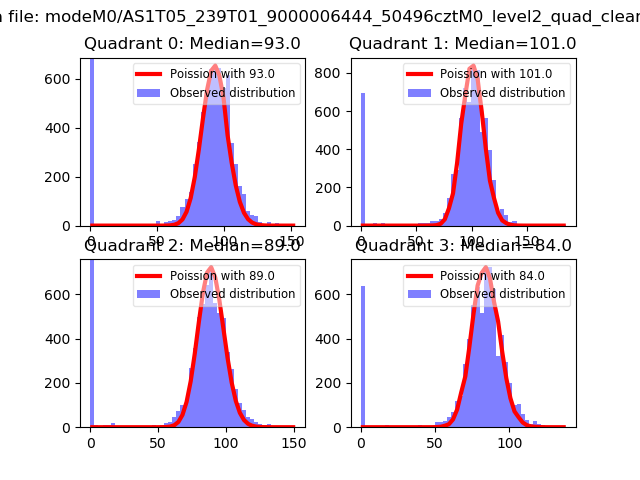 |
 |
| Quadrant-wise count rates Data is divided into 100 sec bins |
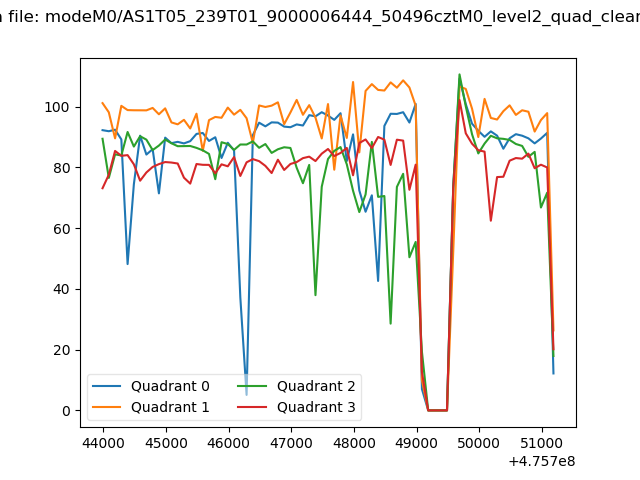 |
|
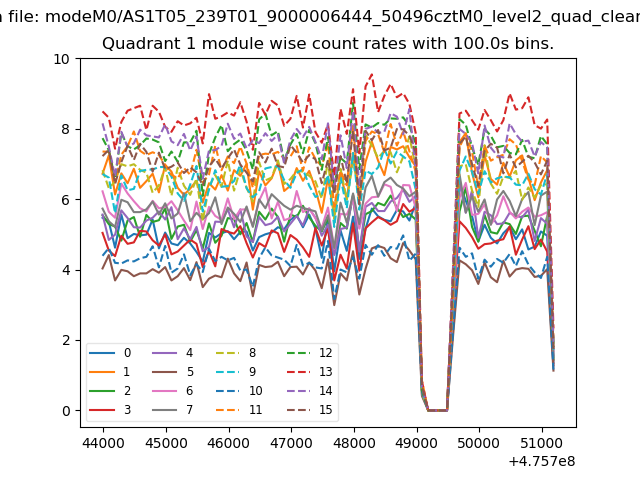
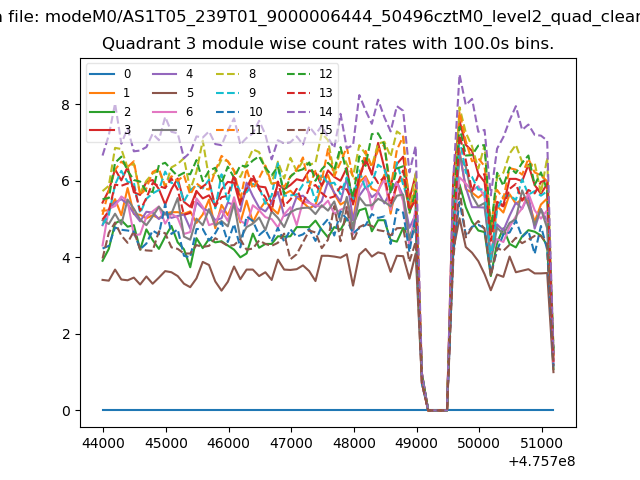
| Module-wise count rates for Quadrant A Data is divided into 100 sec bins |
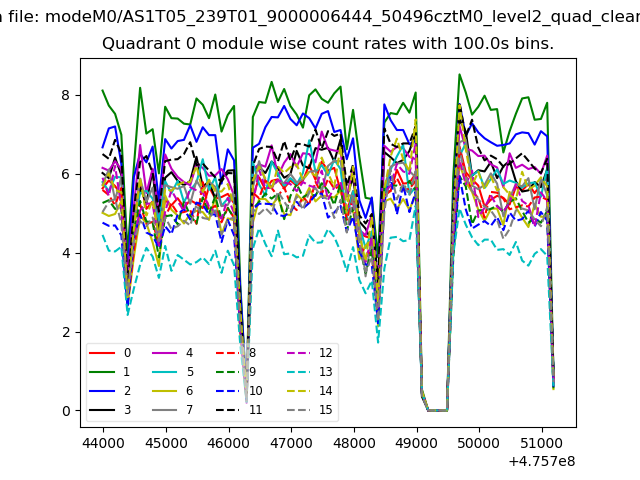 |
 |
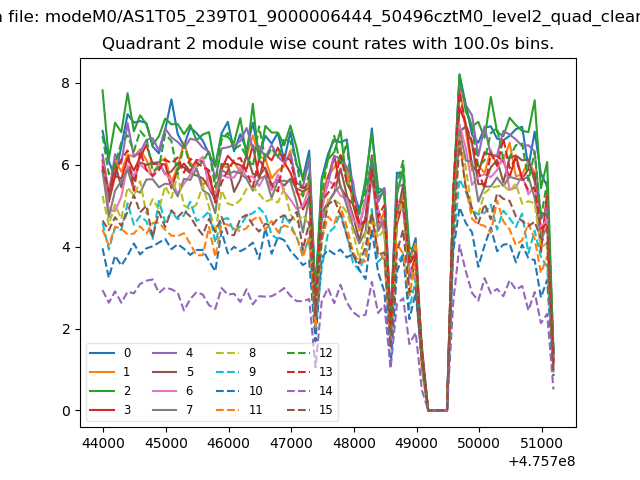
| Module-wise count rates for Quadrant B Data is divided into 100 sec bins |
 |
 |
| Module-wise count rates for Quadrant C Data is divided into 100 sec bins |
 |
 |
| Module-wise count rates for Quadrant D Data is divided into 100 sec bins |
 |
 |
| Parameter | Plot |
|---|---|
| CZT HV Monitor |  |
| D_VDD | 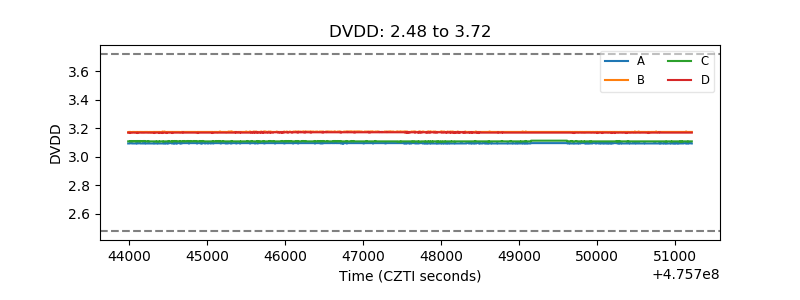 |
| Temperature 1 | 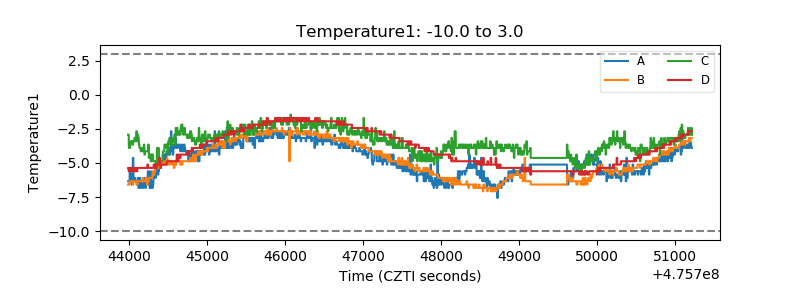 |
| Veto HV Monitor | 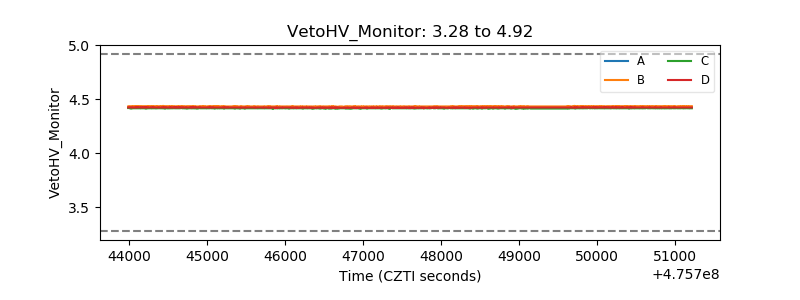 |
| Veto LLD |  |
| Alpha Counter | 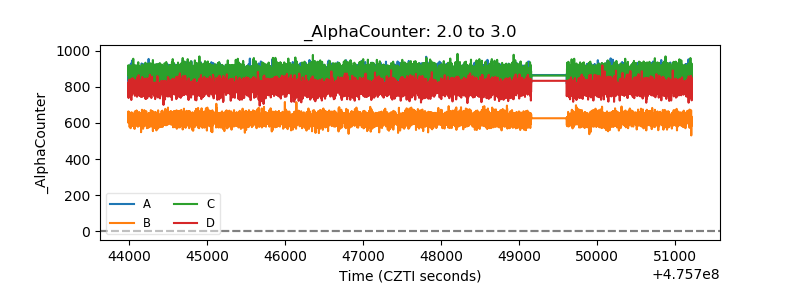 |
| _CPM_Rate | 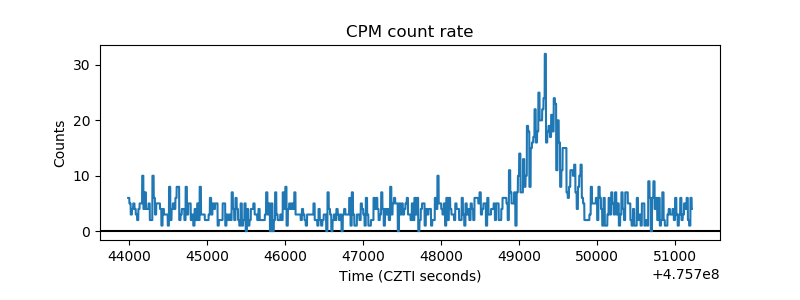 |
| CZT Counter | 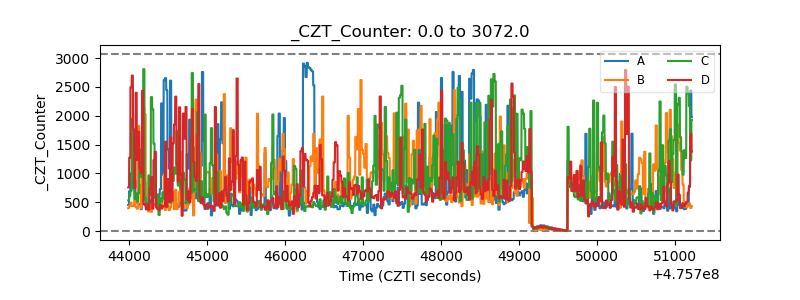 |
| +2.5 Volts monitor | 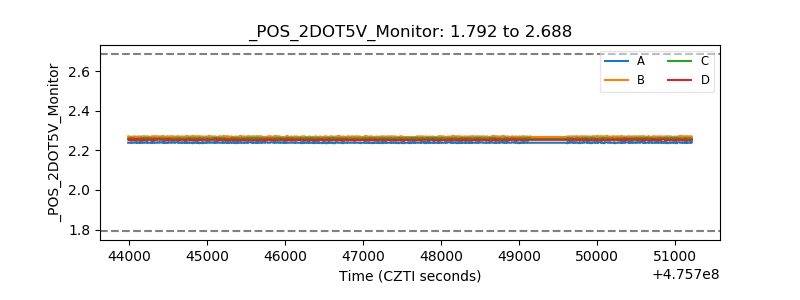 |
| +5 Volts monitor |  |
| _ROLL_ROT | 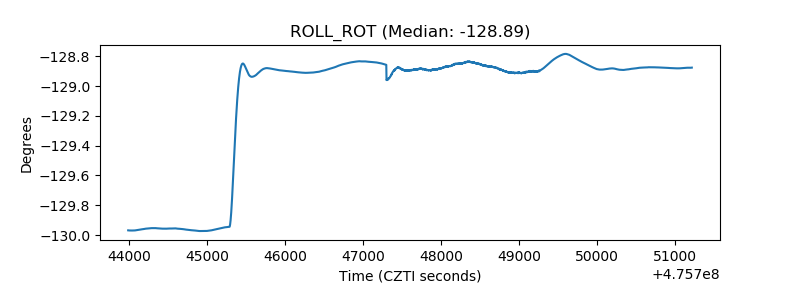 |
| _Roll_DEC | 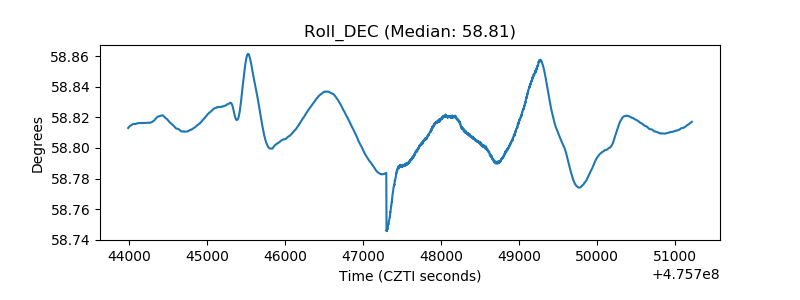 |
| _Roll_RA | 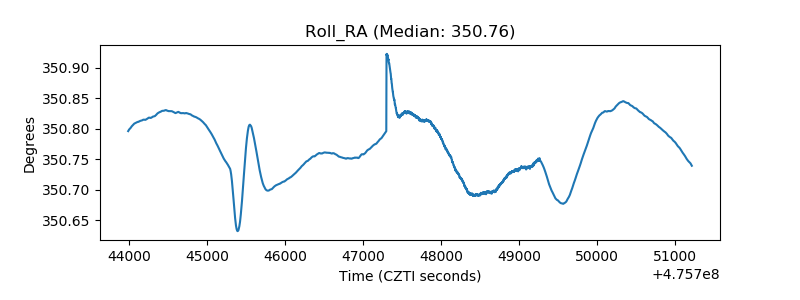 |
| Veto Counter | 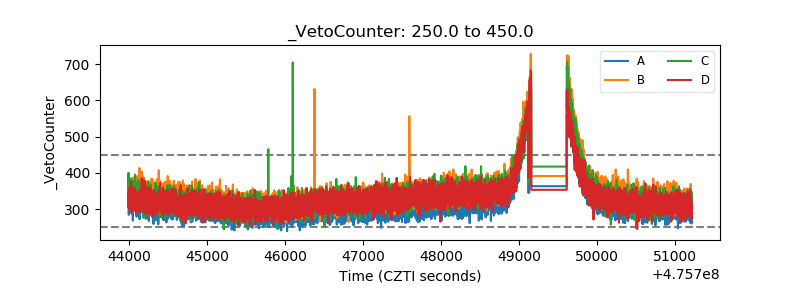 |