| Param | Original file | Final file |
|---|---|---|
| Filename | modeM0/AS1T05_239T01_9000006444_50497cztM0_level2.fits | modeM0/AS1T05_239T01_9000006444_50497cztM0_level2_quad_clean.evt |
| Size (bytes) | 853,914,240 | 90,290,880 |
| Size | 814.4 MB | 86.1 MB |
| Events in quadrant A | 5,510,439 | 628,967 |
| Events in quadrant B | 6,018,451 | 682,304 |
| Events in quadrant C | 9,647,339 | 454,583 |
| Events in quadrant D | 9,878,390 | 468,098 |
| Mode M0 | |||
|---|---|---|---|
| Quadrant | BADHDUFLAG | Total packets | Discarded packets |
| A | 0 | 21274 | 0 |
| B | 0 | 22810 | 0 |
| C | 0 | 33733 | 0 |
| D | 0 | 34382 | 0 |
| Mode SS | |||
|---|---|---|---|
| Quadrant | BADHDUFLAG | Total packets | Discarded packets |
| A | 0 | 142 | 0 |
| B | 0 | 142 | 0 |
| C | 0 | 142 | 0 |
| D | 0 | 142 | 0 |
| Quadrant | Total seconds | Saturated seconds | Saturation percentage |
|---|---|---|---|
| A | 7181 | 599 | 8.341457% |
| B | 7182 | 652 | 9.078251% |
| C | 7182 | 2250 | 31.328321% |
| D | 7182 | 1798 | 25.034809% |
Noise dominated data is calculated using 1-second bins in cleaned event files. If a bin has >2000 counts, and if more than 50% of those come from <1% of pixels, then it is considered to be noise-dominated and hence unusable.
| Quadrant | # 1 sec bins | Bins with >0 counts | Bins with >2000 counts | High rate bins dominated by noise | Noise dominated (total time) | Noise dominated (detector-on time) | Marked lightcurve |
|---|---|---|---|---|---|---|---|
| A | 7181 | 7181 | 451 | 451 | 6.28% | 6.28% | 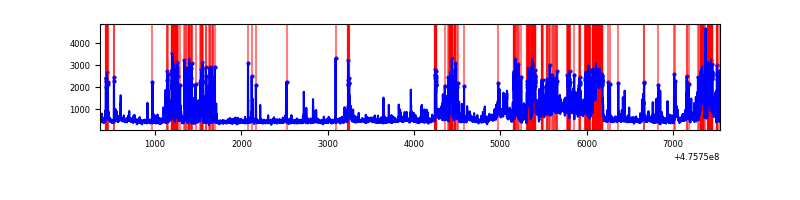 |
| B | 7182 | 7182 | 542 | 542 | 7.55% | 7.55% | 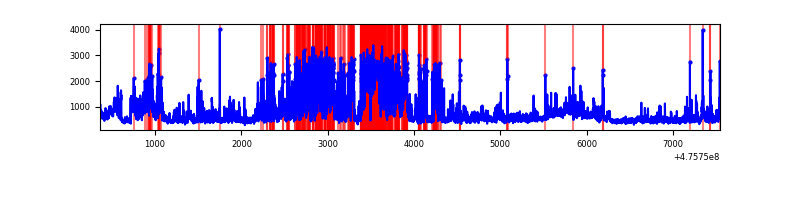 |
| C | 7181 | 7181 | 1708 | 1708 | 23.78% | 23.78% | 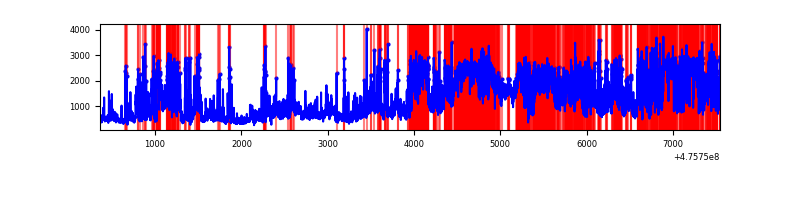 |
| D | 7182 | 7182 | 1732 | 1732 | 24.12% | 24.12% | 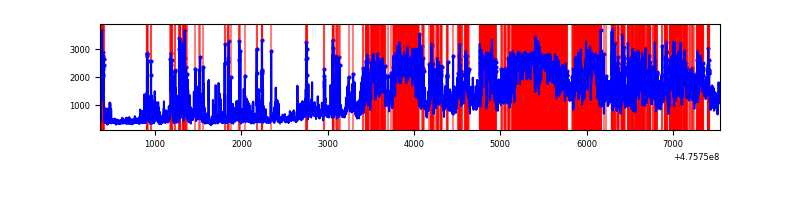 |
Top three noisy pixels from each quadrant. If the there are fewer than three noisy pixels in the level2.evt file, extra rows are filled as -1
| Pixel properties | Quadrant properties | ||||||
|---|---|---|---|---|---|---|---|
| Quadrant | DetID | PixID | Counts | Sigma | Mean | Median | Sigma |
| A | 10 | 253 | 1309076 | 7099.59 | 747 | 728 | 184.3 |
| A | 3 | 130 | 406314 | 2200.86 | 747 | 728 | 184.3 |
| A | 4 | 3 | 161027 | 869.84 | 747 | 728 | 184.3 |
| B | 7 | 0 | 1623117 | 10089.41 | 745 | 718 | 160.8 |
| B | 4 | 206 | 719825 | 4472.0 | 745 | 718 | 160.8 |
| B | 4 | 170 | 456907 | 2836.96 | 745 | 718 | 160.8 |
| C | 15 | 214 | 1767844 | 10409.3 | 614 | 611 | 169.8 |
| C | 0 | 208 | 894343 | 5264.23 | 614 | 611 | 169.8 |
| C | 15 | 196 | 783319 | 4610.28 | 614 | 611 | 169.8 |
| D | 7 | 61 | 3009546 | 16498.62 | 655 | 631 | 182.4 |
| D | 6 | 42 | 1793926 | 9833.08 | 655 | 631 | 182.4 |
| D | 11 | 161 | 583578 | 3196.44 | 655 | 631 | 182.4 |
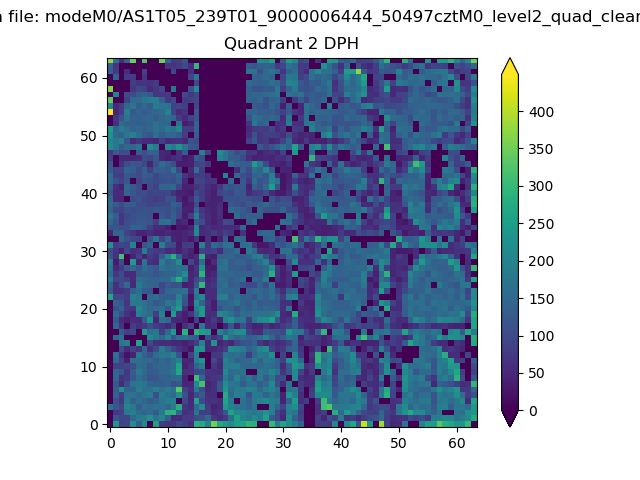
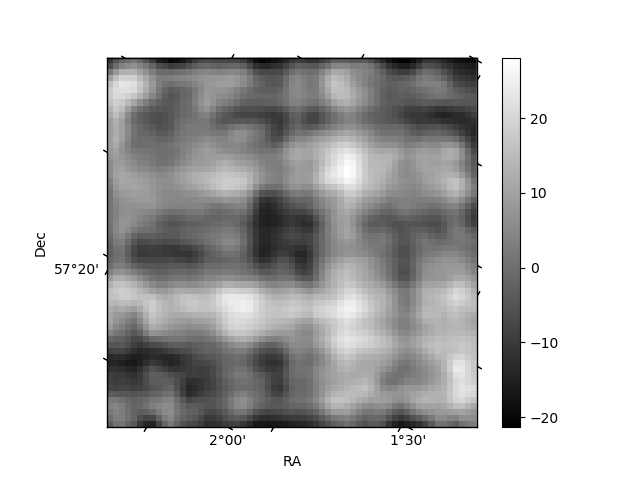
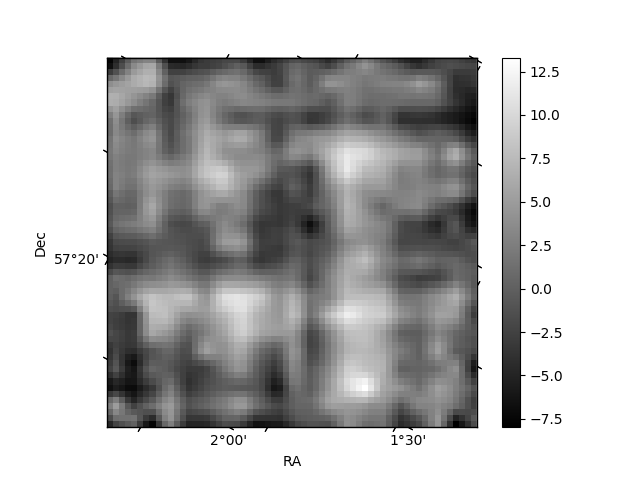
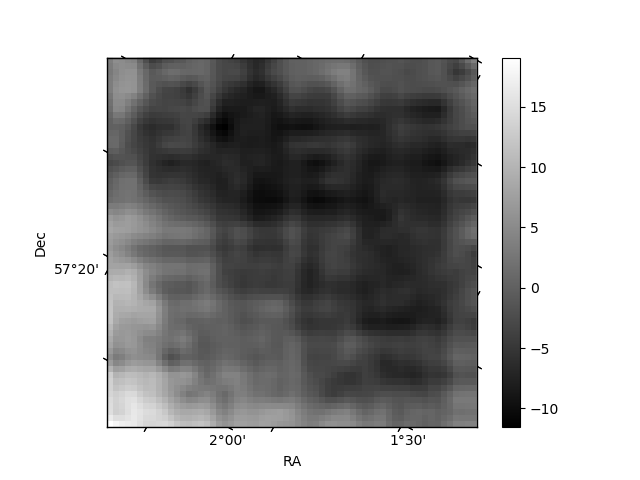
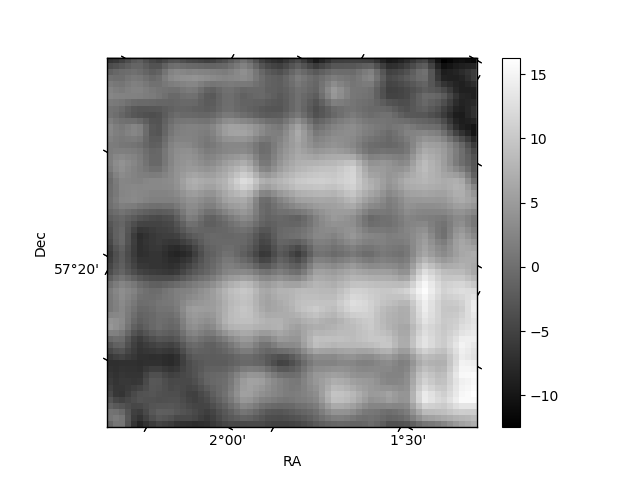
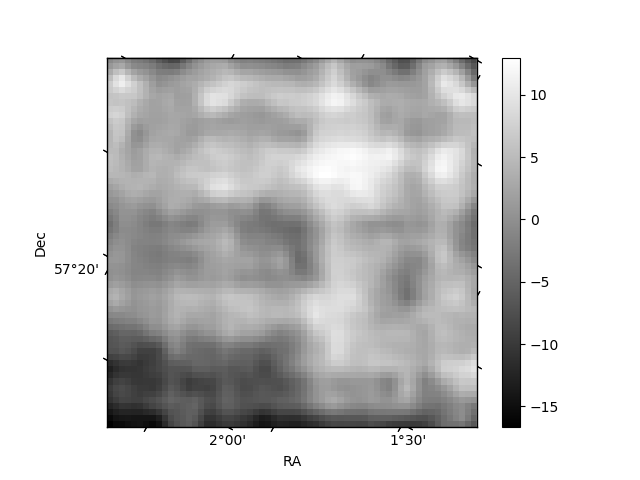
Histogram calculated using DETX and DETY for each event in the final _common_clean file
| Quadrant A | 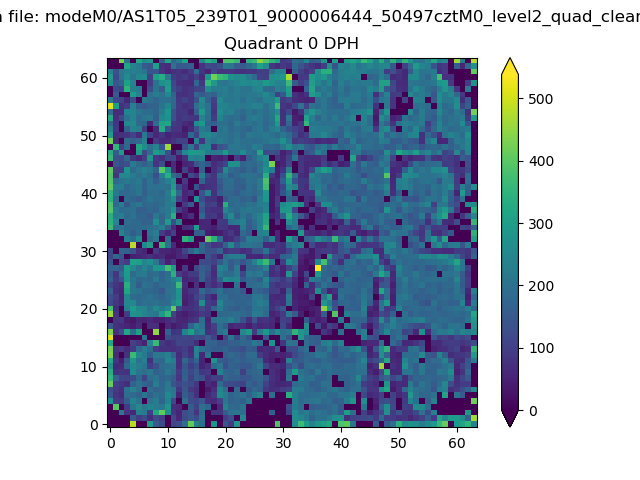 |
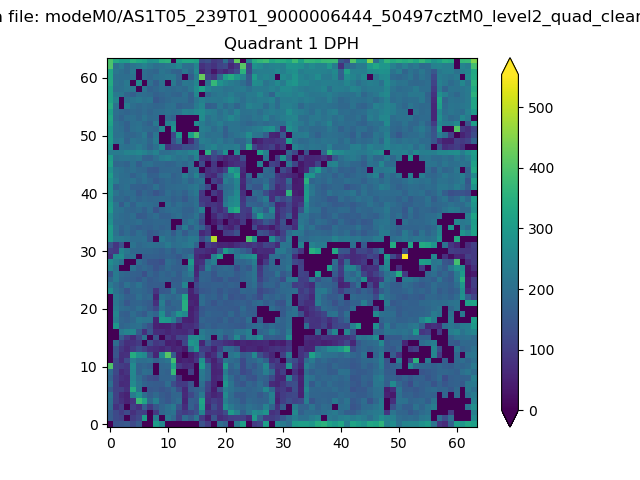 |
Quadrant B |
|---|---|---|---|
| Quadrant D | 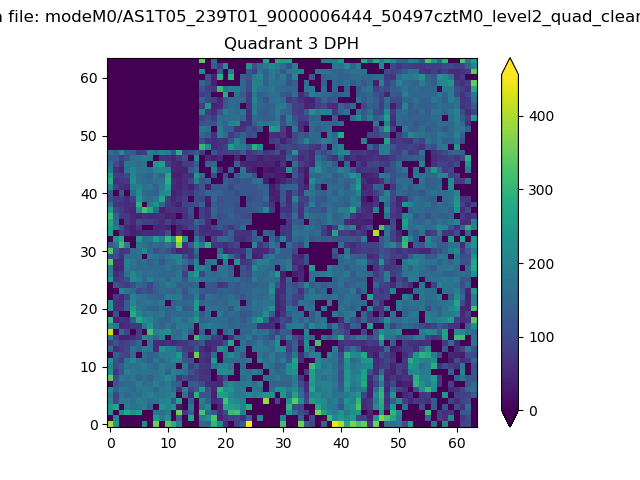 |
 |
Quadrant C |
| Plot type | Count rate plots | Images |
|---|---|---|
| Comparison with Poisson distribution Blue bars denote a histogram of data divided into 1 sec bins. Red curve is a Poisson curve with rate = median count rate of data. |
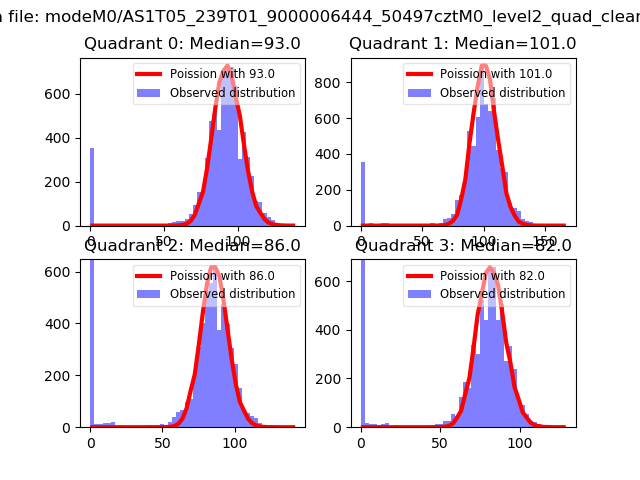 |
 |
| Quadrant-wise count rates Data is divided into 100 sec bins |
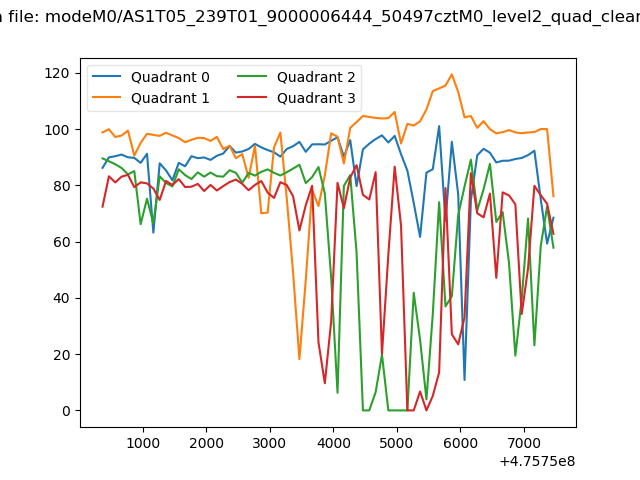 |
|
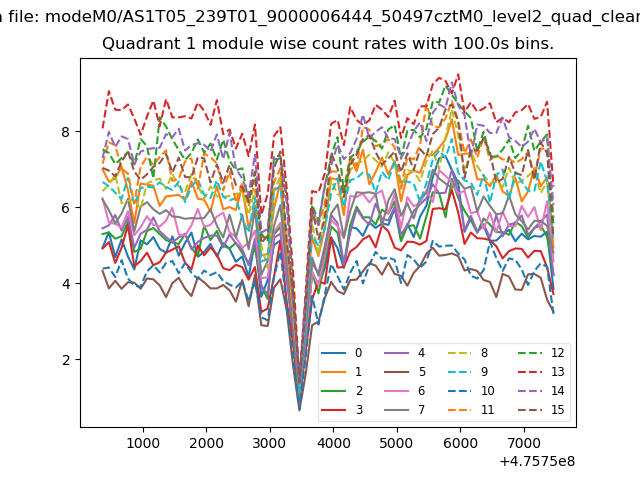
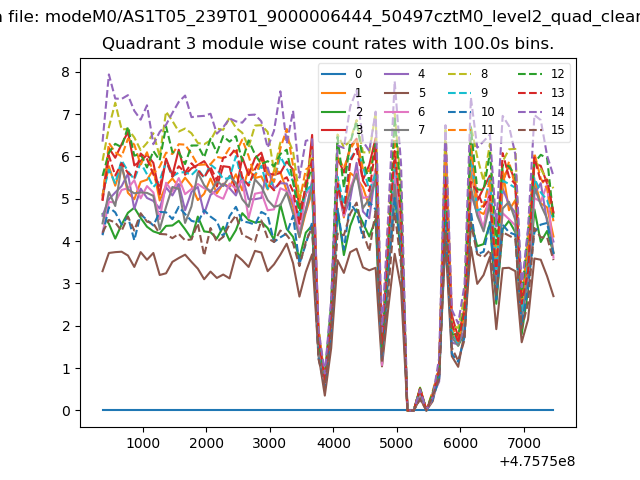
| Module-wise count rates for Quadrant A Data is divided into 100 sec bins |
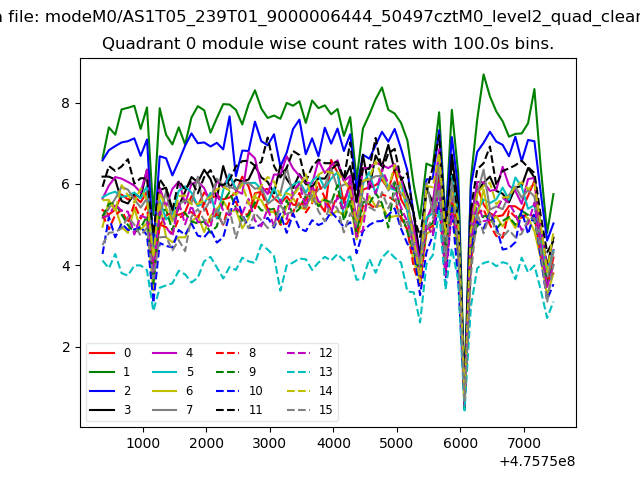 |
 |
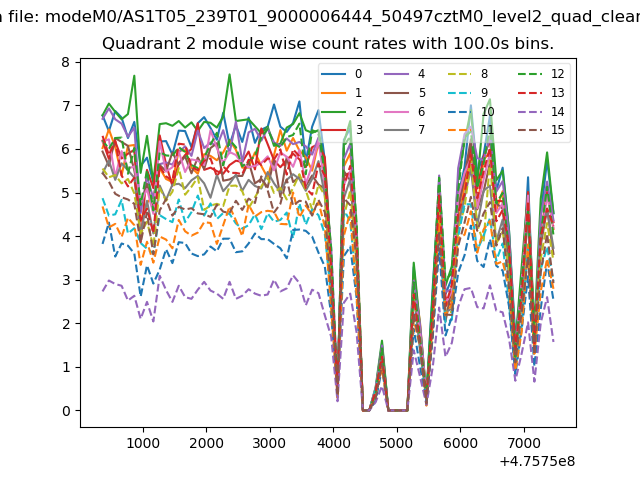
| Module-wise count rates for Quadrant B Data is divided into 100 sec bins |
 |
 |
| Module-wise count rates for Quadrant C Data is divided into 100 sec bins |
 |
 |
| Module-wise count rates for Quadrant D Data is divided into 100 sec bins |
 |
 |
| Parameter | Plot |
|---|---|
| CZT HV Monitor |  |
| D_VDD | 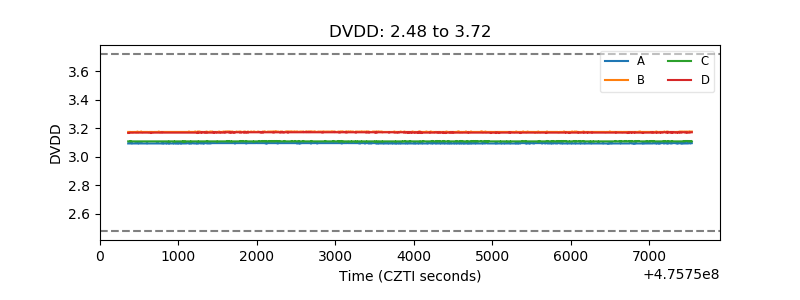 |
| Temperature 1 | 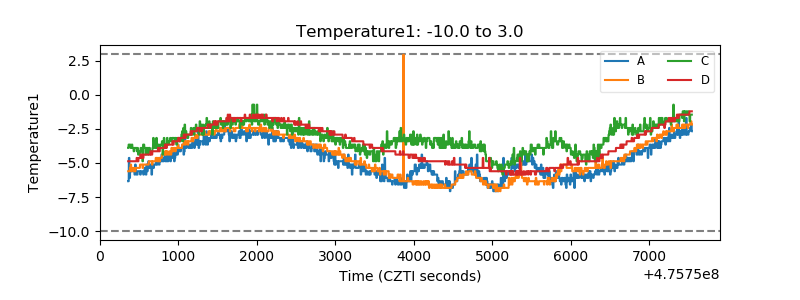 |
| Veto HV Monitor | 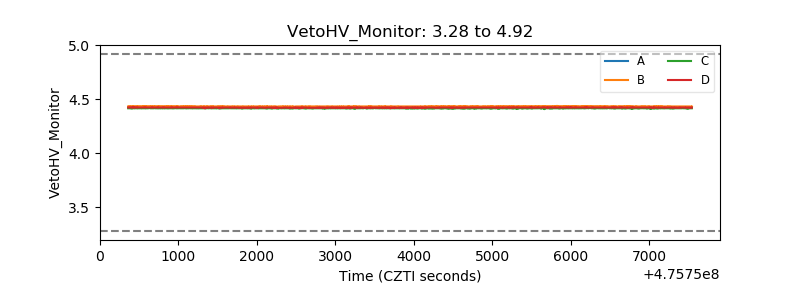 |
| Veto LLD |  |
| Alpha Counter | 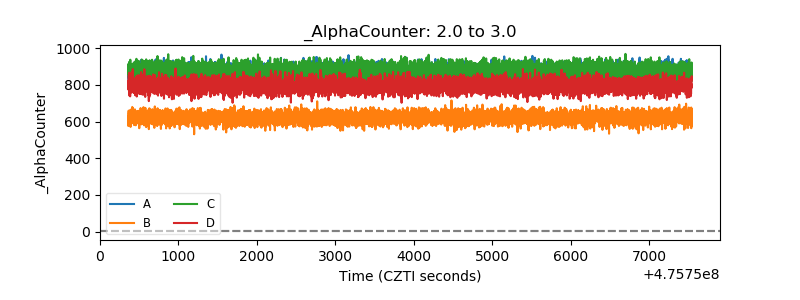 |
| _CPM_Rate | 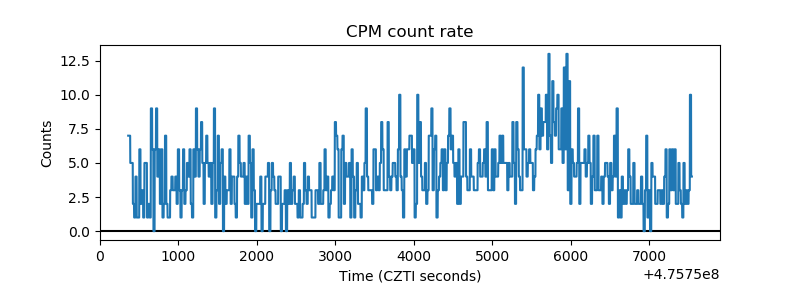 |
| CZT Counter | 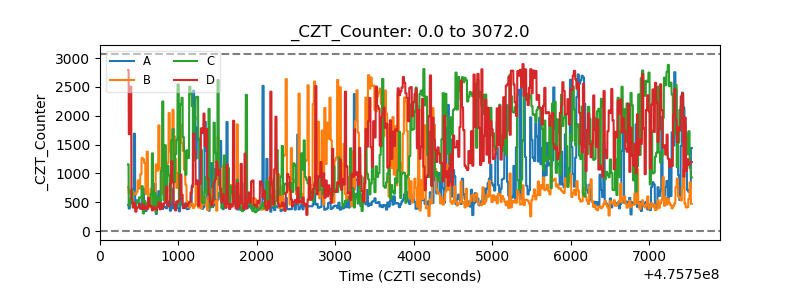 |
| +2.5 Volts monitor |  |
| +5 Volts monitor | 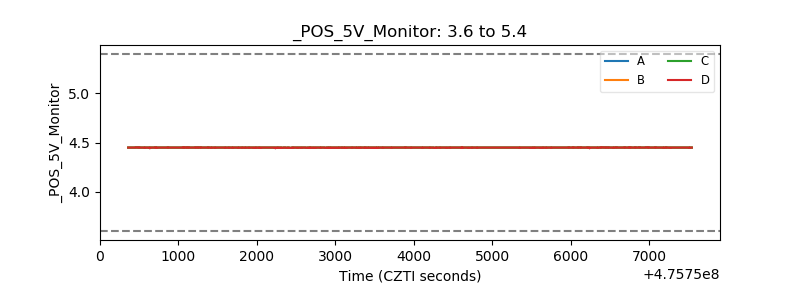 |
| _ROLL_ROT | 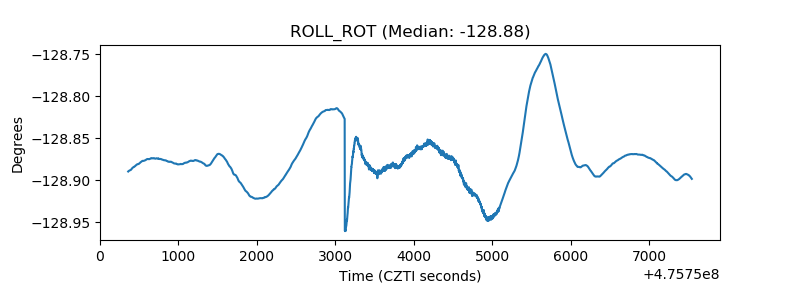 |
| _Roll_DEC | 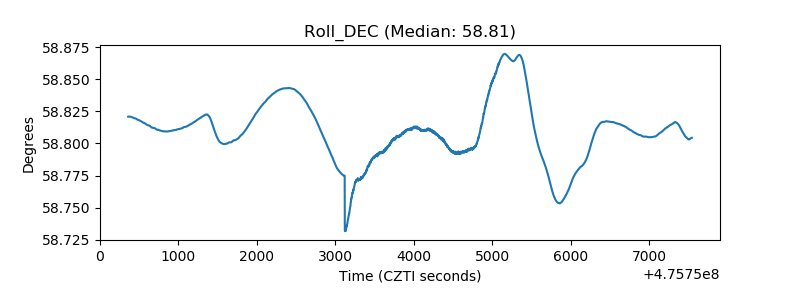 |
| _Roll_RA | 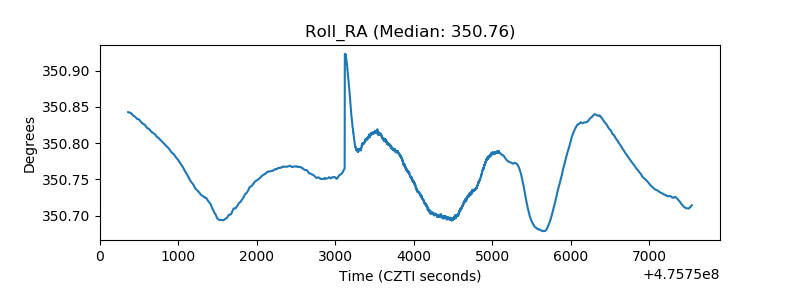 |
| Veto Counter | 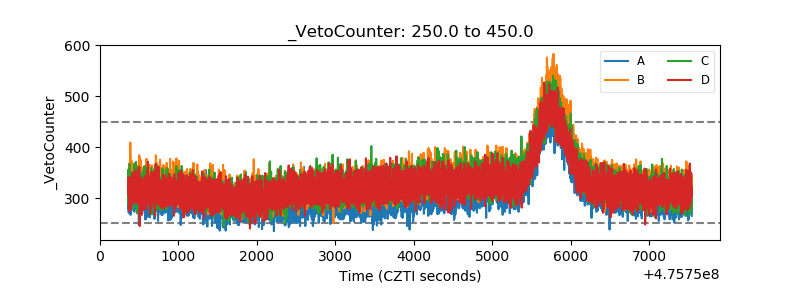 |