| Param | Original file | Final file |
|---|---|---|
| Filename | modeM0/AS1T05_239T01_9000006444_50498cztM0_level2.fits | modeM0/AS1T05_239T01_9000006444_50498cztM0_level2_quad_clean.evt |
| Size (bytes) | 1,193,428,800 | 80,447,040 |
| Size | 1.1 GB | 76.7 MB |
| Events in quadrant A | 5,630,881 | 684,714 |
| Events in quadrant B | 7,373,224 | 625,975 |
| Events in quadrant C | 13,376,699 | 426,547 |
| Events in quadrant D | 17,210,495 | 169,363 |
| Mode M0 | |||
|---|---|---|---|
| Quadrant | BADHDUFLAG | Total packets | Discarded packets |
| A | 0 | 21872 | 0 |
| B | 0 | 27188 | 0 |
| C | 0 | 45072 | 0 |
| D | 0 | 56241 | 0 |
| Mode SS | |||
|---|---|---|---|
| Quadrant | BADHDUFLAG | Total packets | Discarded packets |
| A | 0 | 152 | 0 |
| B | 0 | 152 | 0 |
| C | 0 | 152 | 0 |
| D | 0 | 152 | 0 |
| Quadrant | Total seconds | Saturated seconds | Saturation percentage |
|---|---|---|---|
| A | 7600 | 318 | 4.184211% |
| B | 7600 | 1493 | 19.644737% |
| C | 7600 | 3265 | 42.960526% |
| D | 7600 | 5843 | 76.881579% |
Noise dominated data is calculated using 1-second bins in cleaned event files. If a bin has >2000 counts, and if more than 50% of those come from <1% of pixels, then it is considered to be noise-dominated and hence unusable.
| Quadrant | # 1 sec bins | Bins with >0 counts | Bins with >2000 counts | High rate bins dominated by noise | Noise dominated (total time) | Noise dominated (detector-on time) | Marked lightcurve |
|---|---|---|---|---|---|---|---|
| A | 7600 | 7600 | 224 | 224 | 2.95% | 2.95% | 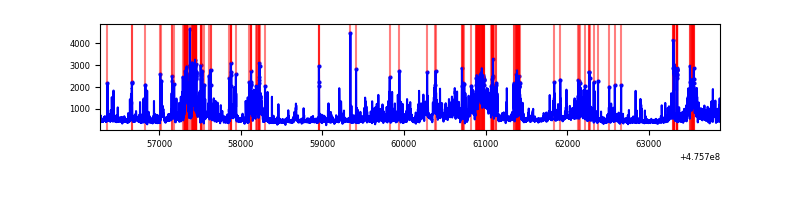 |
| B | 7600 | 7600 | 1261 | 1261 | 16.59% | 16.59% | 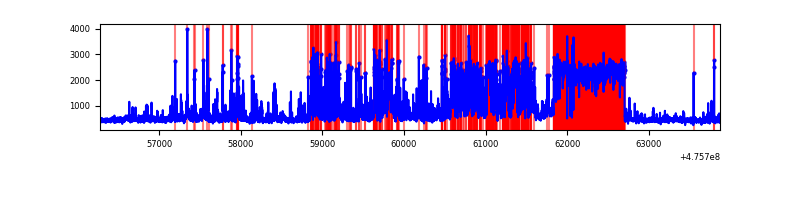 |
| C | 7599 | 7599 | 3050 | 3050 | 40.14% | 40.14% | 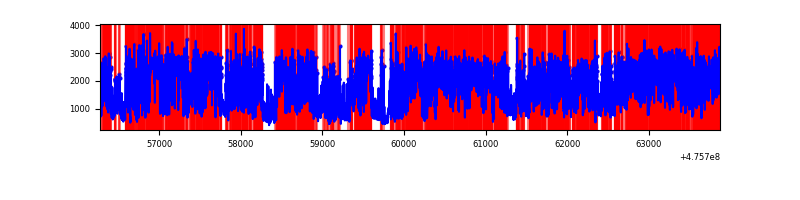 |
| D | 7599 | 7599 | 5867 | 5867 | 77.21% | 77.21% | 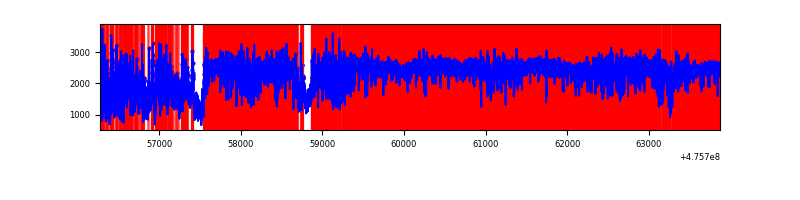 |
Top three noisy pixels from each quadrant. If the there are fewer than three noisy pixels in the level2.evt file, extra rows are filled as -1
| Pixel properties | Quadrant properties | ||||||
|---|---|---|---|---|---|---|---|
| Quadrant | DetID | PixID | Counts | Sigma | Mean | Median | Sigma |
| A | 10 | 253 | 1088011 | 5498.07 | 795 | 775 | 197.7 |
| A | 12 | 250 | 532365 | 2688.21 | 795 | 775 | 197.7 |
| A | 4 | 3 | 216014 | 1088.45 | 795 | 775 | 197.7 |
| B | 4 | 206 | 3614811 | 23272.46 | 722 | 696 | 155.3 |
| B | 7 | 0 | 368740 | 2369.95 | 722 | 696 | 155.3 |
| B | 4 | 170 | 159768 | 1024.32 | 722 | 696 | 155.3 |
| C | 15 | 235 | 2904745 | 15866.24 | 658 | 654 | 183.0 |
| C | 15 | 196 | 2014090 | 11000.23 | 658 | 654 | 183.0 |
| C | 15 | 236 | 1544966 | 8437.21 | 658 | 654 | 183.0 |
| D | 7 | 61 | 11198066 | 79696.65 | 500 | 482 | 140.5 |
| D | 11 | 161 | 885681 | 6300.23 | 500 | 482 | 140.5 |
| D | 6 | 42 | 579501 | 4121.06 | 500 | 482 | 140.5 |
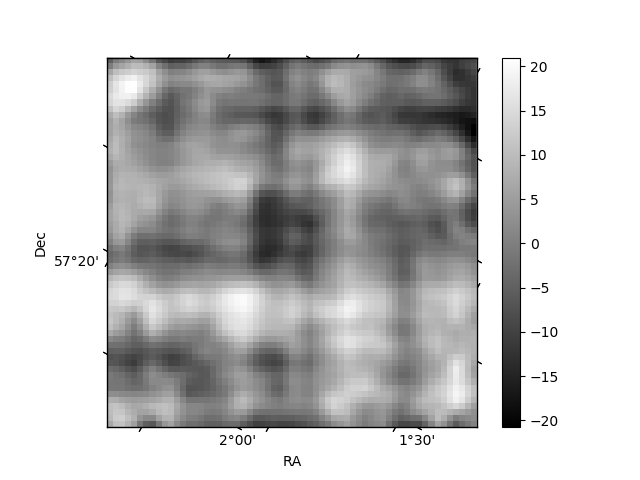
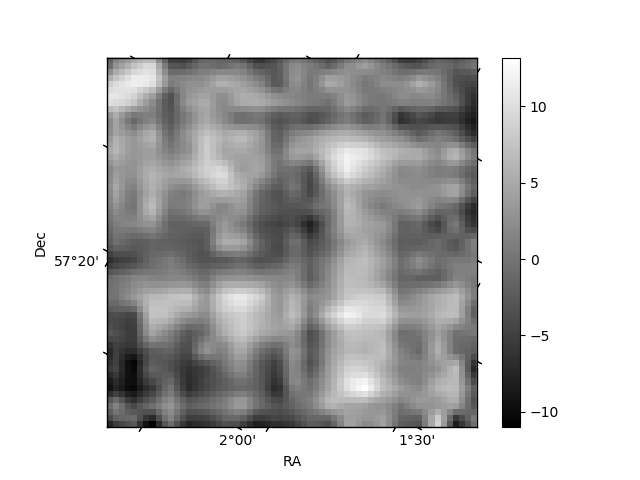
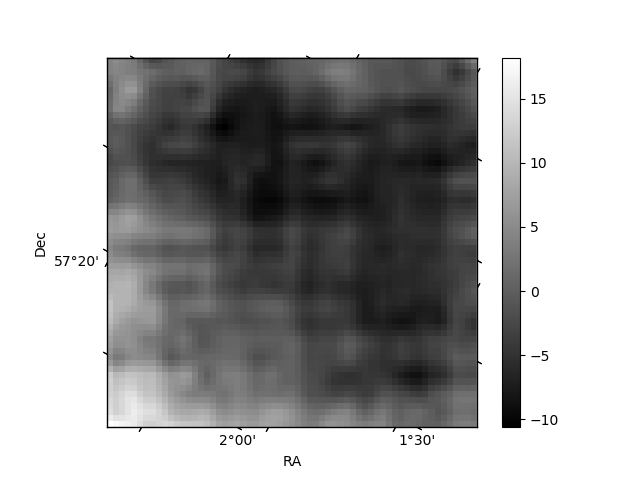
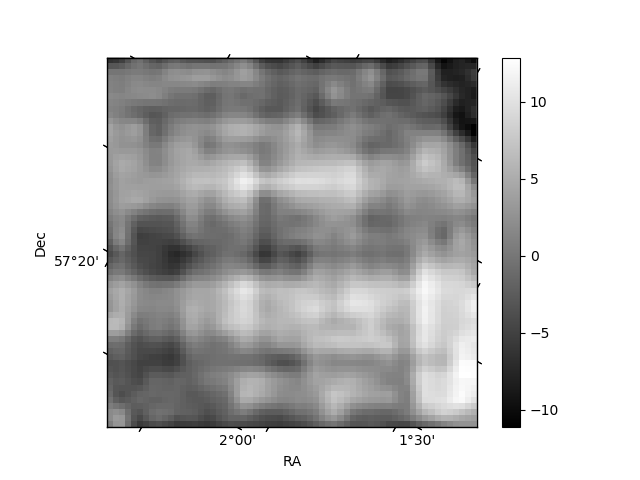
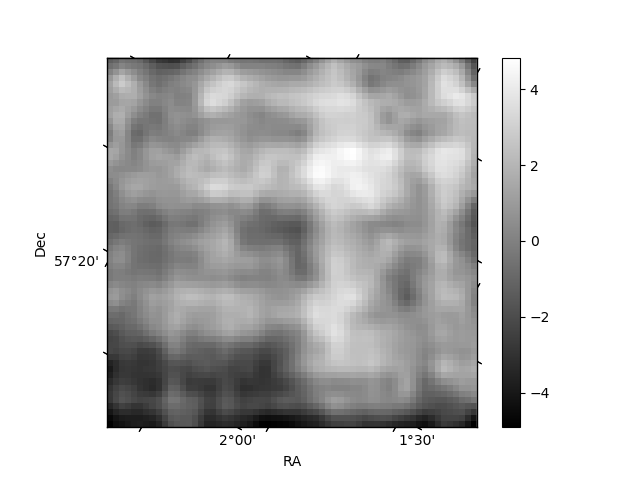
Histogram calculated using DETX and DETY for each event in the final _common_clean file
| Quadrant A | 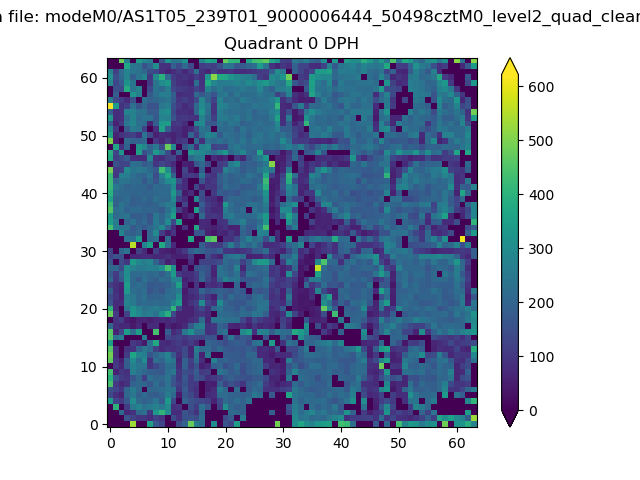 |
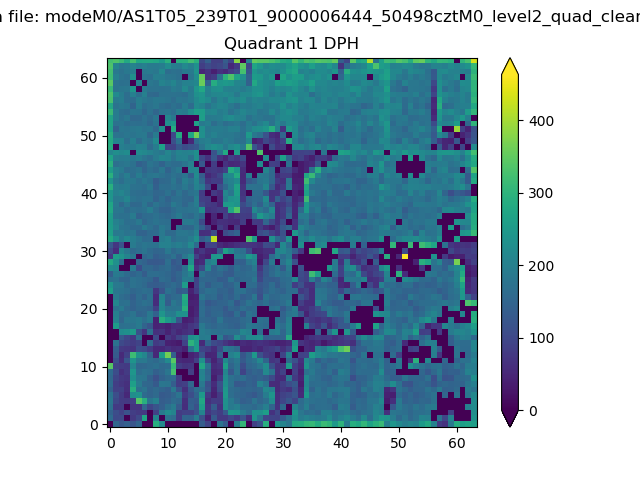 |
Quadrant B |
|---|---|---|---|
| Quadrant D | 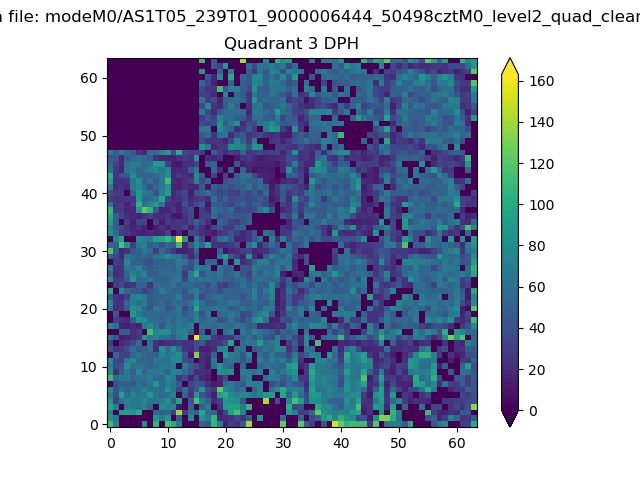 |
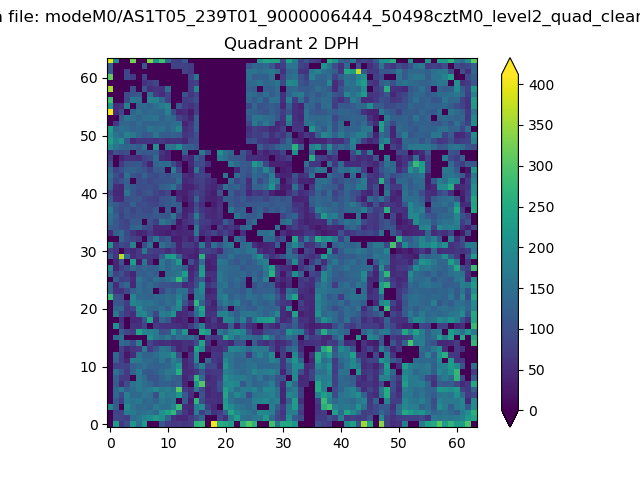 |
Quadrant C |
| Plot type | Count rate plots | Images |
|---|---|---|
| Comparison with Poisson distribution Blue bars denote a histogram of data divided into 1 sec bins. Red curve is a Poisson curve with rate = median count rate of data. |
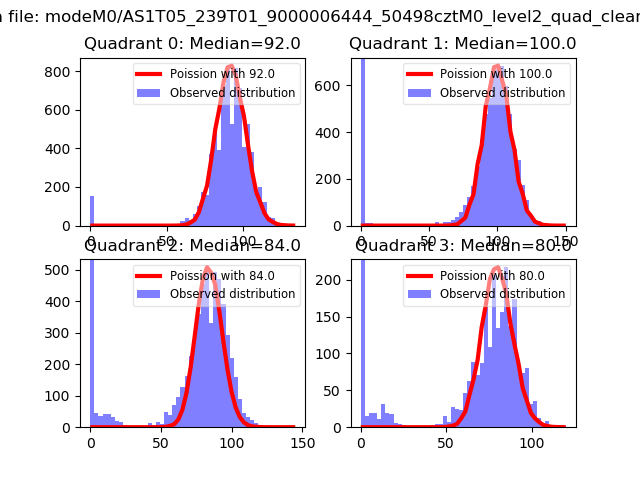 |
 |
| Quadrant-wise count rates Data is divided into 100 sec bins |
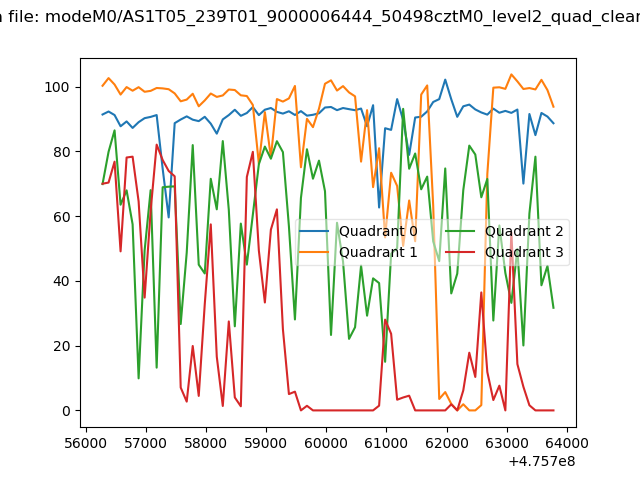 |
|
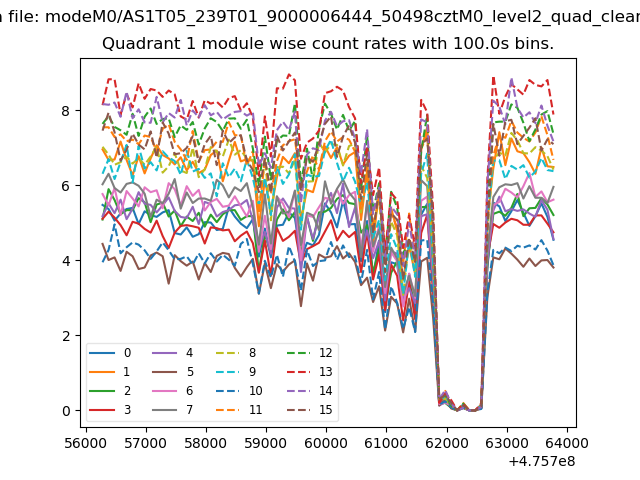
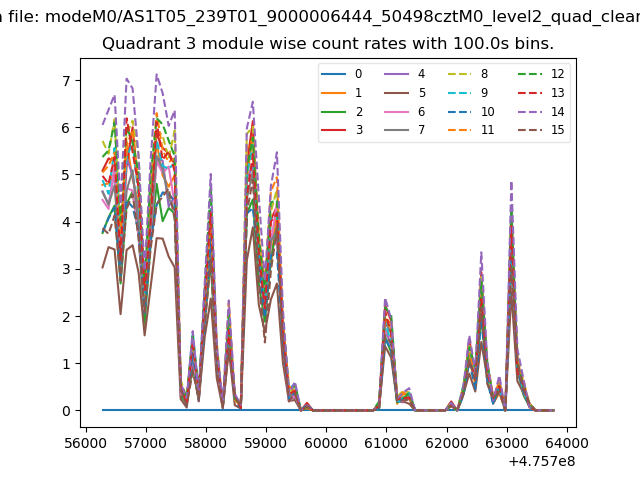
| Module-wise count rates for Quadrant A Data is divided into 100 sec bins |
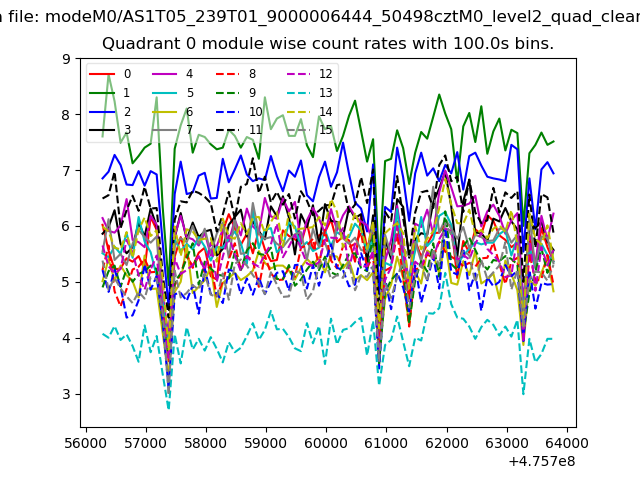 |
 |
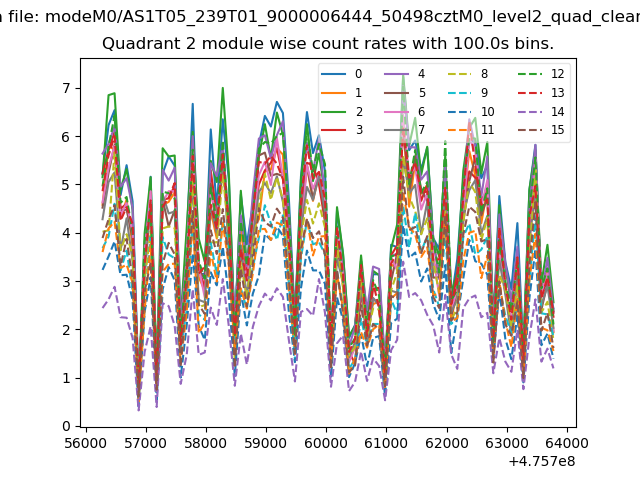
| Module-wise count rates for Quadrant B Data is divided into 100 sec bins |
 |
 |
| Module-wise count rates for Quadrant C Data is divided into 100 sec bins |
 |
 |
| Module-wise count rates for Quadrant D Data is divided into 100 sec bins |
 |
 |
| Parameter | Plot |
|---|---|
| CZT HV Monitor | 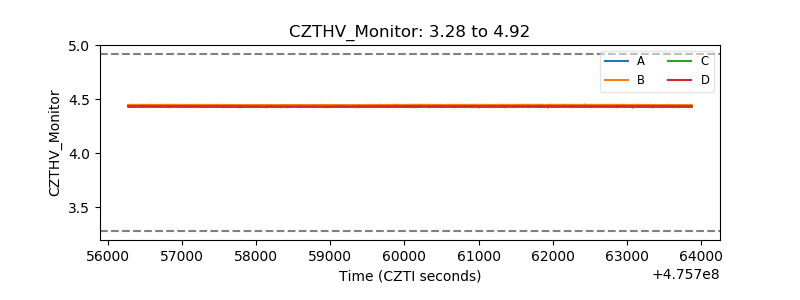 |
| D_VDD | 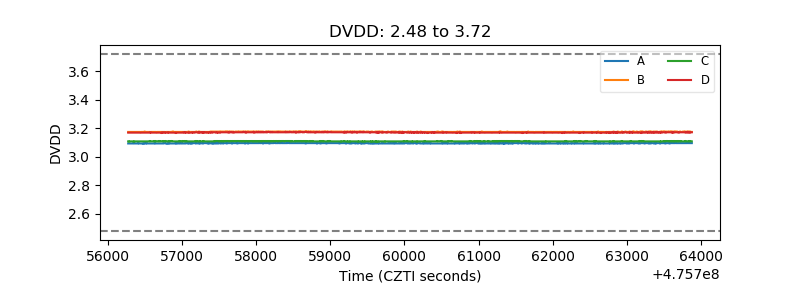 |
| Temperature 1 | 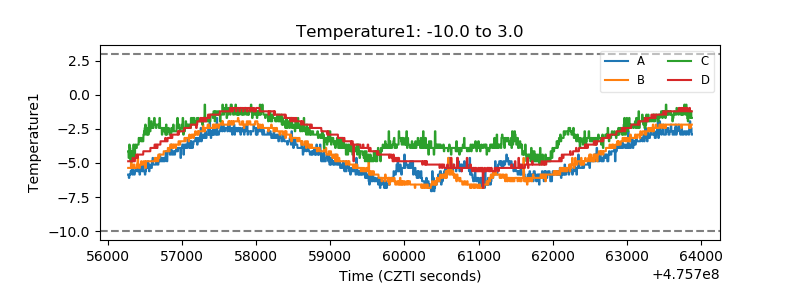 |
| Veto HV Monitor | 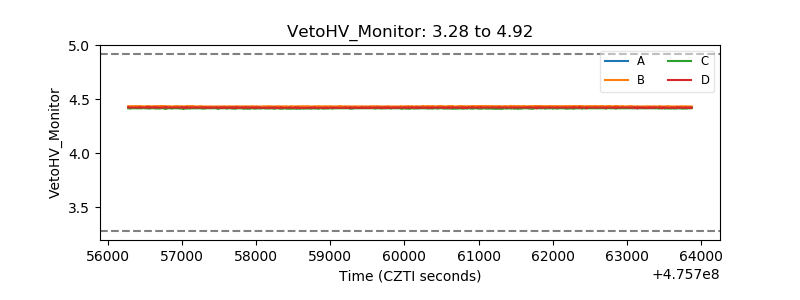 |
| Veto LLD | 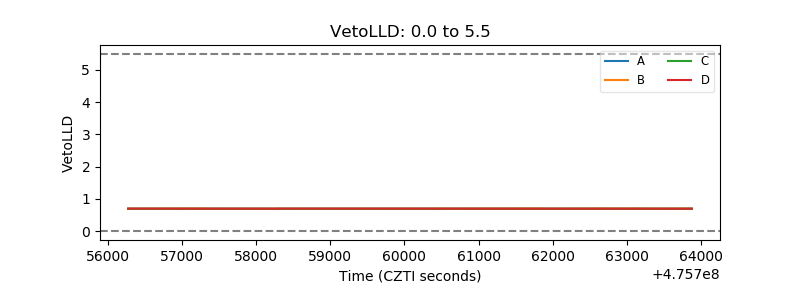 |
| Alpha Counter | 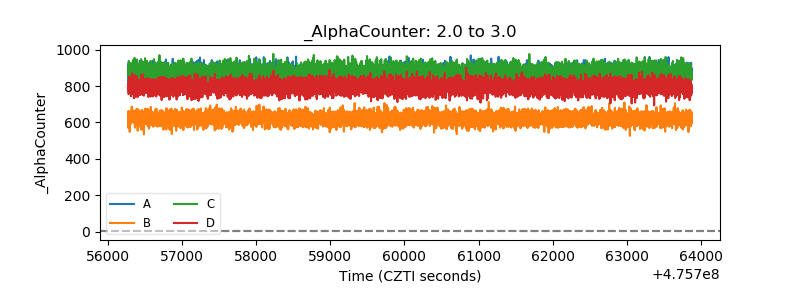 |
| _CPM_Rate | 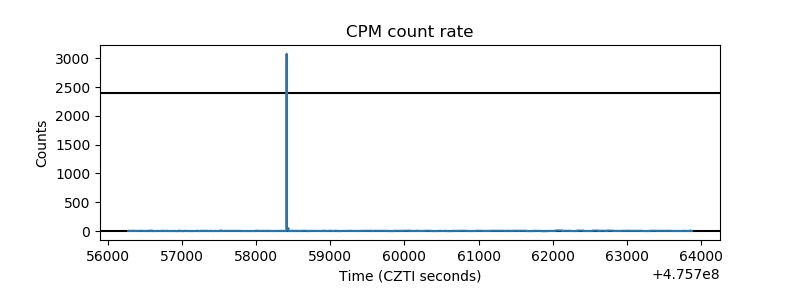 |
| CZT Counter | 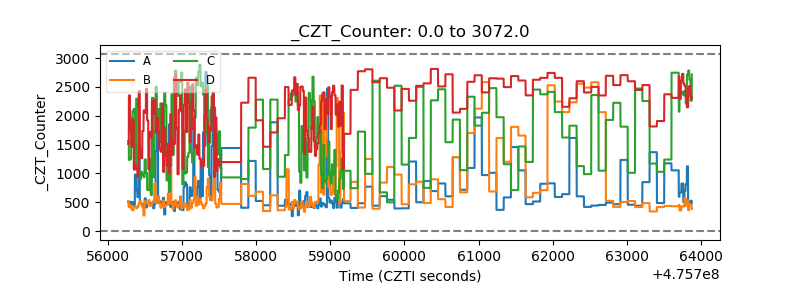 |
| +2.5 Volts monitor | 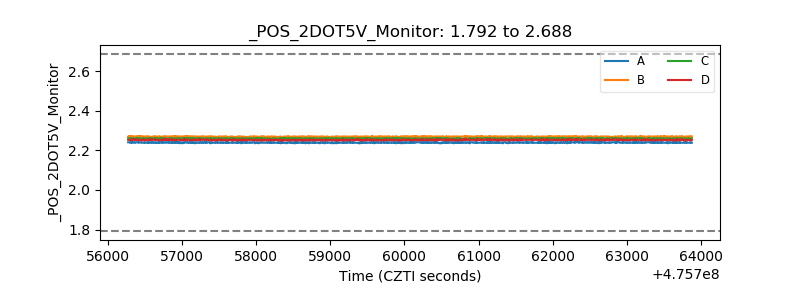 |
| +5 Volts monitor |  |
| _ROLL_ROT | 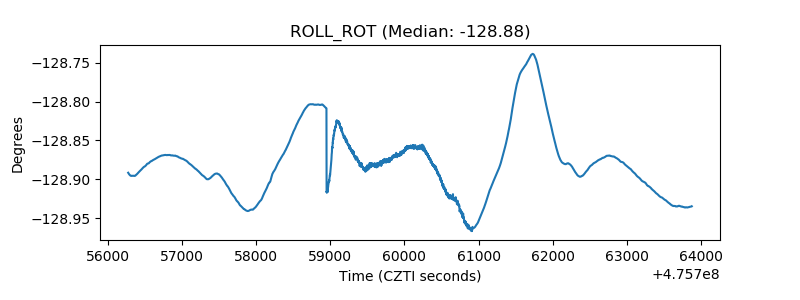 |
| _Roll_DEC | 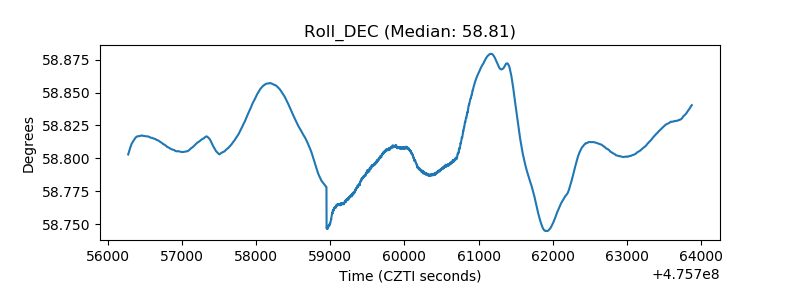 |
| _Roll_RA | 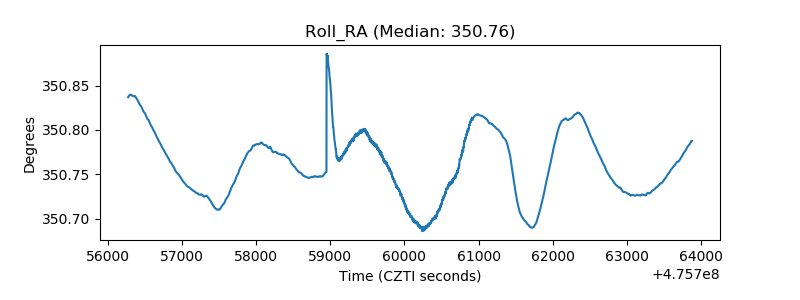 |
| Veto Counter | 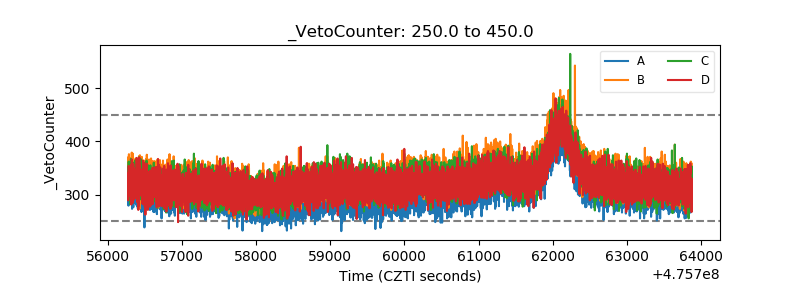 |