| Param | Original file | Final file |
|---|---|---|
| Filename | modeM0/AS1T05_239T01_9000006444_50502cztM0_level2.fits | modeM0/AS1T05_239T01_9000006444_50502cztM0_level2_quad_clean.evt |
| Size (bytes) | 2,500,960,320 | 203,097,600 |
| Size | 2.3 GB | 193.7 MB |
| Events in quadrant A | 14,974,323 | 1,580,454 |
| Events in quadrant B | 10,095,773 | 1,785,656 |
| Events in quadrant C | 28,830,596 | 995,590 |
| Events in quadrant D | 37,264,182 | 522,762 |
| Mode M0 | |||
|---|---|---|---|
| Quadrant | BADHDUFLAG | Total packets | Discarded packets |
| A | 0 | 56908 | 3 |
| B | 0 | 42875 | 3 |
| C | 0 | 98430 | 3 |
| D | 0 | 123374 | 5 |
| Mode M9 | |||
|---|---|---|---|
| Quadrant | BADHDUFLAG | Total packets | Discarded packets |
| A | 0 | 17 | 0 |
| B | 0 | 17 | 0 |
| C | 0 | 17 | 0 |
| D | 0 | 17 | 0 |
| Mode SS | |||
|---|---|---|---|
| Quadrant | BADHDUFLAG | Total packets | Discarded packets |
| A | 0 | 370 | 0 |
| B | 0 | 370 | 0 |
| C | 0 | 370 | 0 |
| D | 0 | 370 | 0 |
| Quadrant | Total seconds | Saturated seconds | Saturation percentage |
|---|---|---|---|
| A | 18347 | 1409 | 7.679730% |
| B | 18348 | 616 | 3.357314% |
| C | 18348 | 7533 | 41.056246% |
| D | 18347 | 12667 | 69.041260% |
Noise dominated data is calculated using 1-second bins in cleaned event files. If a bin has >2000 counts, and if more than 50% of those come from <1% of pixels, then it is considered to be noise-dominated and hence unusable.
| Quadrant | # 1 sec bins | Bins with >0 counts | Bins with >2000 counts | High rate bins dominated by noise | Noise dominated (total time) | Noise dominated (detector-on time) | Marked lightcurve |
|---|---|---|---|---|---|---|---|
| A | 19907 | 18349 | 1193 | 1193 | 5.99% | 6.50% | 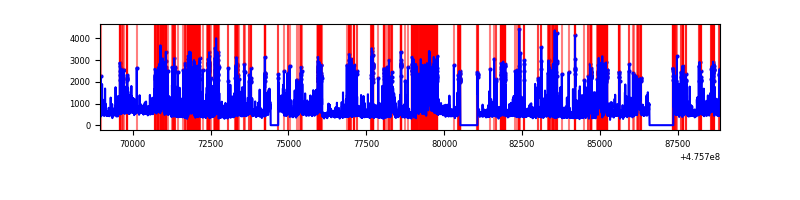 |
| B | 19908 | 18350 | 474 | 474 | 2.38% | 2.58% | 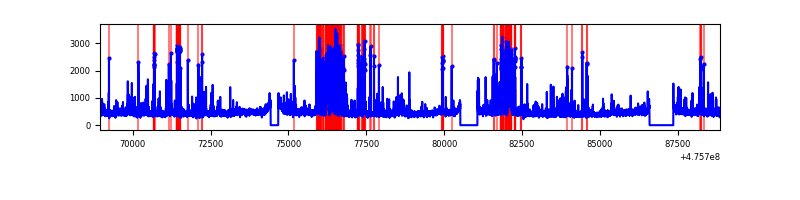 |
| C | 19908 | 18348 | 7086 | 7086 | 35.59% | 38.62% | 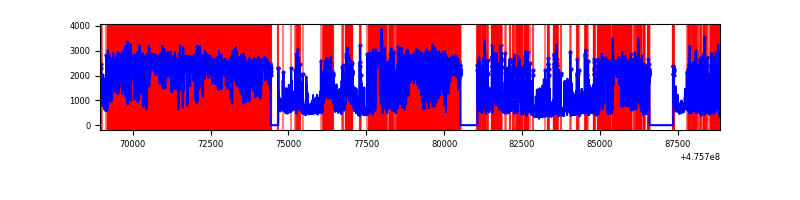 |
| D | 19907 | 18347 | 11427 | 11427 | 57.40% | 62.28% | 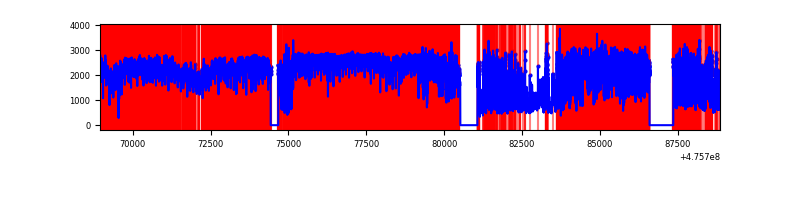 |
Top three noisy pixels from each quadrant. If the there are fewer than three noisy pixels in the level2.evt file, extra rows are filled as -1
| Pixel properties | Quadrant properties | ||||||
|---|---|---|---|---|---|---|---|
| Quadrant | DetID | PixID | Counts | Sigma | Mean | Median | Sigma |
| A | 10 | 253 | 3189568 | 6721.89 | 1908 | 1860 | 474.2 |
| A | 3 | 130 | 1178365 | 2480.88 | 1908 | 1860 | 474.2 |
| A | 12 | 250 | 751109 | 1579.93 | 1908 | 1860 | 474.2 |
| B | 7 | 0 | 1368336 | 3299.5 | 1930 | 1860 | 414.1 |
| B | 4 | 170 | 166291 | 397.03 | 1930 | 1860 | 414.1 |
| B | 10 | 247 | 120733 | 287.03 | 1930 | 1860 | 414.1 |
| C | 15 | 236 | 6432682 | 15199.12 | 1528 | 1516 | 423.1 |
| C | 15 | 235 | 4808847 | 11361.42 | 1528 | 1516 | 423.1 |
| C | 12 | 247 | 2540466 | 6000.44 | 1528 | 1516 | 423.1 |
| D | 7 | 61 | 12248559 | 43707.06 | 1007 | 971 | 280.2 |
| D | 8 | 48 | 8121416 | 28978.83 | 1007 | 971 | 280.2 |
| D | 15 | 184 | 7810818 | 27870.42 | 1007 | 971 | 280.2 |
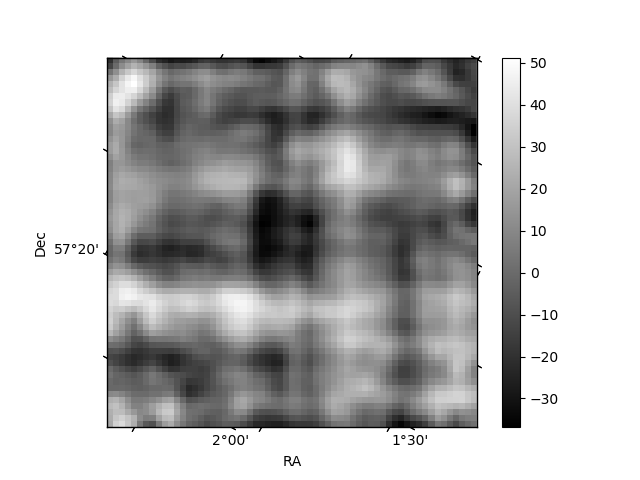
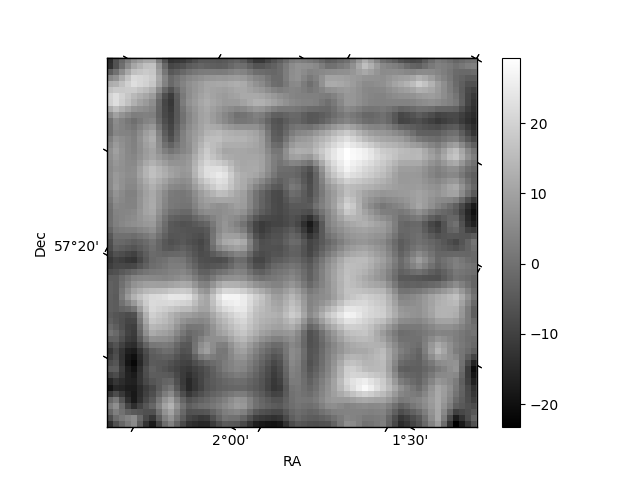
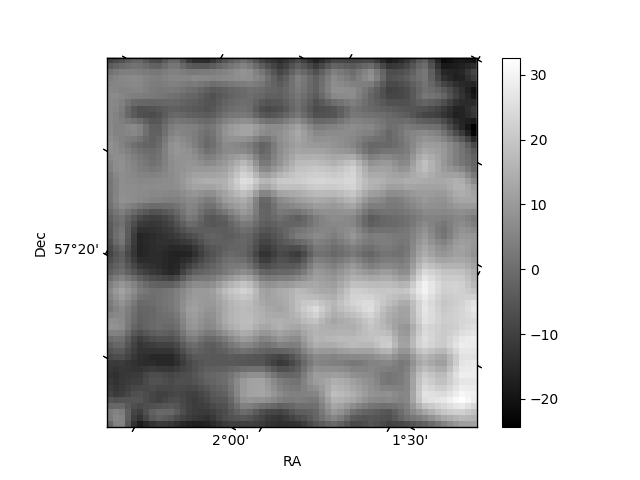
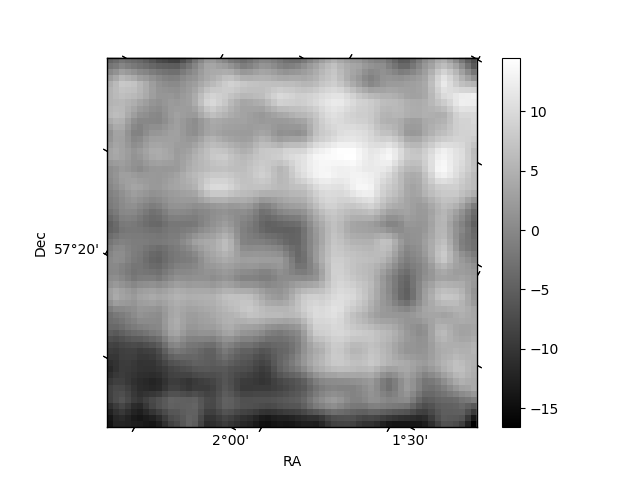
Histogram calculated using DETX and DETY for each event in the final _common_clean file
| Quadrant A | 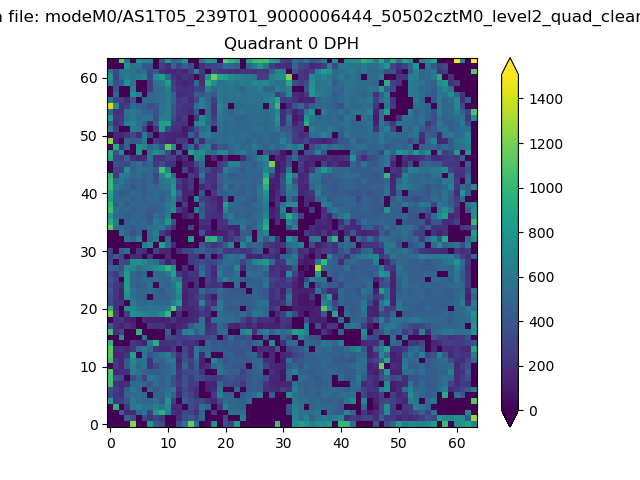 |
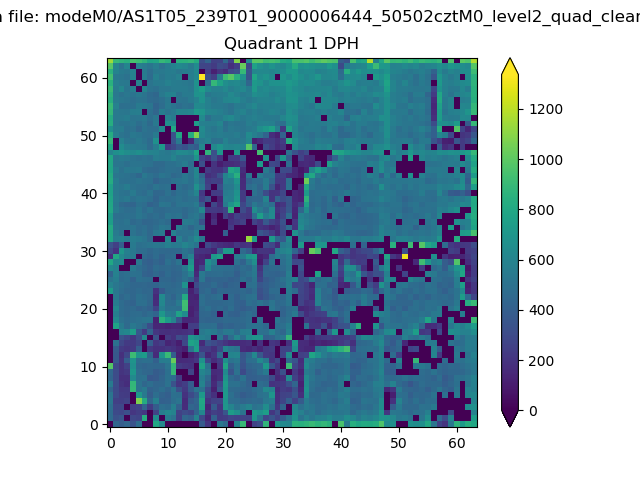 |
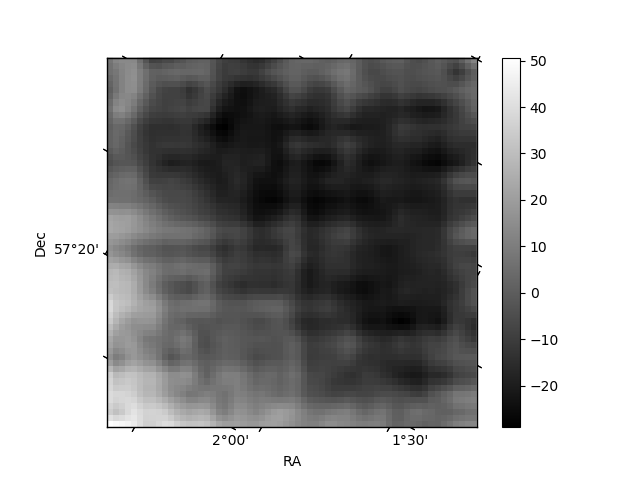
Quadrant B |
|---|---|---|---|
| Quadrant D | 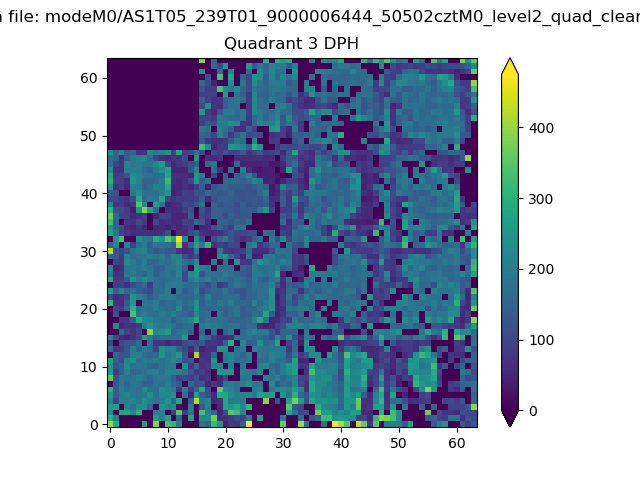 |
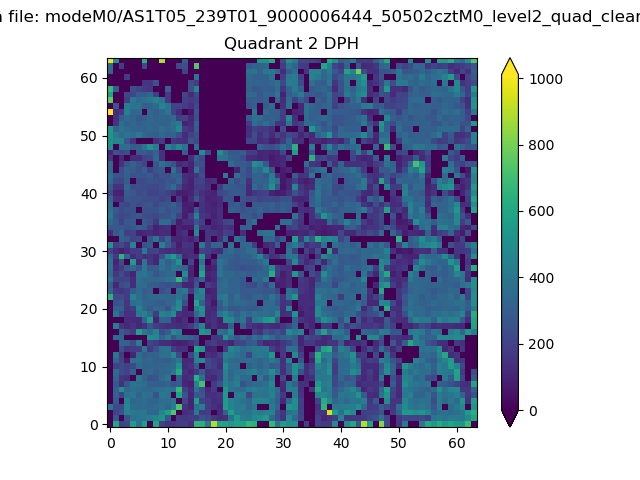 |
Quadrant C |
| Plot type | Count rate plots | Images |
|---|---|---|
| Comparison with Poisson distribution Blue bars denote a histogram of data divided into 1 sec bins. Red curve is a Poisson curve with rate = median count rate of data. |
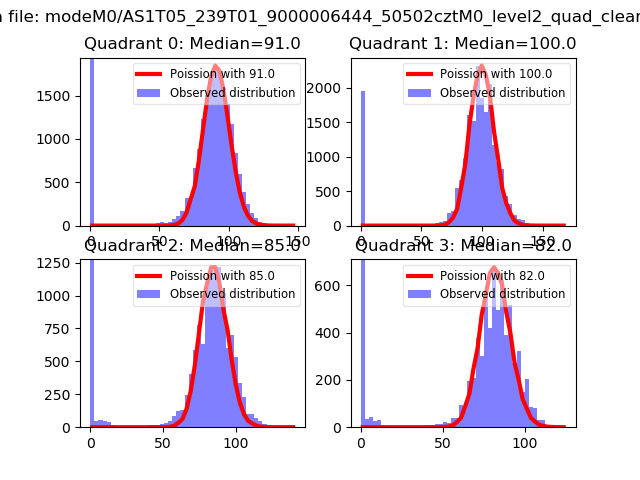 |
 |
| Quadrant-wise count rates Data is divided into 100 sec bins |
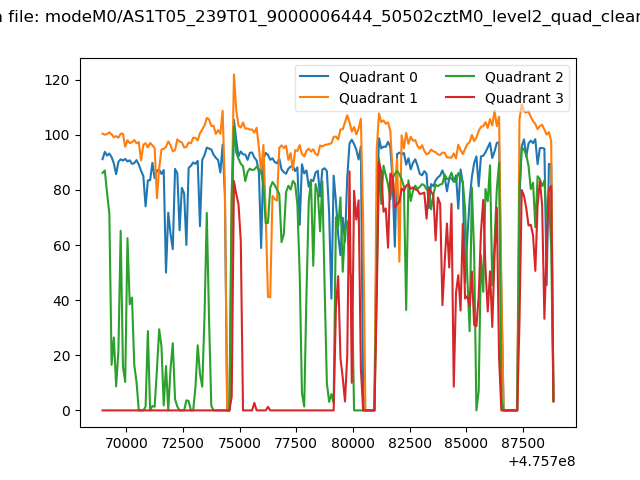 |
|
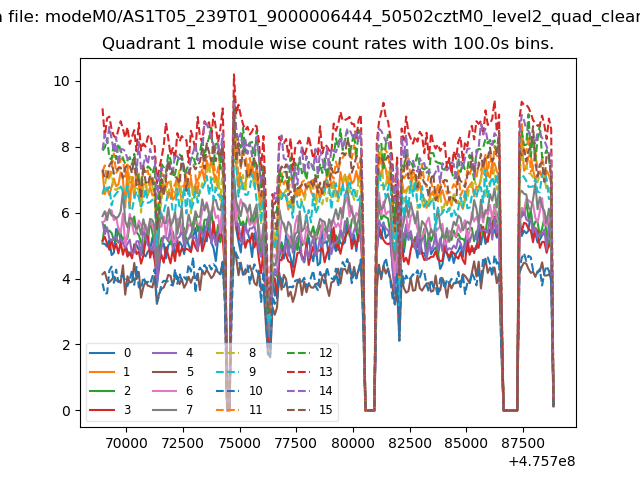
| Module-wise count rates for Quadrant A Data is divided into 100 sec bins |
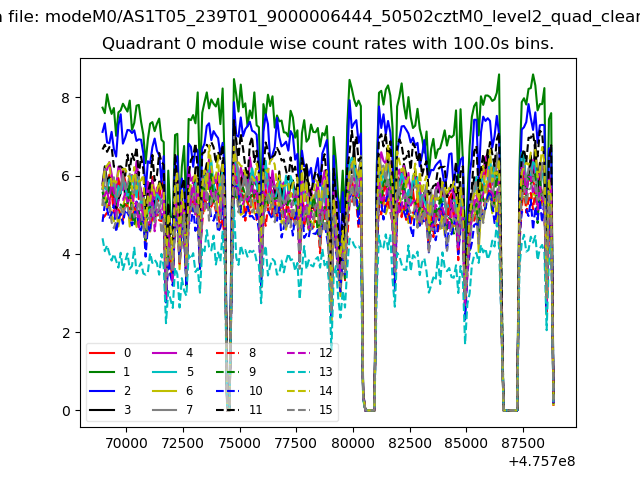 |
 |
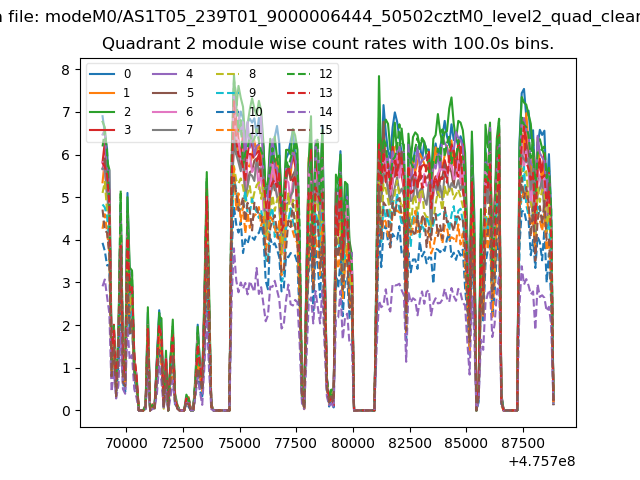
| Module-wise count rates for Quadrant B Data is divided into 100 sec bins |
 |
 |
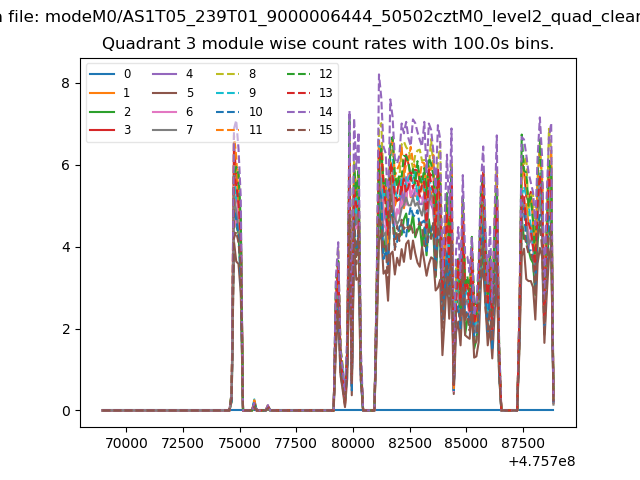
| Module-wise count rates for Quadrant C Data is divided into 100 sec bins |
 |
 |
| Module-wise count rates for Quadrant D Data is divided into 100 sec bins |
 |
 |
| Parameter | Plot |
|---|---|
| CZT HV Monitor | 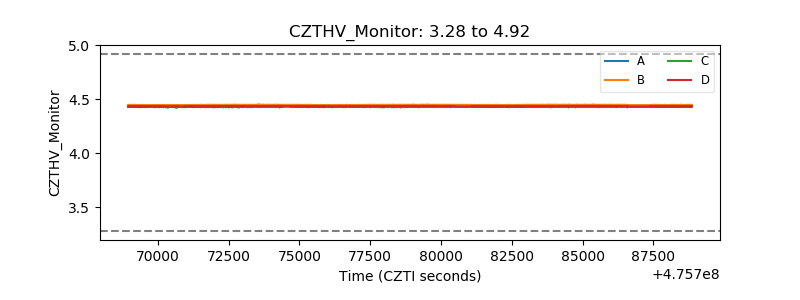 |
| D_VDD | 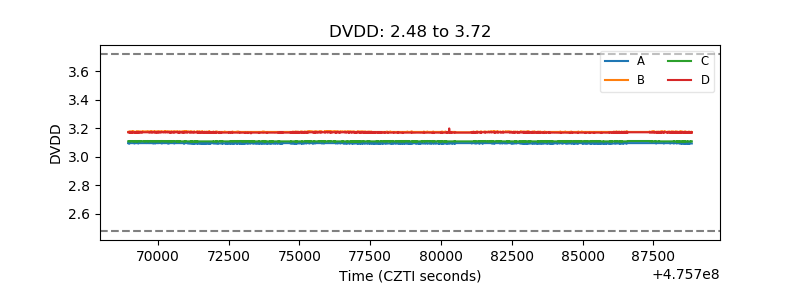 |
| Temperature 1 | 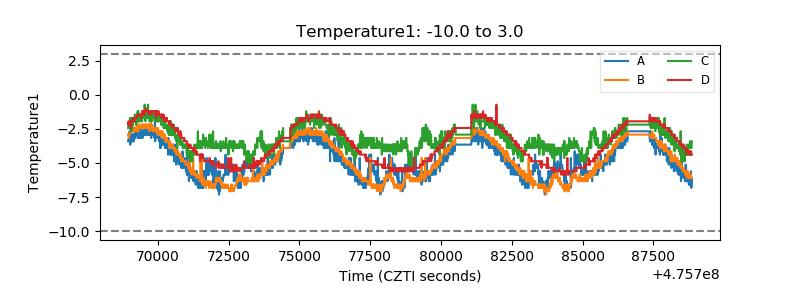 |
| Veto HV Monitor |  |
| Veto LLD | 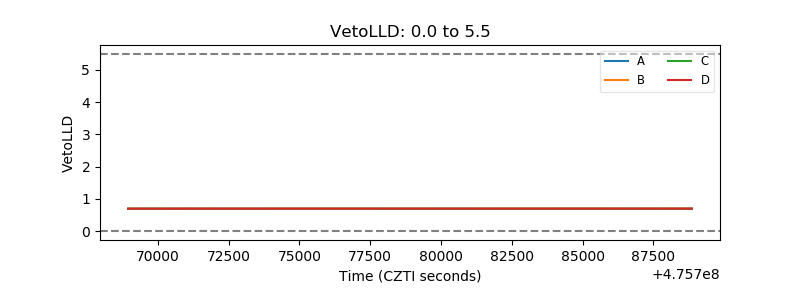 |
| Alpha Counter | 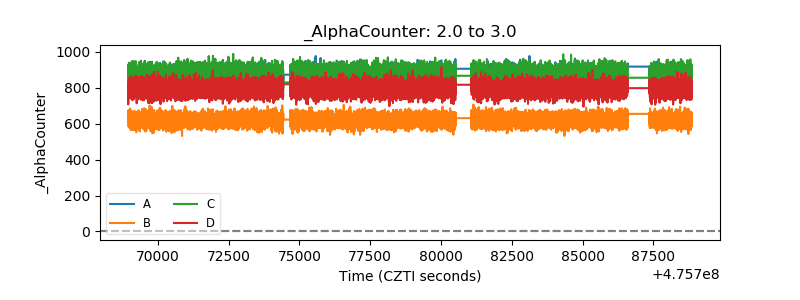 |
| _CPM_Rate | 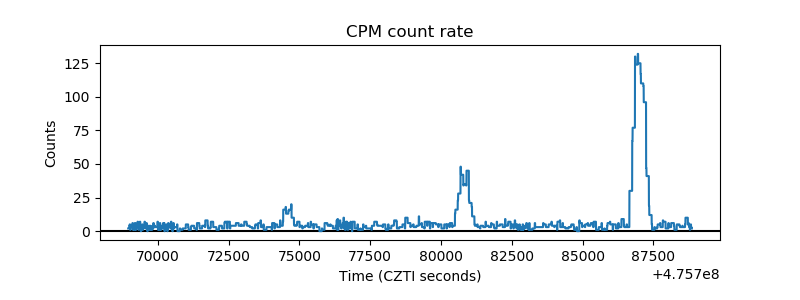 |
| CZT Counter | 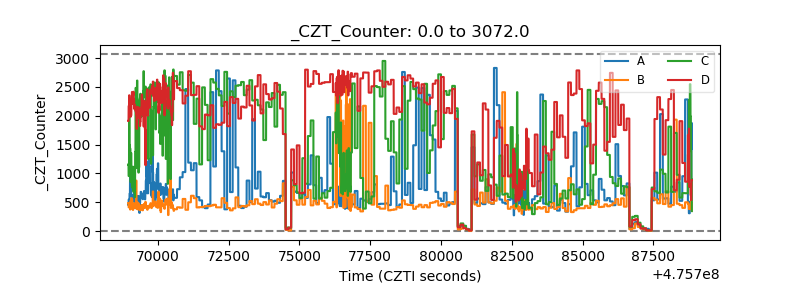 |
| +2.5 Volts monitor | 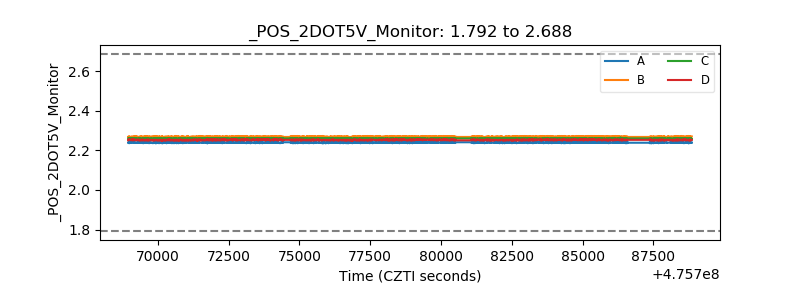 |
| +5 Volts monitor |  |
| _ROLL_ROT | 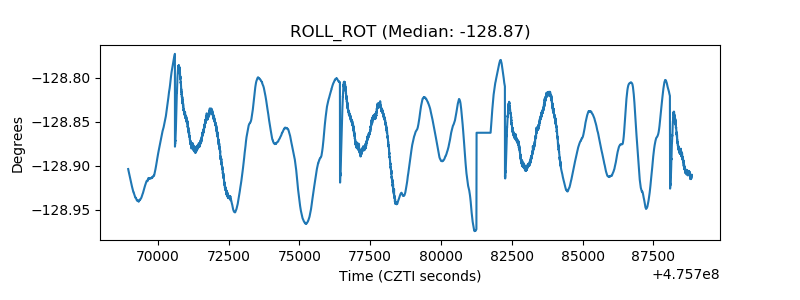 |
| _Roll_DEC | 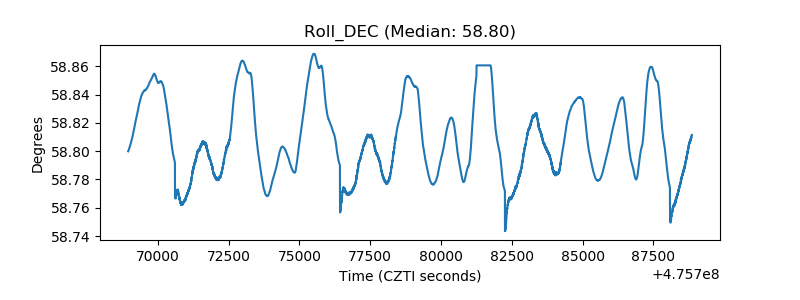 |
| _Roll_RA | 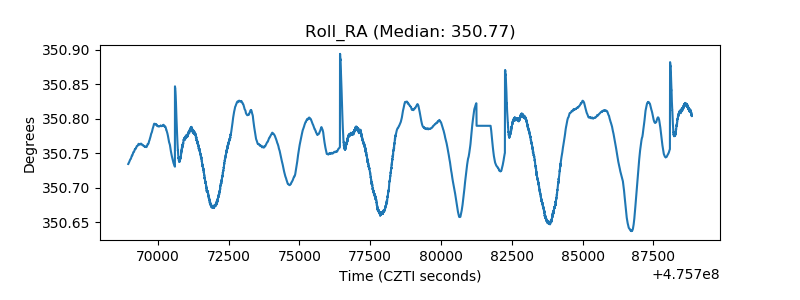 |
| Veto Counter | 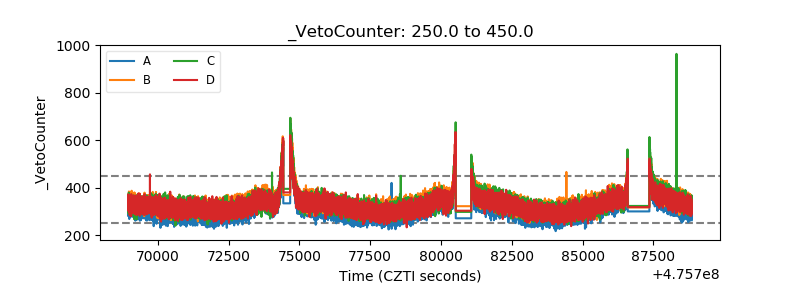 |