| Param | Original file | Final file |
|---|---|---|
| Filename | modeM0/AS1T05_239T01_9000006444_50503cztM0_level2.fits | modeM0/AS1T05_239T01_9000006444_50503cztM0_level2_quad_clean.evt |
| Size (bytes) | 669,332,160 | 89,236,800 |
| Size | 638.3 MB | 85.1 MB |
| Events in quadrant A | 5,718,451 | 568,935 |
| Events in quadrant B | 3,240,209 | 665,683 |
| Events in quadrant C | 7,907,423 | 497,304 |
| Events in quadrant D | 7,403,498 | 512,750 |
| Mode M0 | |||
|---|---|---|---|
| Quadrant | BADHDUFLAG | Total packets | Discarded packets |
| A | 0 | 21390 | 1 |
| B | 0 | 14220 | 1 |
| C | 0 | 28047 | 1 |
| D | 0 | 26615 | 1 |
| Mode M9 | |||
|---|---|---|---|
| Quadrant | BADHDUFLAG | Total packets | Discarded packets |
| A | 0 | 10 | 0 |
| B | 0 | 10 | 0 |
| C | 0 | 10 | 0 |
| D | 0 | 10 | 0 |
| Mode SS | |||
|---|---|---|---|
| Quadrant | BADHDUFLAG | Total packets | Discarded packets |
| A | 0 | 132 | 0 |
| B | 0 | 132 | 0 |
| C | 0 | 132 | 0 |
| D | 0 | 132 | 0 |
| Quadrant | Total seconds | Saturated seconds | Saturation percentage |
|---|---|---|---|
| A | 6556 | 656 | 10.006101% |
| B | 6556 | 65 | 0.991458% |
| C | 6556 | 1236 | 18.852959% |
| D | 6556 | 692 | 10.555217% |
Noise dominated data is calculated using 1-second bins in cleaned event files. If a bin has >2000 counts, and if more than 50% of those come from <1% of pixels, then it is considered to be noise-dominated and hence unusable.
| Quadrant | # 1 sec bins | Bins with >0 counts | Bins with >2000 counts | High rate bins dominated by noise | Noise dominated (total time) | Noise dominated (detector-on time) | Marked lightcurve |
|---|---|---|---|---|---|---|---|
| A | 7486 | 6557 | 596 | 596 | 7.96% | 9.09% | 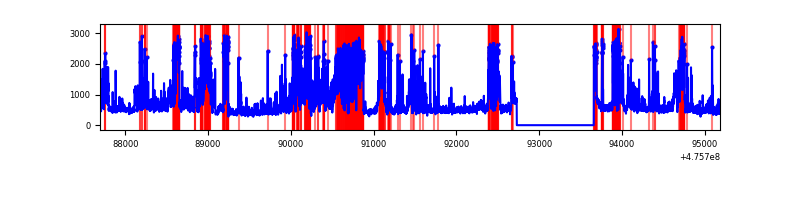 |
| B | 7486 | 6556 | 33 | 33 | 0.44% | 0.50% | 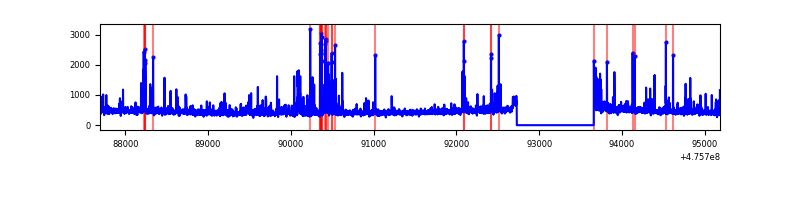 |
| C | 7485 | 6556 | 1157 | 1157 | 15.46% | 17.65% | 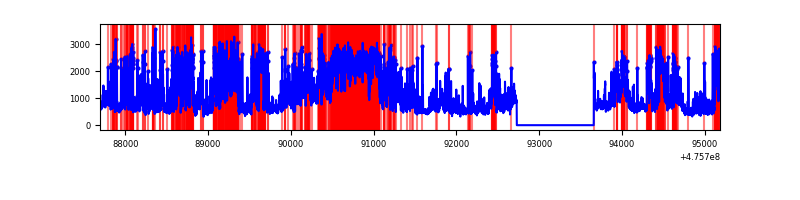 |
| D | 7486 | 6557 | 714 | 714 | 9.54% | 10.89% | 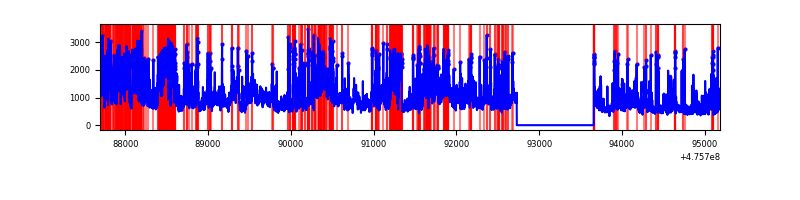 |
Top three noisy pixels from each quadrant. If the there are fewer than three noisy pixels in the level2.evt file, extra rows are filled as -1
| Pixel properties | Quadrant properties | ||||||
|---|---|---|---|---|---|---|---|
| Quadrant | DetID | PixID | Counts | Sigma | Mean | Median | Sigma |
| A | 10 | 253 | 1487297 | 8850.91 | 675 | 658 | 168.0 |
| A | 12 | 250 | 718501 | 4273.78 | 675 | 658 | 168.0 |
| A | 4 | 3 | 159508 | 945.74 | 675 | 658 | 168.0 |
| B | 8 | 128 | 90567 | 605.35 | 694 | 671 | 148.5 |
| B | 7 | 0 | 55619 | 370.01 | 694 | 671 | 148.5 |
| B | 7 | 252 | 44329 | 293.99 | 694 | 671 | 148.5 |
| C | 15 | 235 | 1155755 | 6564.08 | 642 | 639 | 176.0 |
| C | 15 | 213 | 949576 | 5392.44 | 642 | 639 | 176.0 |
| C | 12 | 247 | 655796 | 3723.0 | 642 | 639 | 176.0 |
| D | 7 | 61 | 1303939 | 7161.12 | 654 | 633 | 182.0 |
| D | 8 | 48 | 948972 | 5210.73 | 654 | 633 | 182.0 |
| D | 6 | 42 | 538644 | 2956.15 | 654 | 633 | 182.0 |
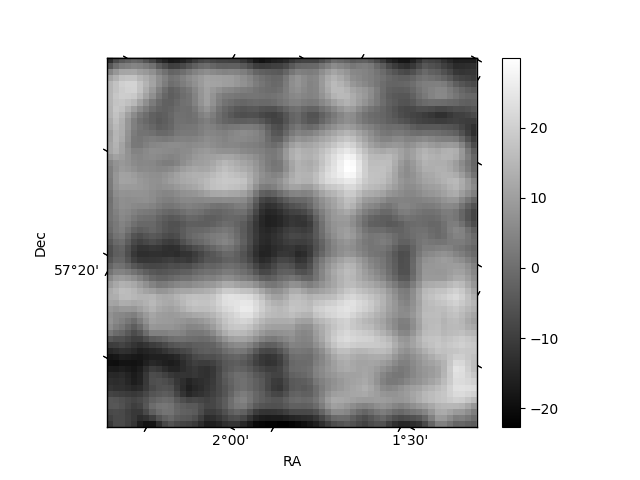
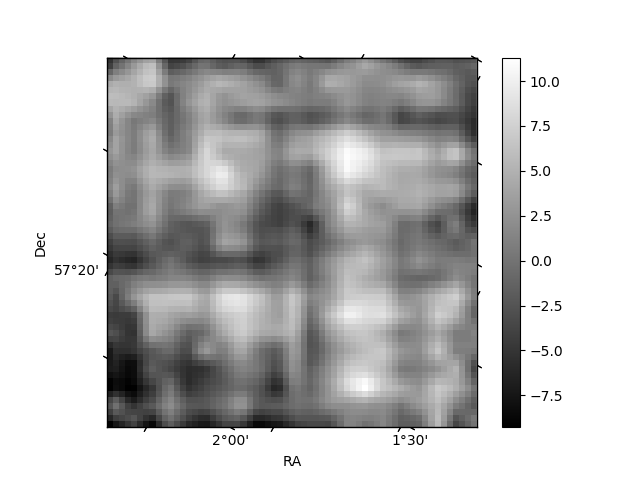
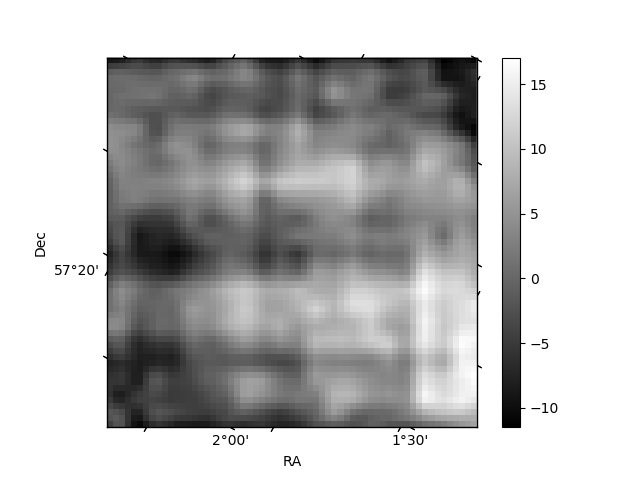
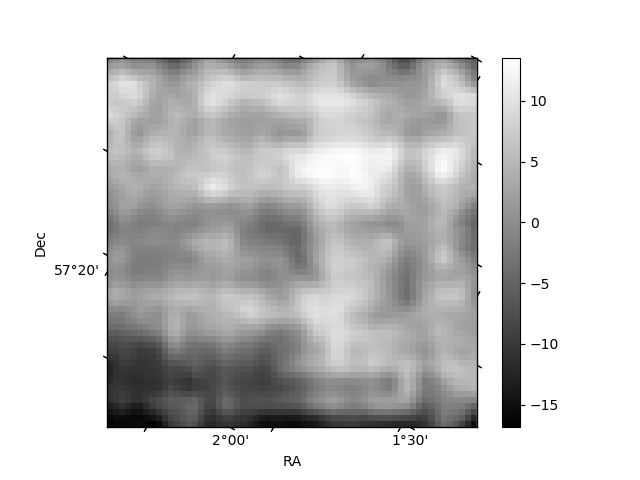
Histogram calculated using DETX and DETY for each event in the final _common_clean file
| Quadrant A | 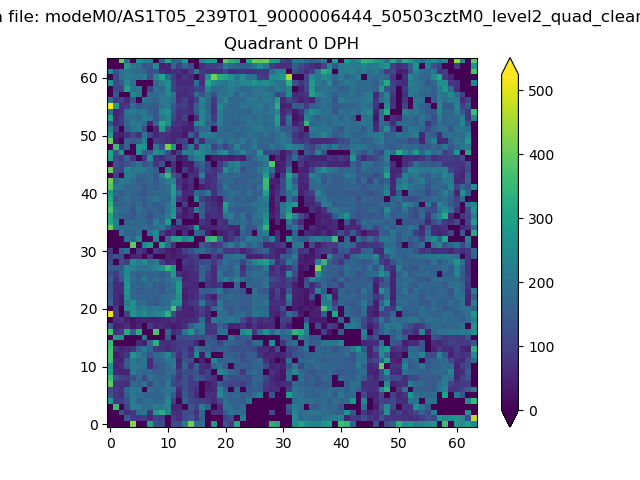 |
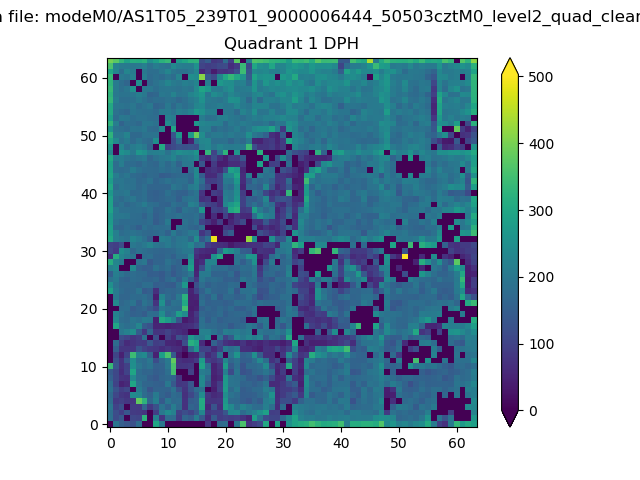 |
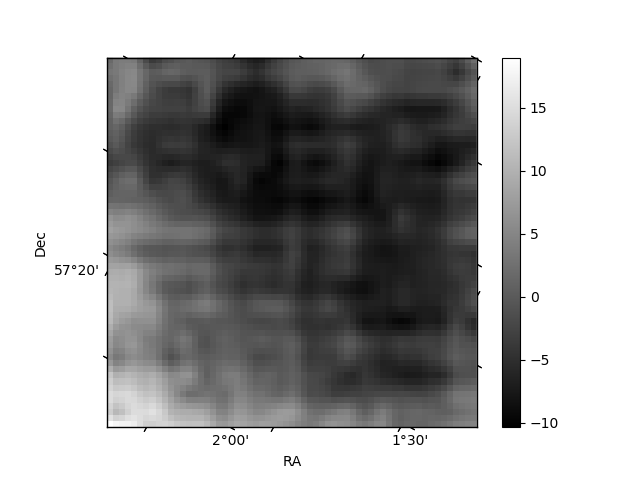
Quadrant B |
|---|---|---|---|
| Quadrant D | 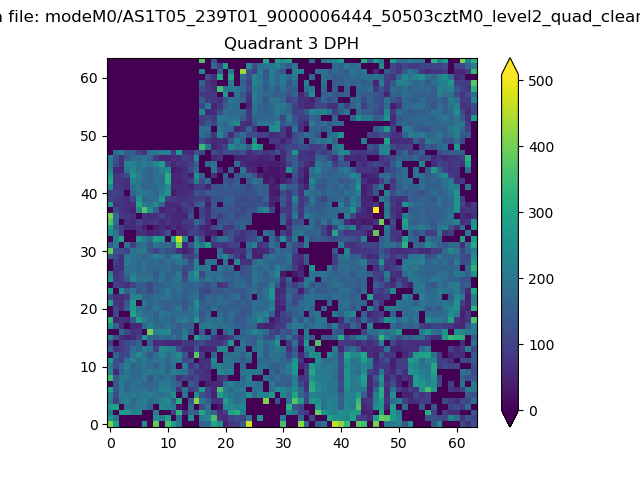 |
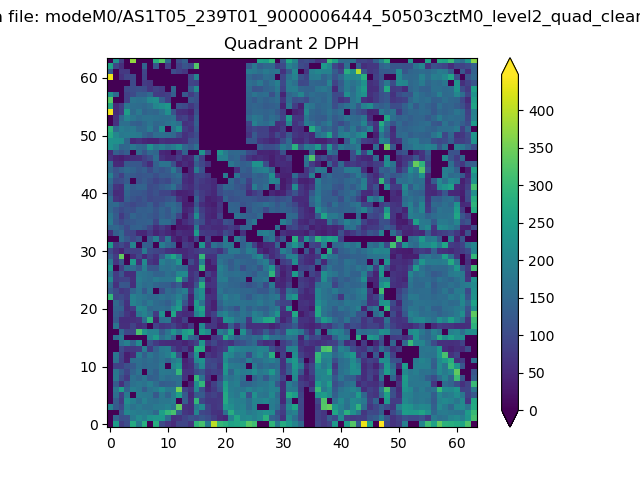 |
Quadrant C |
| Plot type | Count rate plots | Images |
|---|---|---|
| Comparison with Poisson distribution Blue bars denote a histogram of data divided into 1 sec bins. Red curve is a Poisson curve with rate = median count rate of data. |
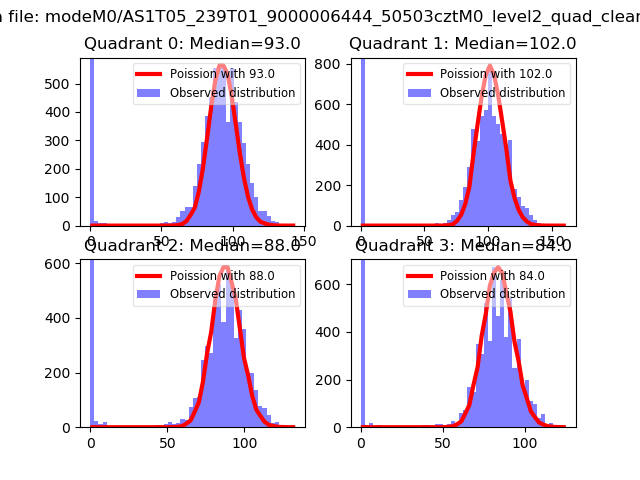 |
 |
| Quadrant-wise count rates Data is divided into 100 sec bins |
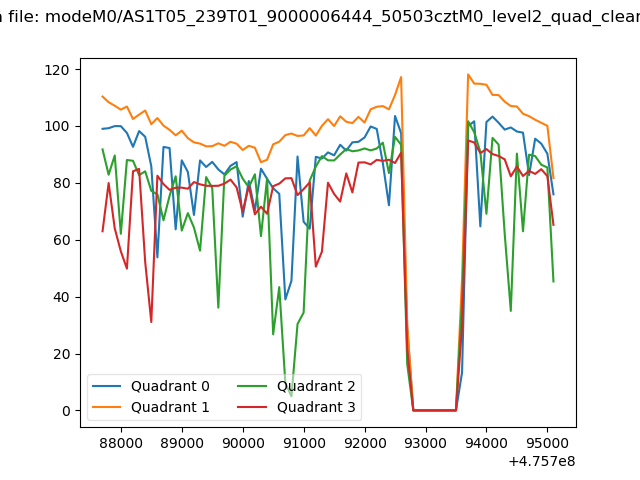 |
|
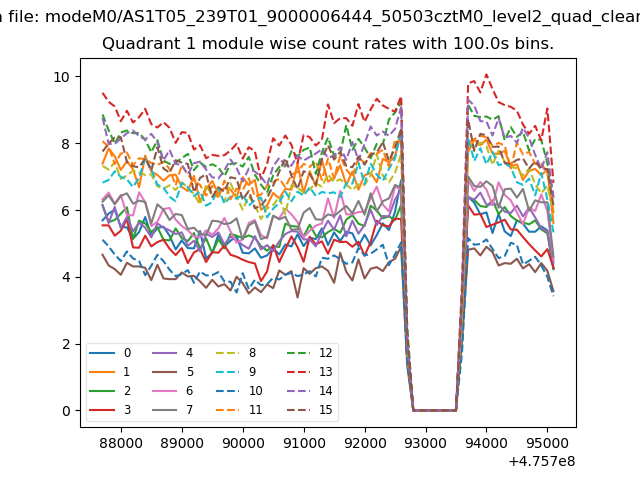
| Module-wise count rates for Quadrant A Data is divided into 100 sec bins |
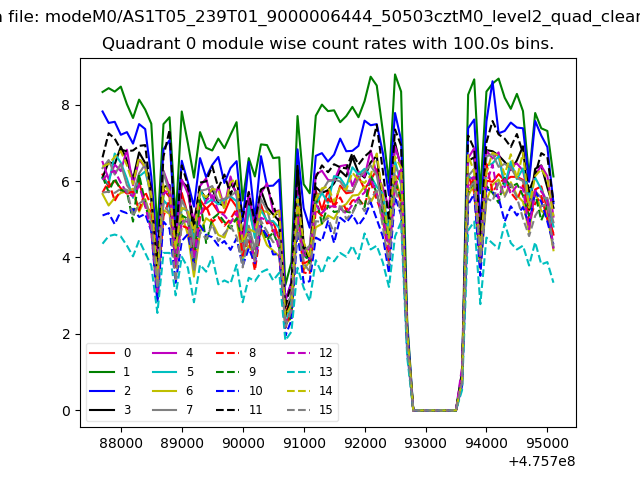 |
 |
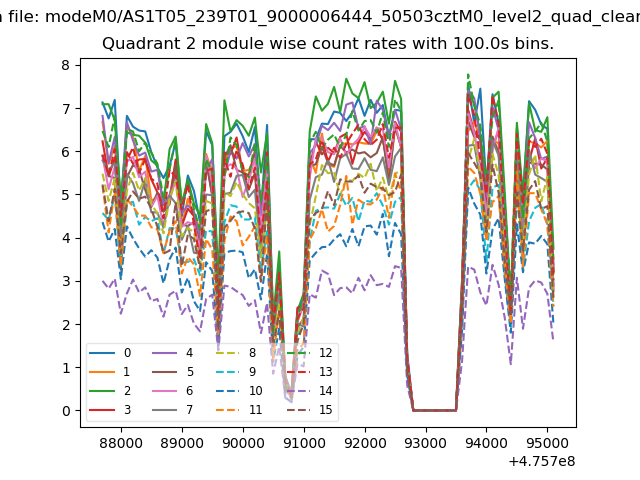
| Module-wise count rates for Quadrant B Data is divided into 100 sec bins |
 |
 |
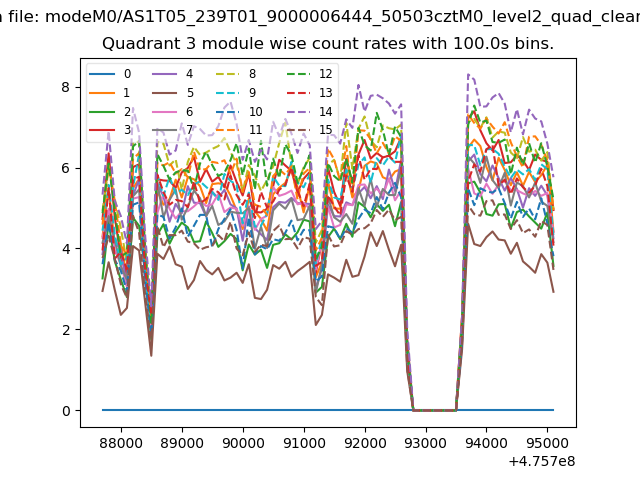
| Module-wise count rates for Quadrant C Data is divided into 100 sec bins |
 |
 |
| Module-wise count rates for Quadrant D Data is divided into 100 sec bins |
 |
 |
| Parameter | Plot |
|---|---|
| CZT HV Monitor | 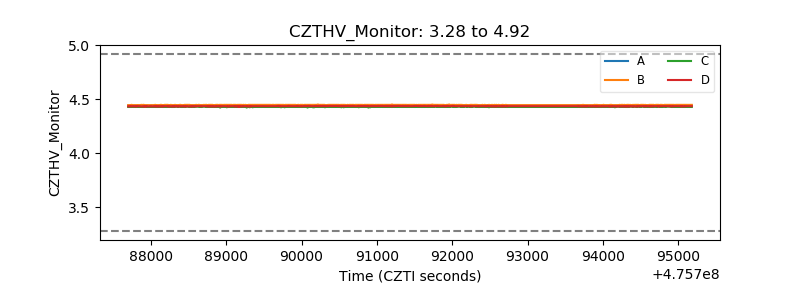 |
| D_VDD | 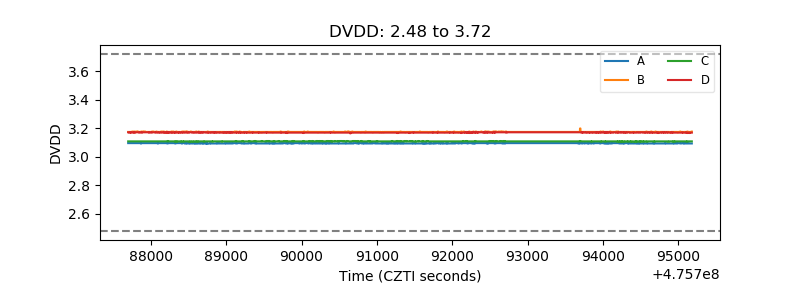 |
| Temperature 1 | 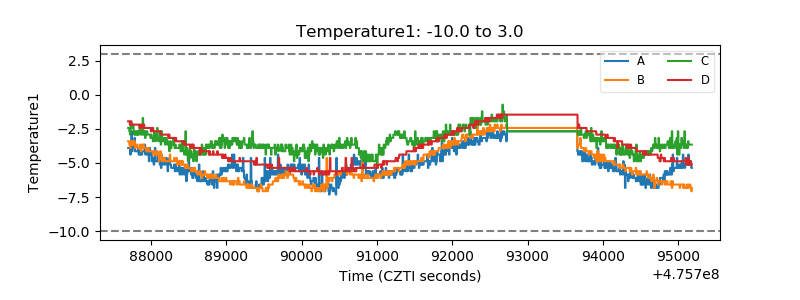 |
| Veto HV Monitor |  |
| Veto LLD | 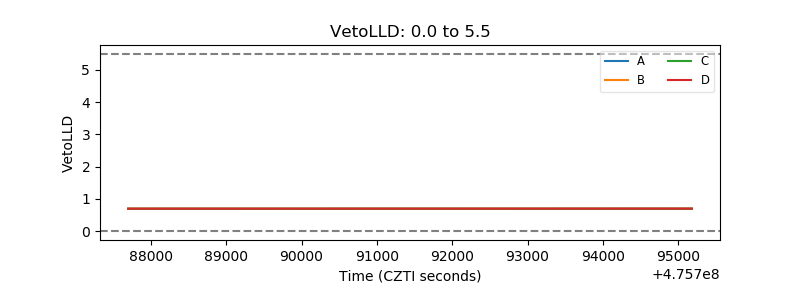 |
| Alpha Counter | 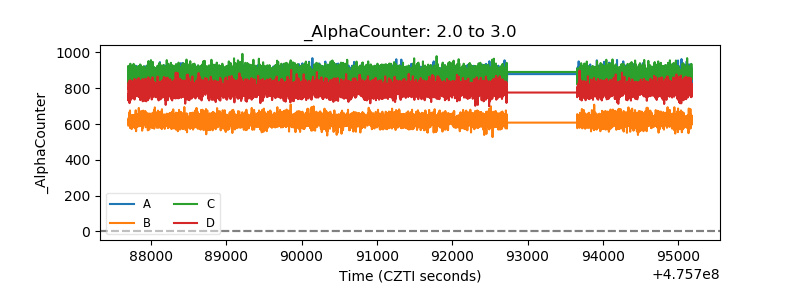 |
| _CPM_Rate | 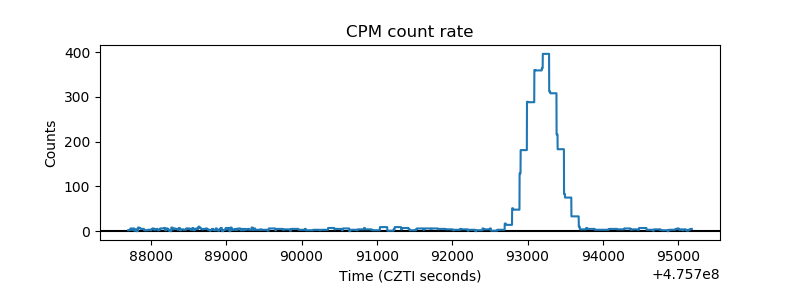 |
| CZT Counter | 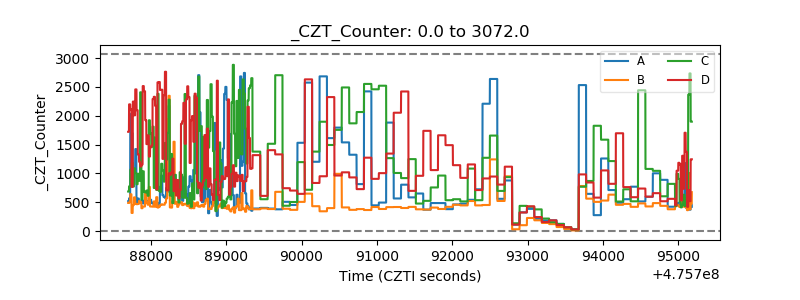 |
| +2.5 Volts monitor | 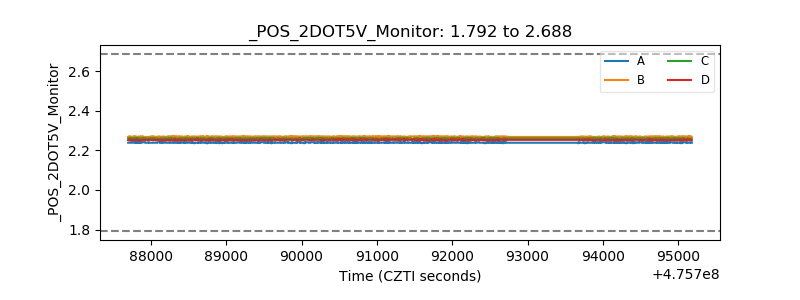 |
| +5 Volts monitor | 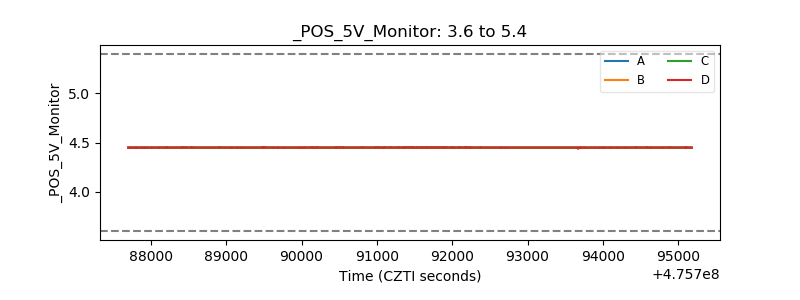 |
| _ROLL_ROT | 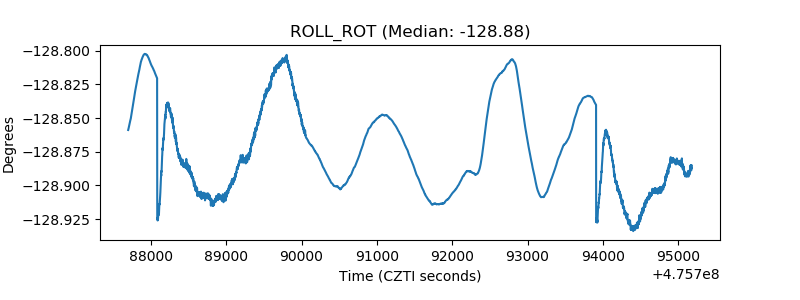 |
| _Roll_DEC | 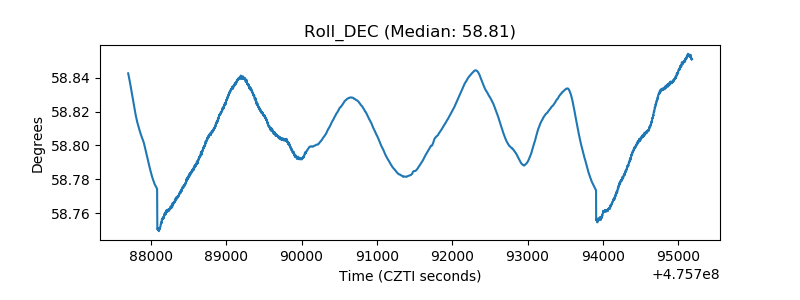 |
| _Roll_RA | 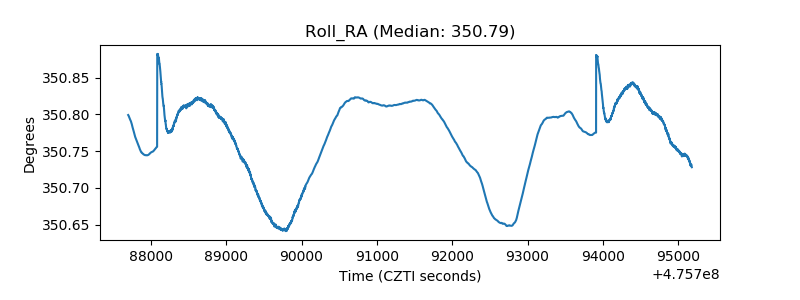 |
| Veto Counter | 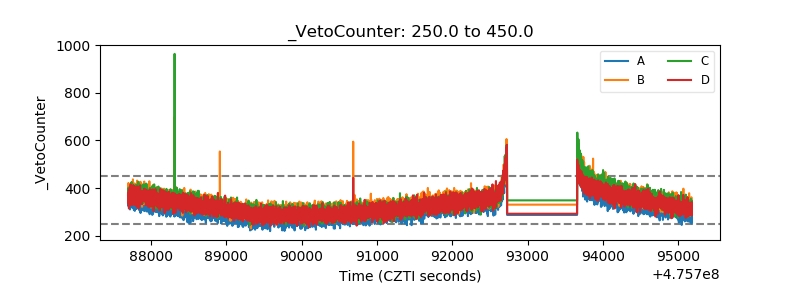 |