| Param | Original file | Final file |
|---|---|---|
| Filename | modeM0/AS1T05_239T01_9000006444_50505cztM0_level2.fits | modeM0/AS1T05_239T01_9000006444_50505cztM0_level2_quad_clean.evt |
| Size (bytes) | 711,889,920 | 88,750,080 |
| Size | 678.9 MB | 84.6 MB |
| Events in quadrant A | 5,886,032 | 578,922 |
| Events in quadrant B | 3,405,948 | 693,170 |
| Events in quadrant C | 10,417,004 | 417,742 |
| Events in quadrant D | 6,125,076 | 531,284 |
| Mode M0 | |||
|---|---|---|---|
| Quadrant | BADHDUFLAG | Total packets | Discarded packets |
| A | 0 | 22054 | 2 |
| B | 0 | 14784 | 2 |
| C | 0 | 35627 | 2 |
| D | 0 | 22772 | 2 |
| Mode M9 | |||
|---|---|---|---|
| Quadrant | BADHDUFLAG | Total packets | Discarded packets |
| A | 0 | 15 | 0 |
| B | 0 | 16 | 0 |
| C | 0 | 16 | 0 |
| D | 0 | 16 | 0 |
| Mode SS | |||
|---|---|---|---|
| Quadrant | BADHDUFLAG | Total packets | Discarded packets |
| A | 0 | 134 | 0 |
| B | 0 | 134 | 0 |
| C | 0 | 134 | 0 |
| D | 0 | 134 | 0 |
| Quadrant | Total seconds | Saturated seconds | Saturation percentage |
|---|---|---|---|
| A | 6688 | 760 | 11.363636% |
| B | 6688 | 82 | 1.226077% |
| C | 6688 | 2444 | 36.543062% |
| D | 6688 | 669 | 10.002990% |
Noise dominated data is calculated using 1-second bins in cleaned event files. If a bin has >2000 counts, and if more than 50% of those come from <1% of pixels, then it is considered to be noise-dominated and hence unusable.
| Quadrant | # 1 sec bins | Bins with >0 counts | Bins with >2000 counts | High rate bins dominated by noise | Noise dominated (total time) | Noise dominated (detector-on time) | Marked lightcurve |
|---|---|---|---|---|---|---|---|
| A | 7758 | 6689 | 759 | 759 | 9.78% | 11.35% | 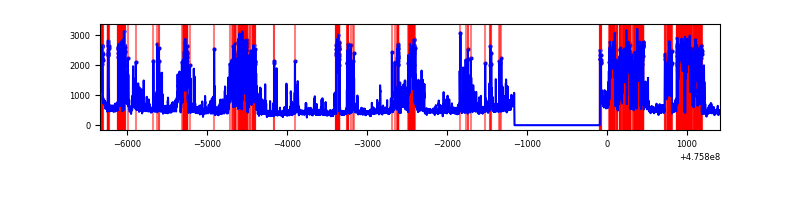 |
| B | 7758 | 6689 | 49 | 49 | 0.63% | 0.73% | 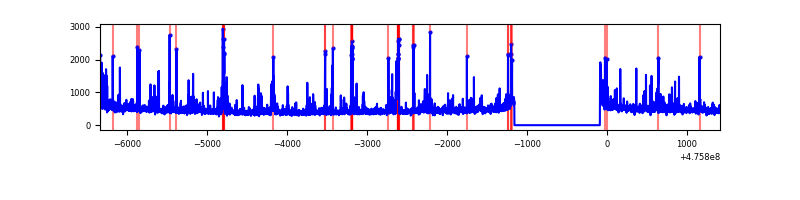 |
| C | 7758 | 6688 | 2271 | 2271 | 29.27% | 33.96% | 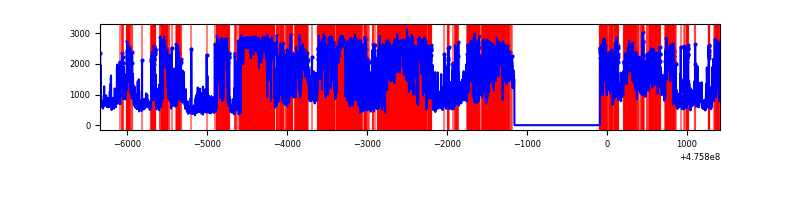 |
| D | 7758 | 6688 | 621 | 621 | 8.00% | 9.29% | 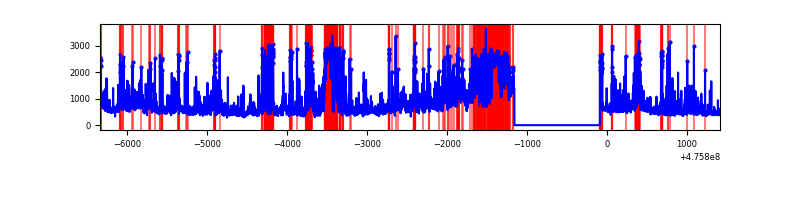 |
Top three noisy pixels from each quadrant. If the there are fewer than three noisy pixels in the level2.evt file, extra rows are filled as -1
| Pixel properties | Quadrant properties | ||||||
|---|---|---|---|---|---|---|---|
| Quadrant | DetID | PixID | Counts | Sigma | Mean | Median | Sigma |
| A | 10 | 253 | 1930995 | 11322.56 | 689 | 674 | 170.5 |
| A | 3 | 130 | 328796 | 1924.64 | 689 | 674 | 170.5 |
| A | 12 | 250 | 208891 | 1221.32 | 689 | 674 | 170.5 |
| B | 4 | 206 | 154163 | 1004.67 | 717 | 693 | 152.8 |
| B | 7 | 0 | 89321 | 580.19 | 717 | 693 | 152.8 |
| B | 8 | 128 | 49356 | 318.56 | 717 | 693 | 152.8 |
| C | 12 | 249 | 2177399 | 13152.13 | 594 | 589 | 165.5 |
| C | 1 | 60 | 2153966 | 13010.55 | 594 | 589 | 165.5 |
| C | 15 | 235 | 1174459 | 7092.44 | 594 | 589 | 165.5 |
| D | 6 | 42 | 1031881 | 5539.98 | 665 | 642 | 186.1 |
| D | 7 | 61 | 497179 | 2667.47 | 665 | 642 | 186.1 |
| D | 15 | 184 | 284135 | 1522.97 | 665 | 642 | 186.1 |
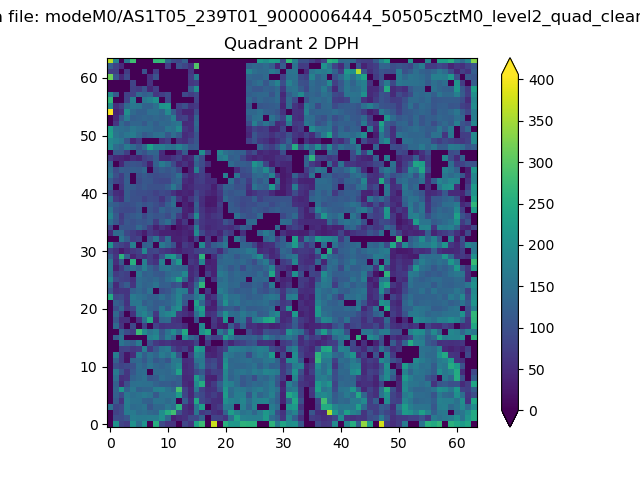
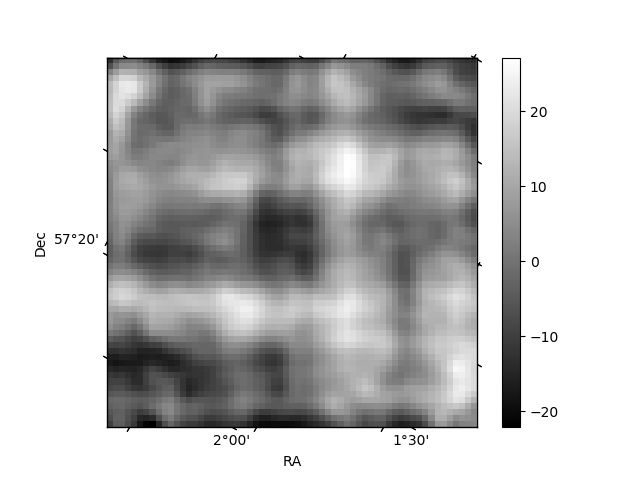
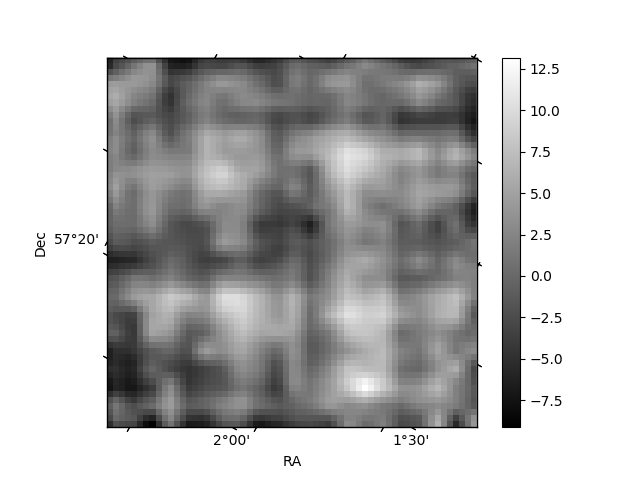
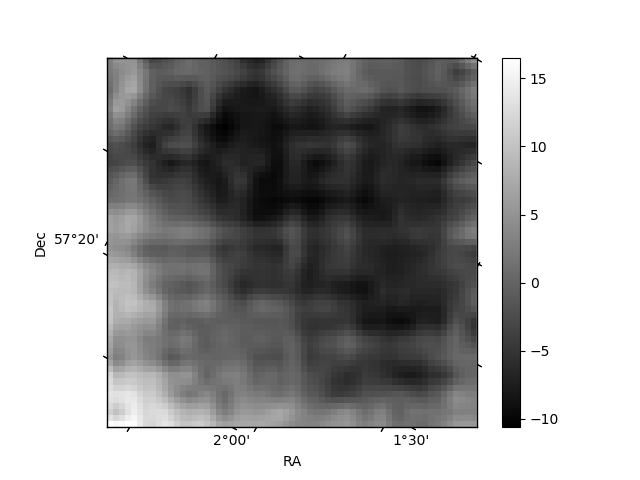
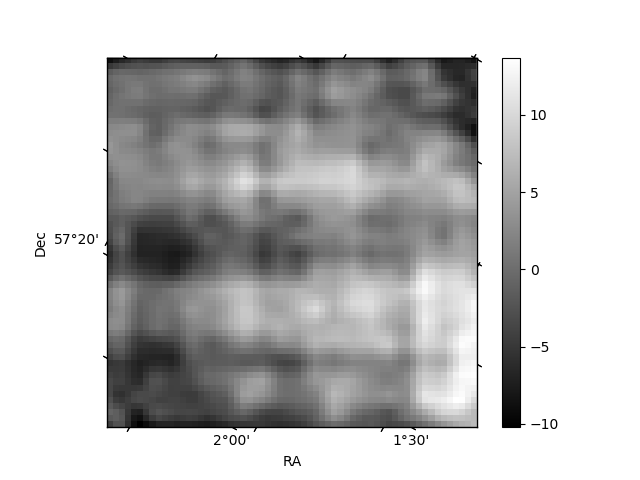
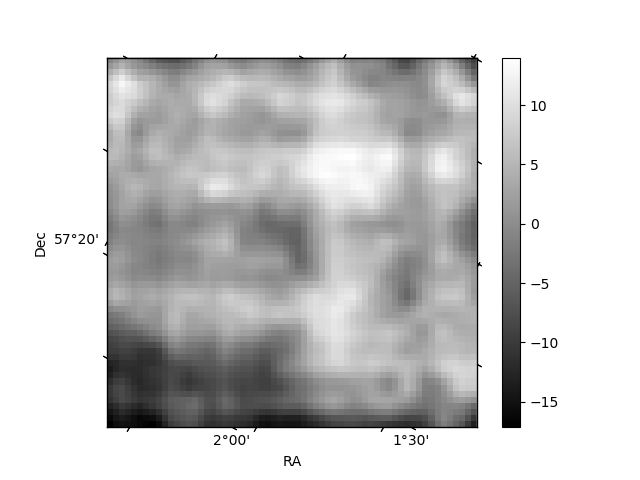
Histogram calculated using DETX and DETY for each event in the final _common_clean file
| Quadrant A | 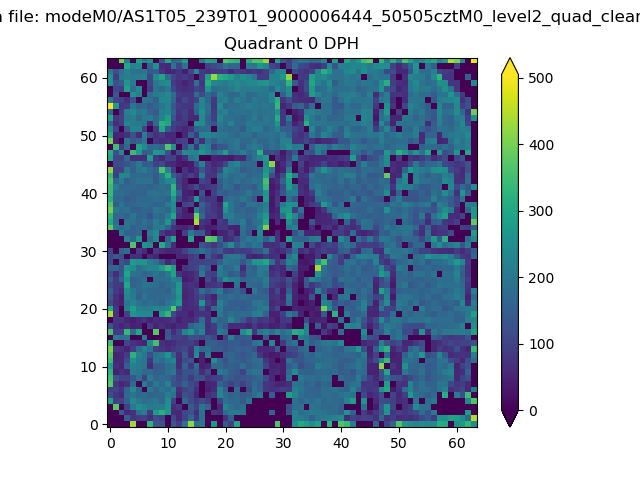 |
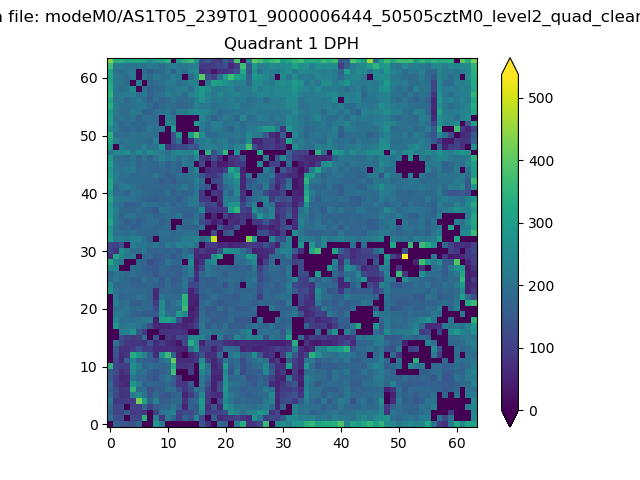 |
Quadrant B |
|---|---|---|---|
| Quadrant D | 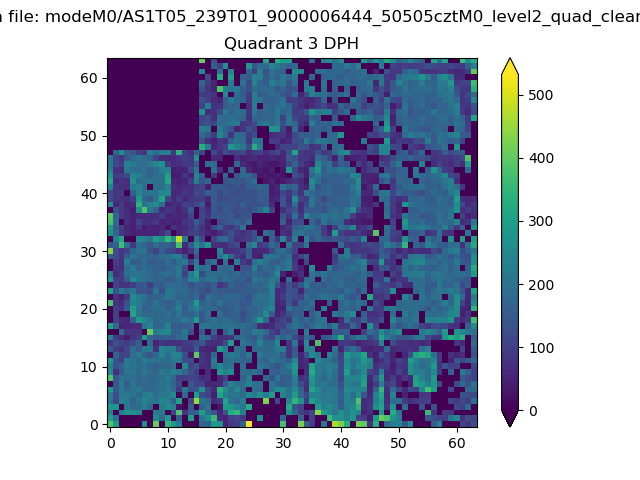 |
 |
Quadrant C |
| Plot type | Count rate plots | Images |
|---|---|---|
| Comparison with Poisson distribution Blue bars denote a histogram of data divided into 1 sec bins. Red curve is a Poisson curve with rate = median count rate of data. |
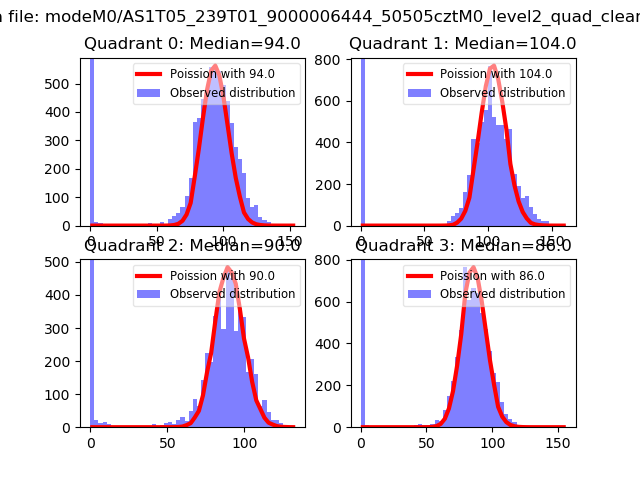 |
 |
| Quadrant-wise count rates Data is divided into 100 sec bins |
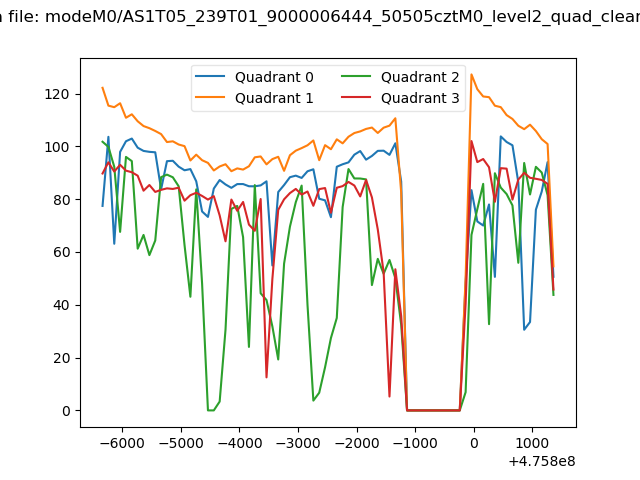 |
|
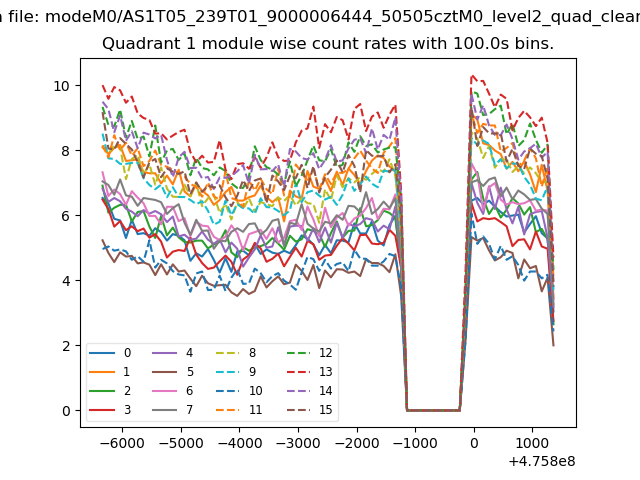
| Module-wise count rates for Quadrant A Data is divided into 100 sec bins |
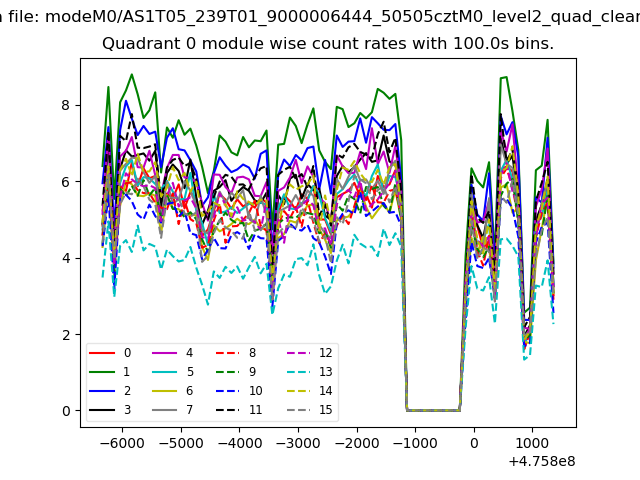 |
 |
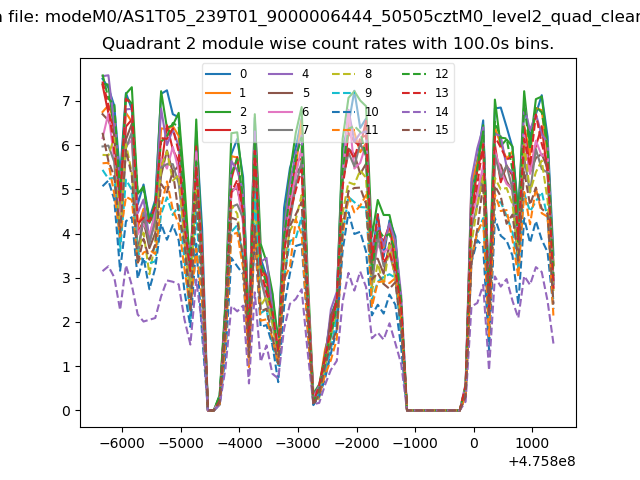
| Module-wise count rates for Quadrant B Data is divided into 100 sec bins |
 |
 |
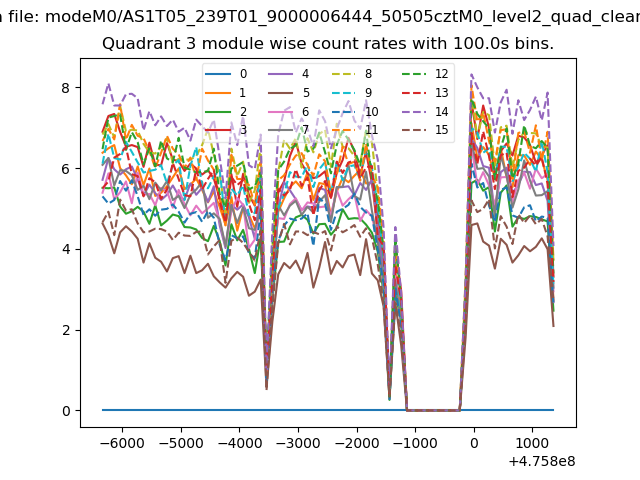
| Module-wise count rates for Quadrant C Data is divided into 100 sec bins |
 |
 |
| Module-wise count rates for Quadrant D Data is divided into 100 sec bins |
 |
 |
| Parameter | Plot |
|---|---|
| CZT HV Monitor | 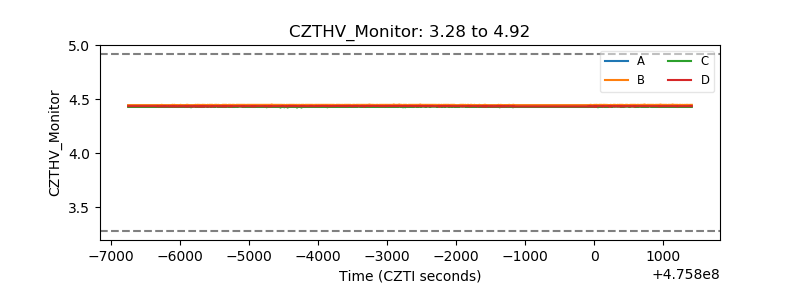 |
| D_VDD | 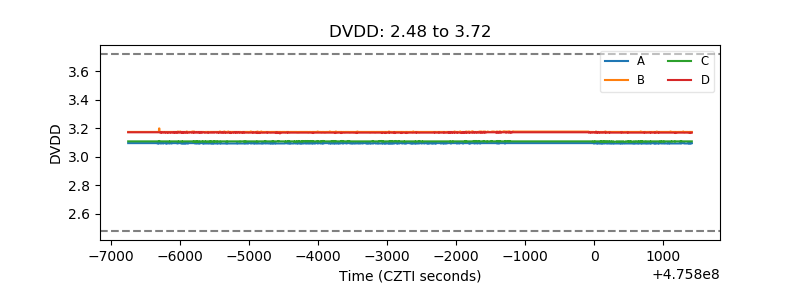 |
| Temperature 1 | 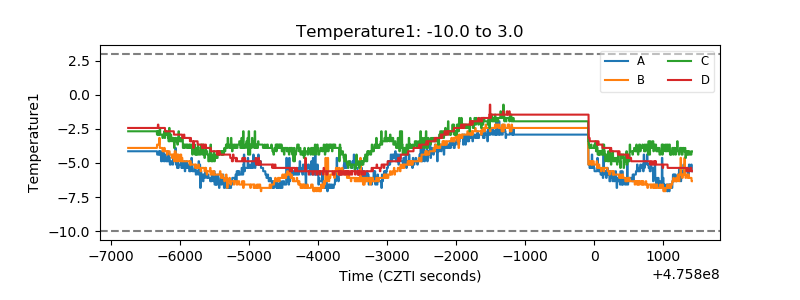 |
| Veto HV Monitor | 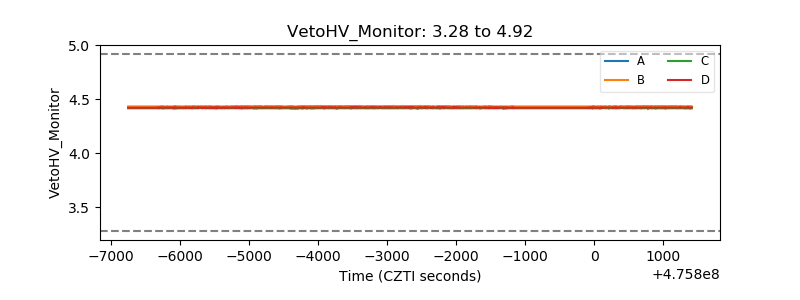 |
| Veto LLD | 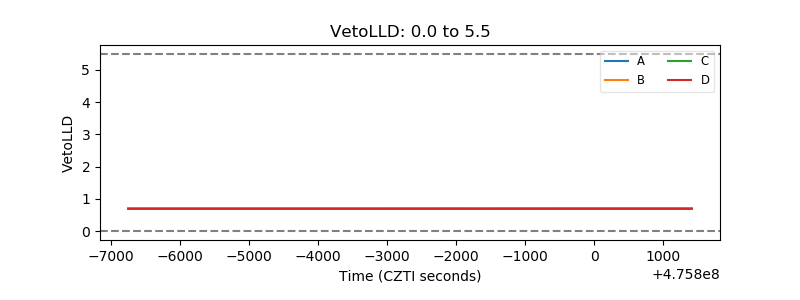 |
| Alpha Counter | 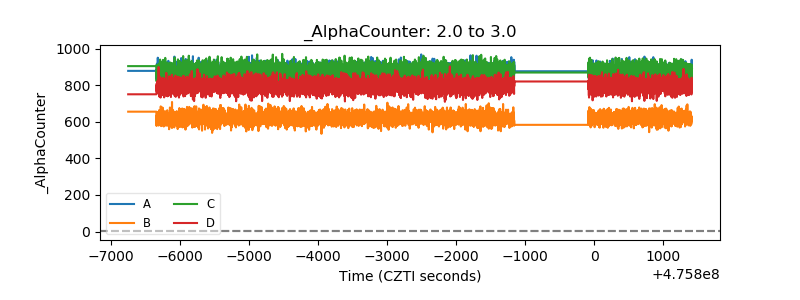 |
| _CPM_Rate | 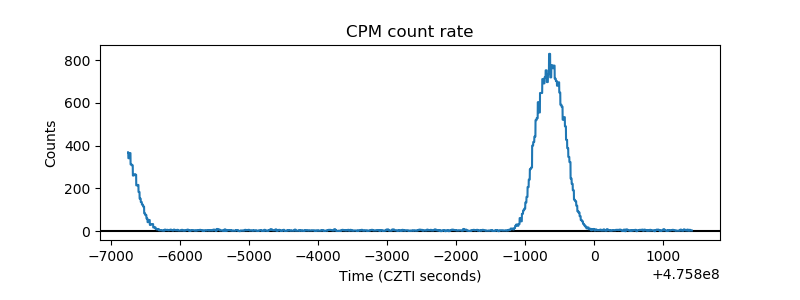 |
| CZT Counter | 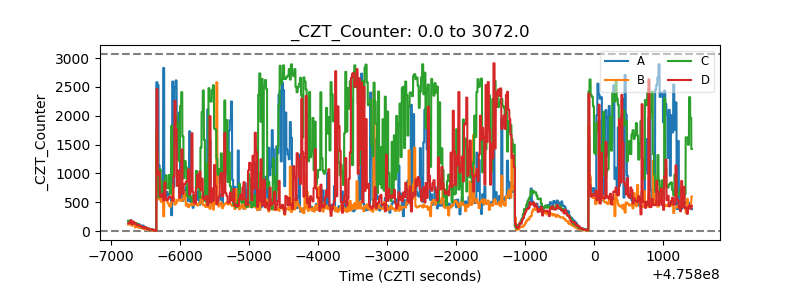 |
| +2.5 Volts monitor | 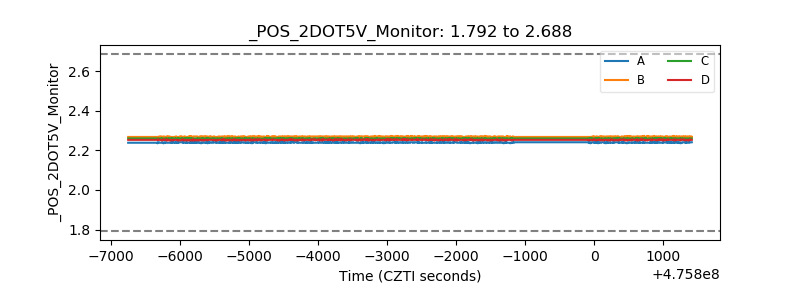 |
| +5 Volts monitor | 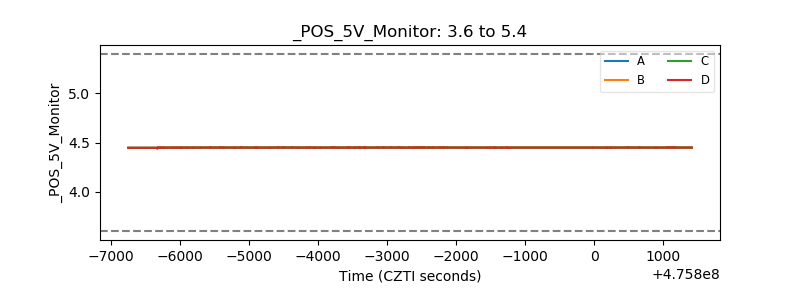 |
| _ROLL_ROT | 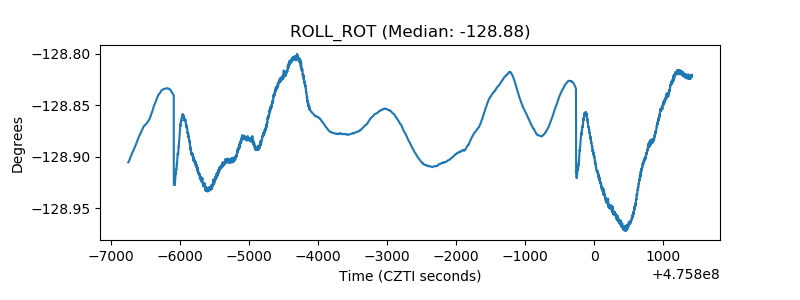 |
| _Roll_DEC | 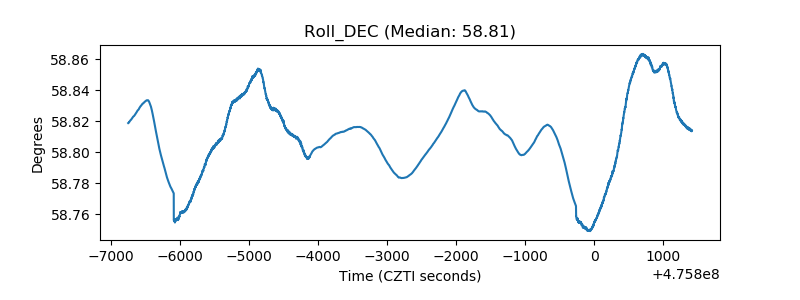 |
| _Roll_RA | 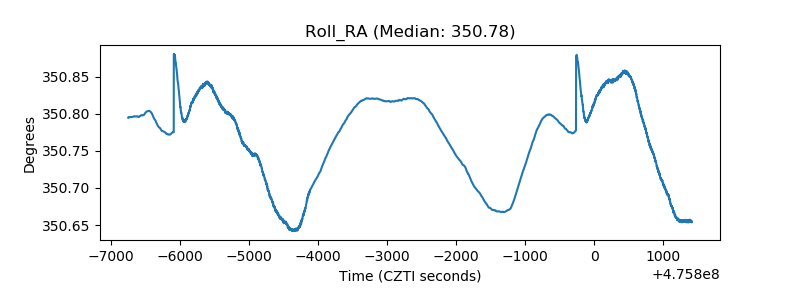 |
| Veto Counter | 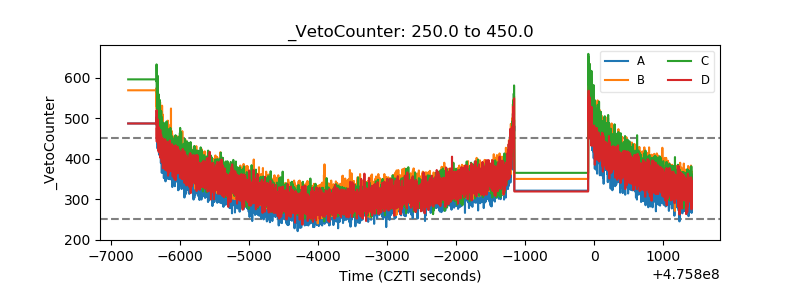 |