| Param | Original file | Final file |
|---|---|---|
| Filename | modeM0/AS1T05_239T01_9000006444_50506cztM0_level2.fits | modeM0/AS1T05_239T01_9000006444_50506cztM0_level2_quad_clean.evt |
| Size (bytes) | 699,004,800 | 91,365,120 |
| Size | 666.6 MB | 87.1 MB |
| Events in quadrant A | 6,116,648 | 579,657 |
| Events in quadrant B | 3,971,793 | 695,845 |
| Events in quadrant C | 10,057,571 | 485,388 |
| Events in quadrant D | 5,220,700 | 546,522 |
| Mode M0 | |||
|---|---|---|---|
| Quadrant | BADHDUFLAG | Total packets | Discarded packets |
| A | 0 | 22819 | 2 |
| B | 0 | 16262 | 2 |
| C | 0 | 34495 | 2 |
| D | 0 | 20027 | 2 |
| Mode M9 | |||
|---|---|---|---|
| Quadrant | BADHDUFLAG | Total packets | Discarded packets |
| A | 0 | 11 | 0 |
| B | 0 | 11 | 0 |
| C | 0 | 11 | 0 |
| D | 0 | 11 | 0 |
| Mode SS | |||
|---|---|---|---|
| Quadrant | BADHDUFLAG | Total packets | Discarded packets |
| A | 0 | 136 | 0 |
| B | 0 | 136 | 0 |
| C | 0 | 136 | 0 |
| D | 0 | 136 | 0 |
| Quadrant | Total seconds | Saturated seconds | Saturation percentage |
|---|---|---|---|
| A | 6571 | 786 | 11.961650% |
| B | 6572 | 127 | 1.932441% |
| C | 6572 | 1721 | 26.186853% |
| D | 6572 | 517 | 7.866707% |
Noise dominated data is calculated using 1-second bins in cleaned event files. If a bin has >2000 counts, and if more than 50% of those come from <1% of pixels, then it is considered to be noise-dominated and hence unusable.
| Quadrant | # 1 sec bins | Bins with >0 counts | Bins with >2000 counts | High rate bins dominated by noise | Noise dominated (total time) | Noise dominated (detector-on time) | Marked lightcurve |
|---|---|---|---|---|---|---|---|
| A | 7726 | 6571 | 758 | 758 | 9.81% | 11.54% | 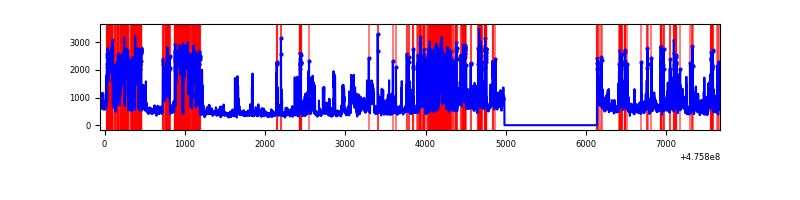 |
| B | 7727 | 6572 | 61 | 61 | 0.79% | 0.93% | 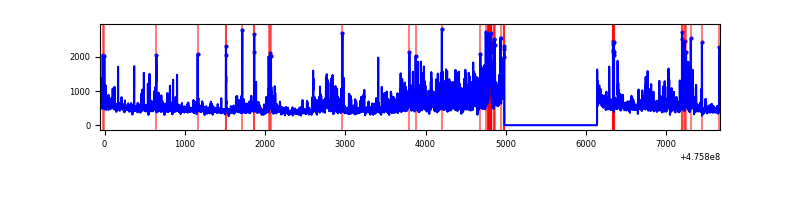 |
| C | 7726 | 6571 | 1640 | 1640 | 21.23% | 24.96% | 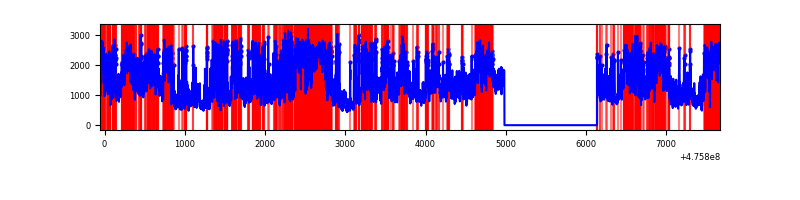 |
| D | 7727 | 6572 | 498 | 498 | 6.44% | 7.58% | 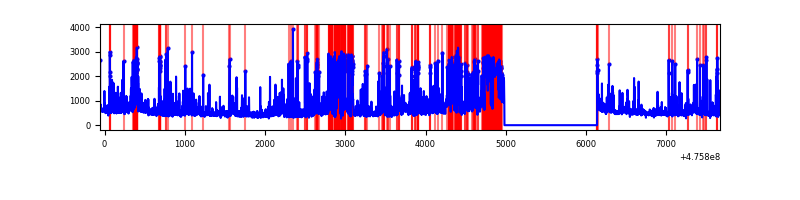 |
Top three noisy pixels from each quadrant. If the there are fewer than three noisy pixels in the level2.evt file, extra rows are filled as -1
| Pixel properties | Quadrant properties | ||||||
|---|---|---|---|---|---|---|---|
| Quadrant | DetID | PixID | Counts | Sigma | Mean | Median | Sigma |
| A | 10 | 253 | 2179534 | 13066.81 | 681 | 666 | 166.7 |
| A | 3 | 130 | 543759 | 3256.96 | 681 | 666 | 166.7 |
| A | 4 | 249 | 138027 | 823.76 | 681 | 666 | 166.7 |
| B | 4 | 170 | 515366 | 3357.87 | 713 | 688 | 153.3 |
| B | 7 | 0 | 121930 | 791.01 | 713 | 688 | 153.3 |
| B | 1 | 238 | 114716 | 743.94 | 713 | 688 | 153.3 |
| C | 12 | 247 | 2167127 | 11819.0 | 647 | 641 | 183.3 |
| C | 15 | 235 | 1703017 | 9287.11 | 647 | 641 | 183.3 |
| C | 15 | 196 | 923800 | 5036.18 | 647 | 641 | 183.3 |
| D | 2 | 249 | 410885 | 2209.94 | 662 | 640 | 185.6 |
| D | 15 | 184 | 402999 | 2167.46 | 662 | 640 | 185.6 |
| D | 7 | 96 | 343232 | 1845.5 | 662 | 640 | 185.6 |
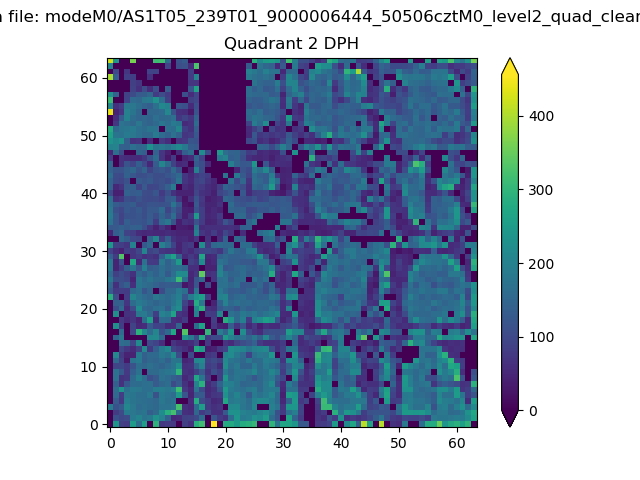
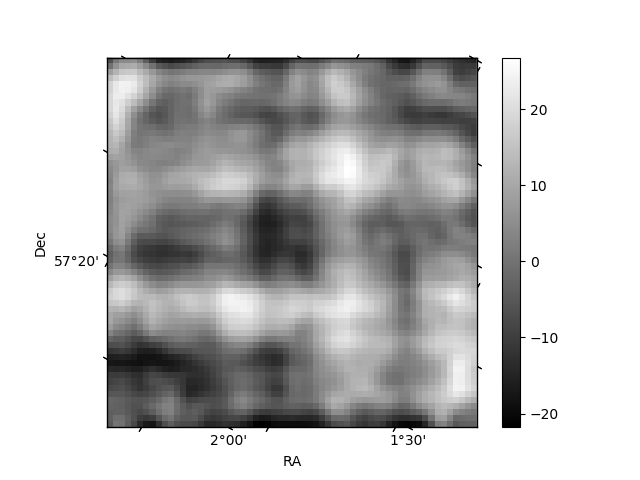
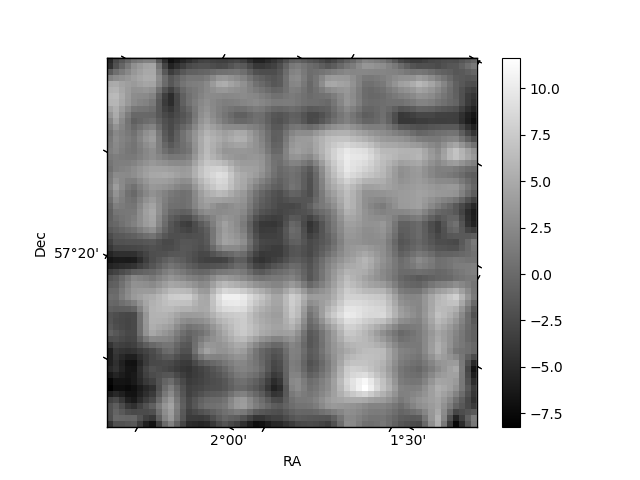
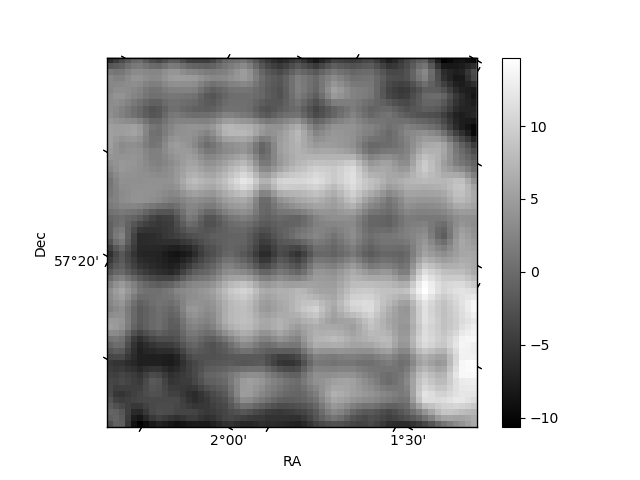
Histogram calculated using DETX and DETY for each event in the final _common_clean file
| Quadrant A | 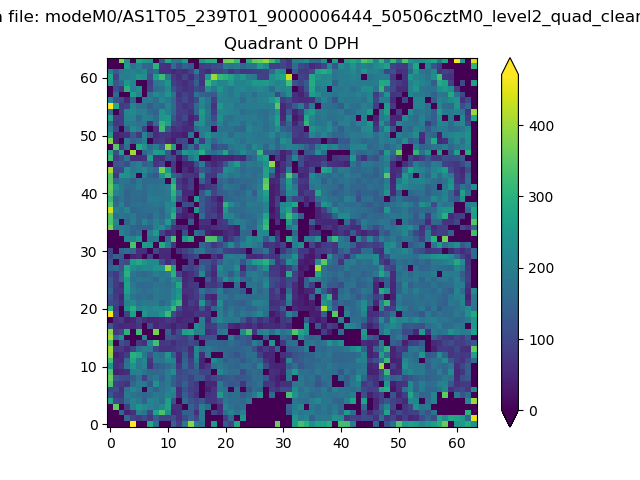 |
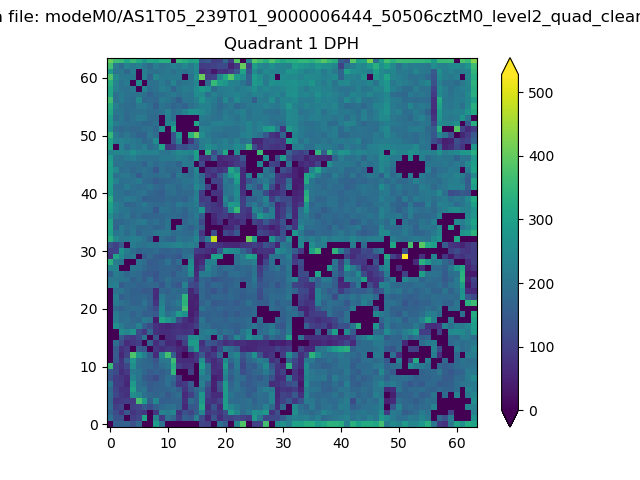 |
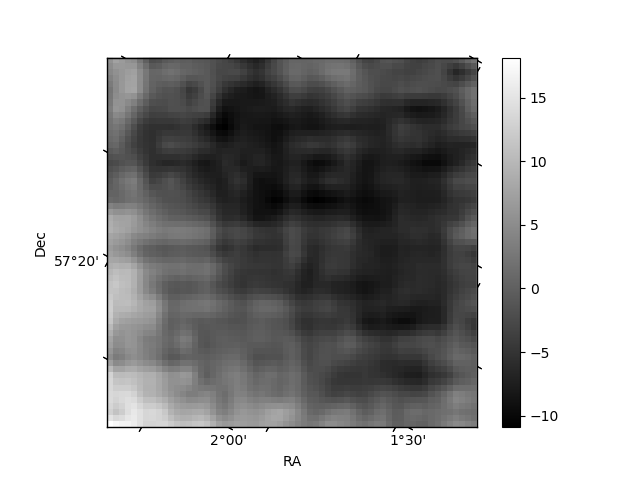
Quadrant B |
|---|---|---|---|
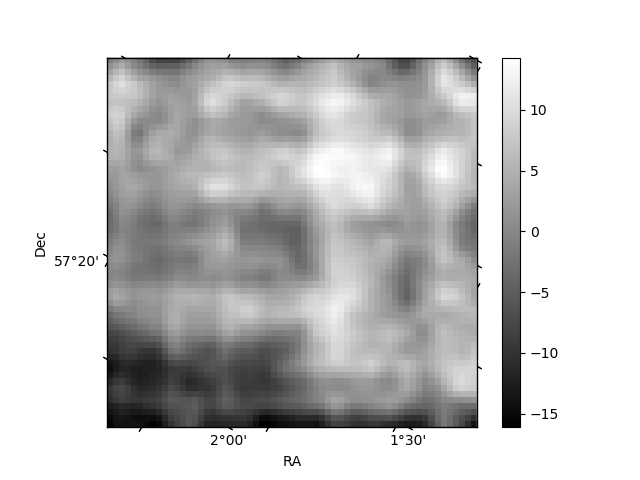
| Quadrant D | 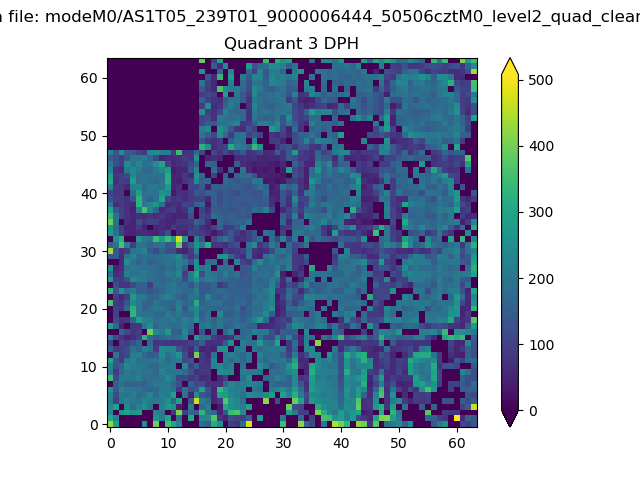 |
 |
Quadrant C |
| Plot type | Count rate plots | Images |
|---|---|---|
| Comparison with Poisson distribution Blue bars denote a histogram of data divided into 1 sec bins. Red curve is a Poisson curve with rate = median count rate of data. |
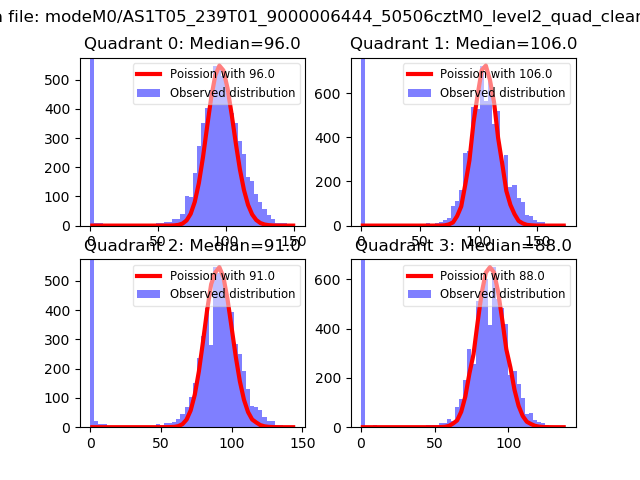 |
 |
| Quadrant-wise count rates Data is divided into 100 sec bins |
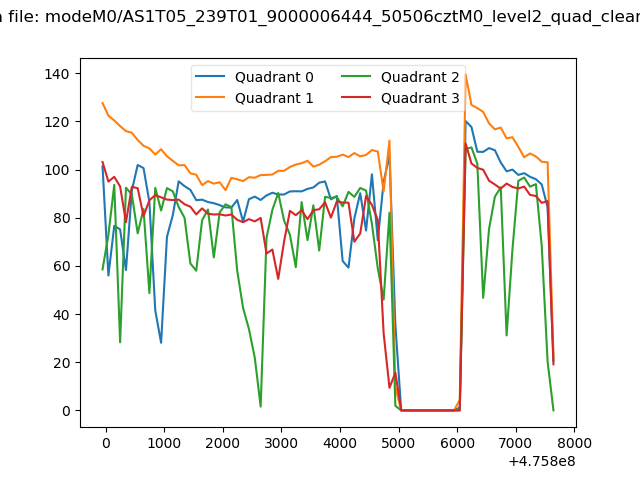 |
|
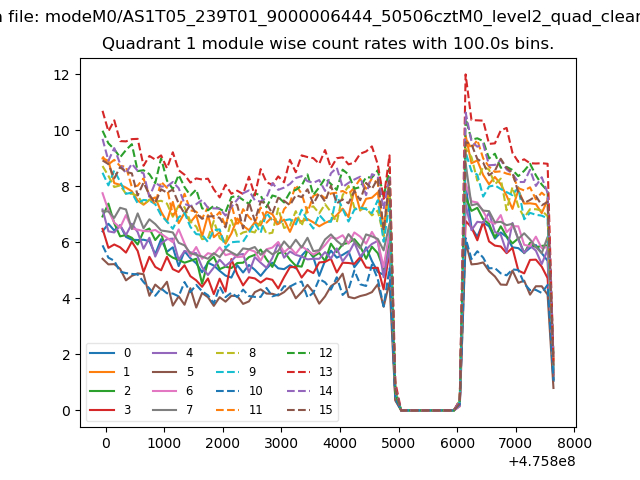
| Module-wise count rates for Quadrant A Data is divided into 100 sec bins |
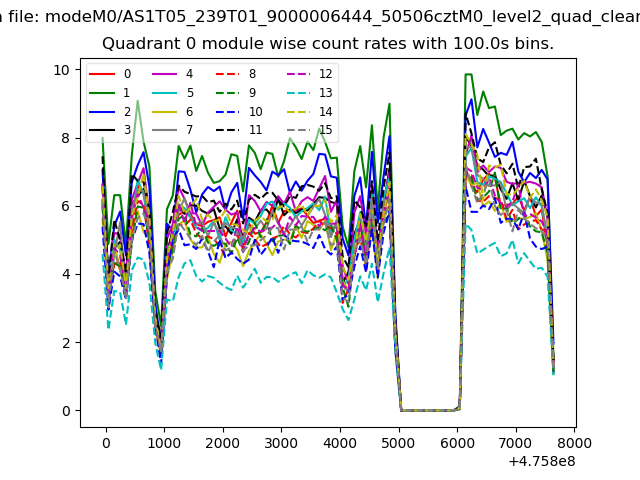 |
 |
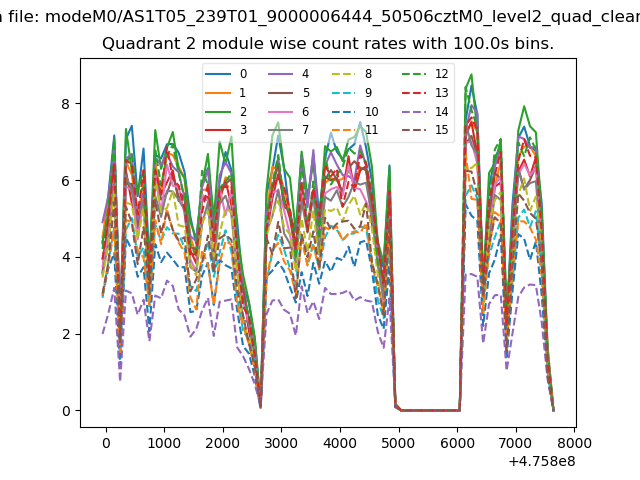
| Module-wise count rates for Quadrant B Data is divided into 100 sec bins |
 |
 |
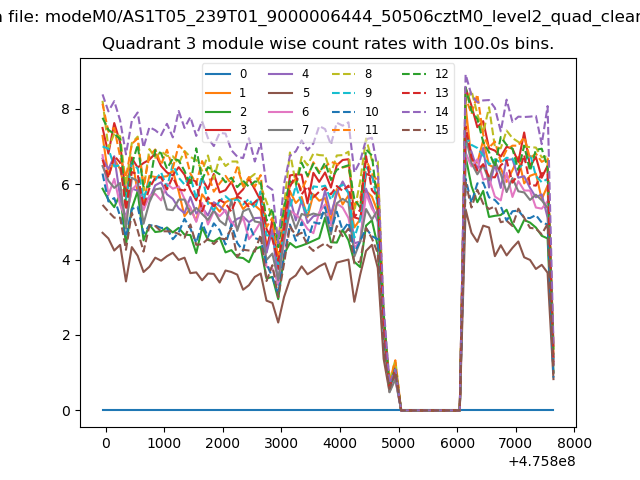
| Module-wise count rates for Quadrant C Data is divided into 100 sec bins |
 |
 |
| Module-wise count rates for Quadrant D Data is divided into 100 sec bins |
 |
 |
| Parameter | Plot |
|---|---|
| CZT HV Monitor | 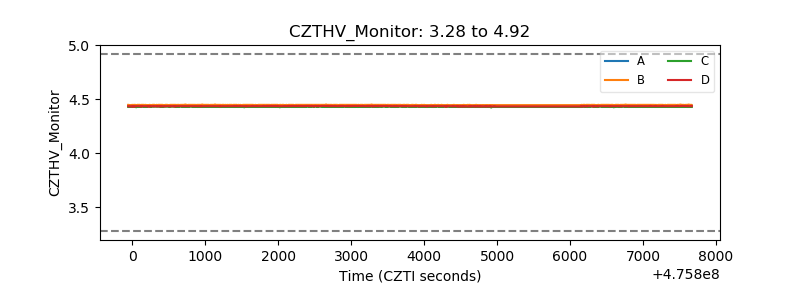 |
| D_VDD | 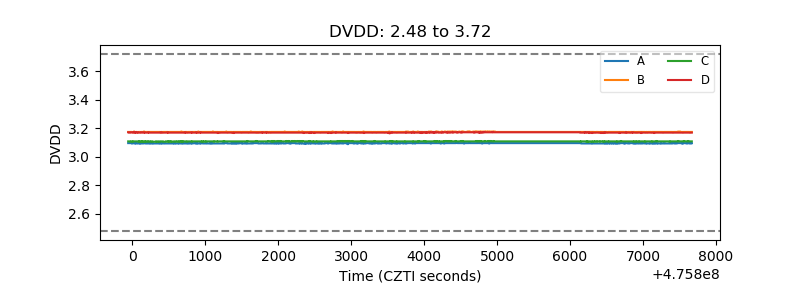 |
| Temperature 1 | 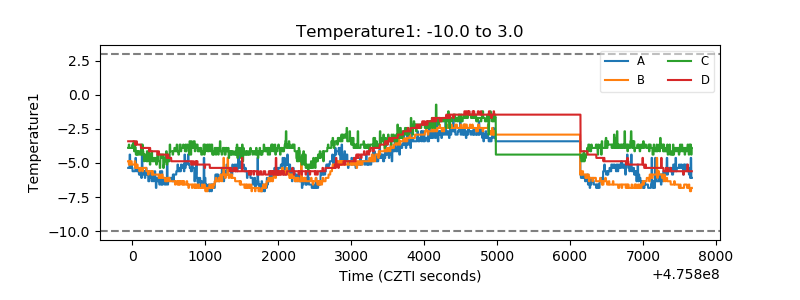 |
| Veto HV Monitor | 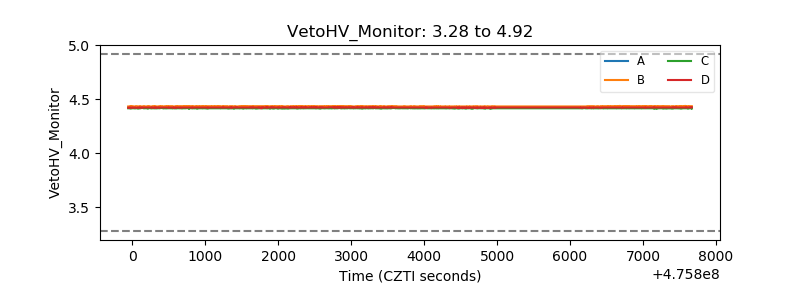 |
| Veto LLD | 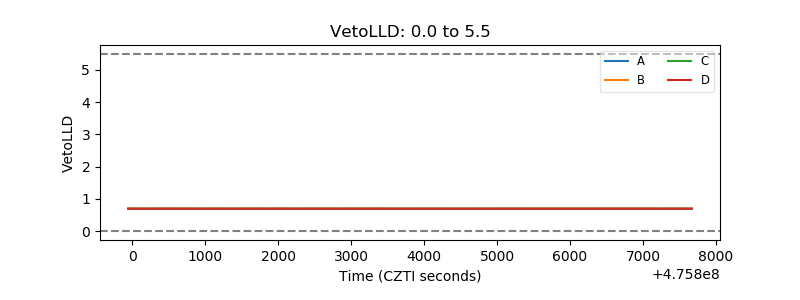 |
| Alpha Counter | 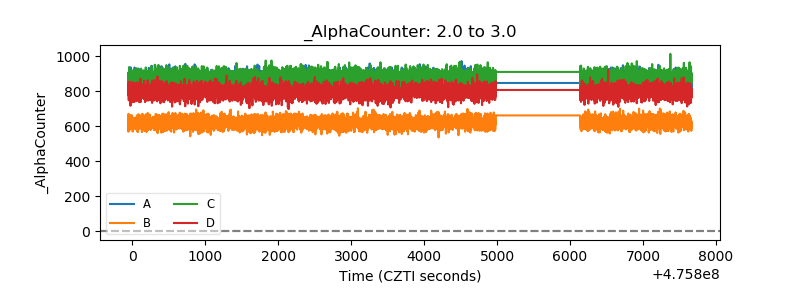 |
| _CPM_Rate | 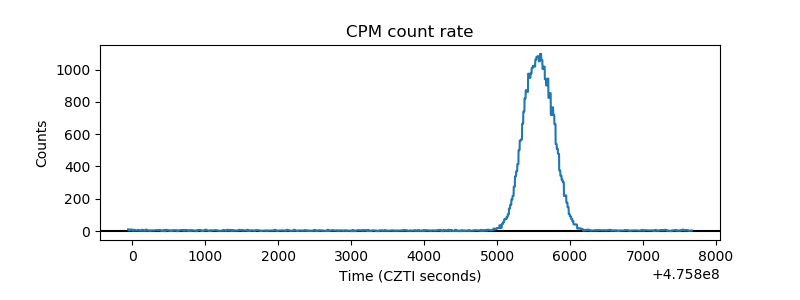 |
| CZT Counter | 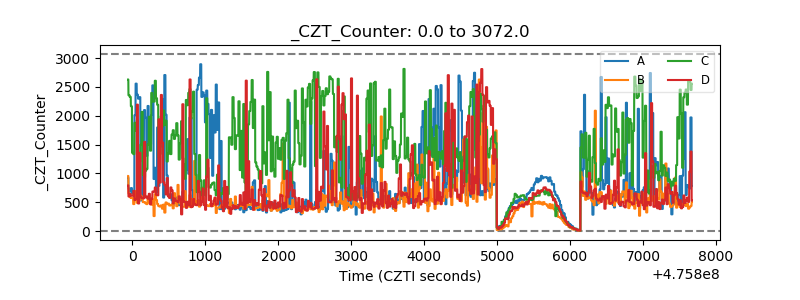 |
| +2.5 Volts monitor |  |
| +5 Volts monitor |  |
| _ROLL_ROT | 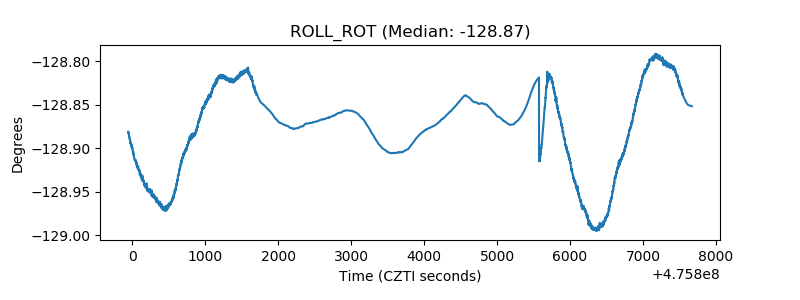 |
| _Roll_DEC | 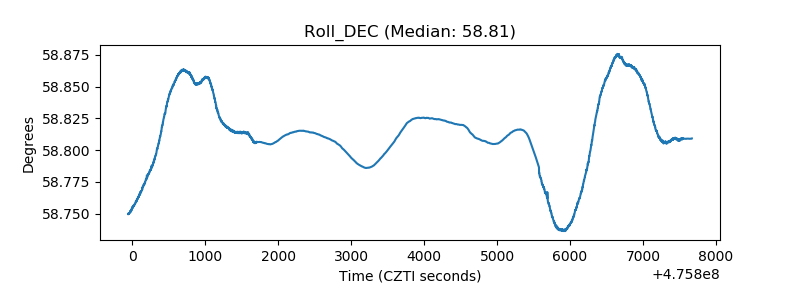 |
| _Roll_RA | 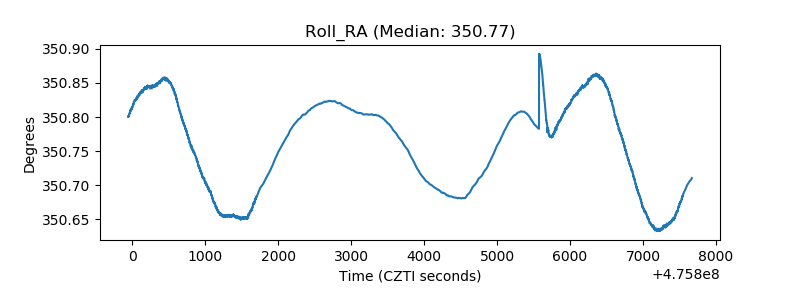 |
| Veto Counter | 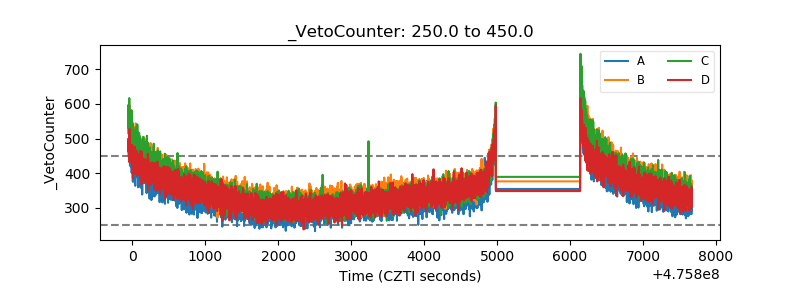 |