| Param | Original file | Final file |
|---|---|---|
| Filename | modeM0/AS1T05_239T01_9000006444_50507cztM0_level2.fits | modeM0/AS1T05_239T01_9000006444_50507cztM0_level2_quad_clean.evt |
| Size (bytes) | 707,486,400 | 92,295,360 |
| Size | 674.7 MB | 88.0 MB |
| Events in quadrant A | 5,890,585 | 612,426 |
| Events in quadrant B | 4,316,957 | 701,300 |
| Events in quadrant C | 10,539,805 | 450,426 |
| Events in quadrant D | 4,934,520 | 573,019 |
| Mode M0 | |||
|---|---|---|---|
| Quadrant | BADHDUFLAG | Total packets | Discarded packets |
| A | 0 | 22037 | 2 |
| B | 0 | 17347 | 3 |
| C | 0 | 35901 | 2 |
| D | 0 | 19113 | 2 |
| Mode M9 | |||
|---|---|---|---|
| Quadrant | BADHDUFLAG | Total packets | Discarded packets |
| A | 0 | 22 | 0 |
| B | 0 | 23 | 0 |
| C | 0 | 23 | 0 |
| D | 0 | 23 | 0 |
| Mode SS | |||
|---|---|---|---|
| Quadrant | BADHDUFLAG | Total packets | Discarded packets |
| A | 0 | 134 | 0 |
| B | 0 | 136 | 0 |
| C | 0 | 136 | 0 |
| D | 0 | 136 | 0 |
| Quadrant | Total seconds | Saturated seconds | Saturation percentage |
|---|---|---|---|
| A | 6556 | 535 | 8.160464% |
| B | 6555 | 234 | 3.569794% |
| C | 6555 | 2204 | 33.623188% |
| D | 6555 | 328 | 5.003814% |
Noise dominated data is calculated using 1-second bins in cleaned event files. If a bin has >2000 counts, and if more than 50% of those come from <1% of pixels, then it is considered to be noise-dominated and hence unusable.
| Quadrant | # 1 sec bins | Bins with >0 counts | Bins with >2000 counts | High rate bins dominated by noise | Noise dominated (total time) | Noise dominated (detector-on time) | Marked lightcurve |
|---|---|---|---|---|---|---|---|
| A | 7766 | 6557 | 523 | 523 | 6.73% | 7.98% | 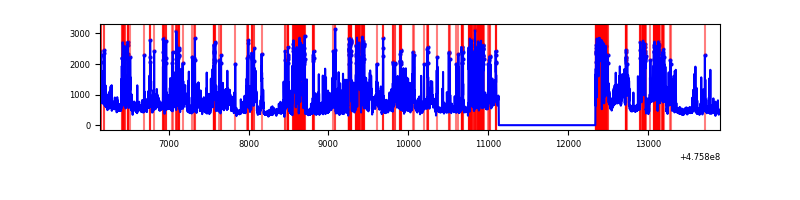 |
| B | 7765 | 6555 | 163 | 163 | 2.10% | 2.49% | 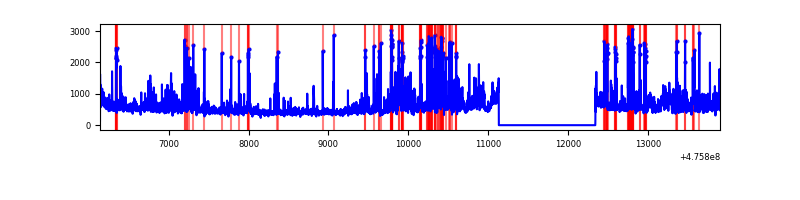 |
| C | 7764 | 6554 | 2128 | 2128 | 27.41% | 32.47% | 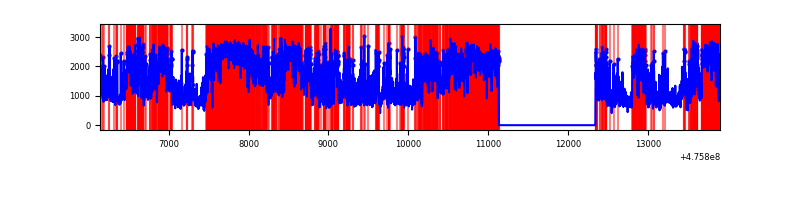 |
| D | 7765 | 6555 | 316 | 316 | 4.07% | 4.82% | 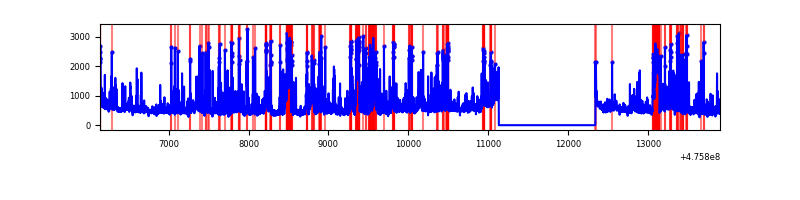 |
Top three noisy pixels from each quadrant. If the there are fewer than three noisy pixels in the level2.evt file, extra rows are filled as -1
| Pixel properties | Quadrant properties | ||||||
|---|---|---|---|---|---|---|---|
| Quadrant | DetID | PixID | Counts | Sigma | Mean | Median | Sigma |
| A | 10 | 253 | 1620799 | 9468.29 | 695 | 678 | 171.1 |
| A | 3 | 130 | 577546 | 3371.32 | 695 | 678 | 171.1 |
| A | 12 | 250 | 211685 | 1233.16 | 695 | 678 | 171.1 |
| B | 4 | 170 | 526942 | 3463.32 | 714 | 690 | 152.0 |
| B | 1 | 238 | 454040 | 2983.54 | 714 | 690 | 152.0 |
| B | 5 | 79 | 97192 | 635.09 | 714 | 690 | 152.0 |
| C | 12 | 247 | 2450245 | 14053.11 | 619 | 612 | 174.3 |
| C | 15 | 235 | 1838716 | 10544.88 | 619 | 612 | 174.3 |
| C | 15 | 196 | 1790942 | 10270.81 | 619 | 612 | 174.3 |
| D | 6 | 42 | 703793 | 3696.63 | 683 | 656 | 190.2 |
| D | 7 | 77 | 318759 | 1672.38 | 683 | 656 | 190.2 |
| D | 2 | 249 | 291912 | 1531.23 | 683 | 656 | 190.2 |
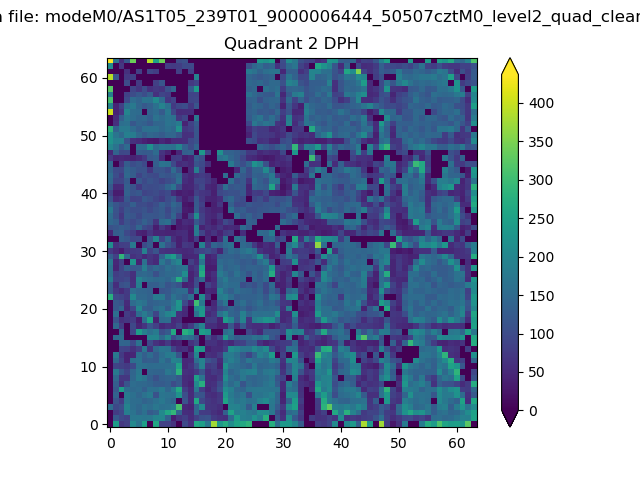
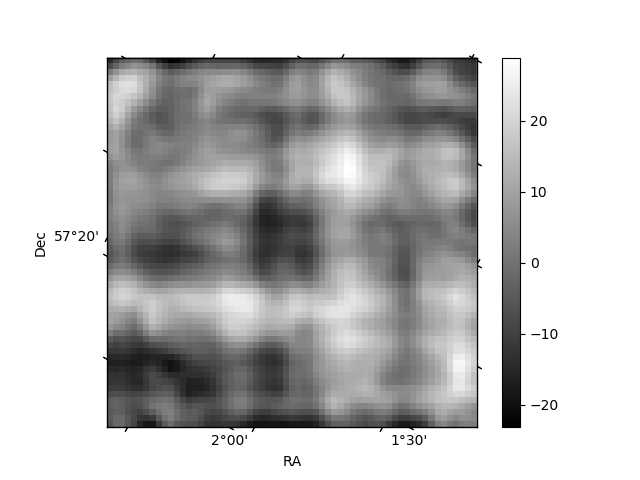
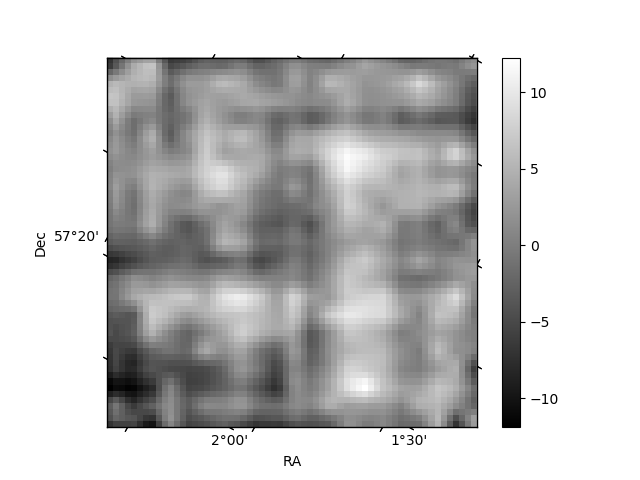
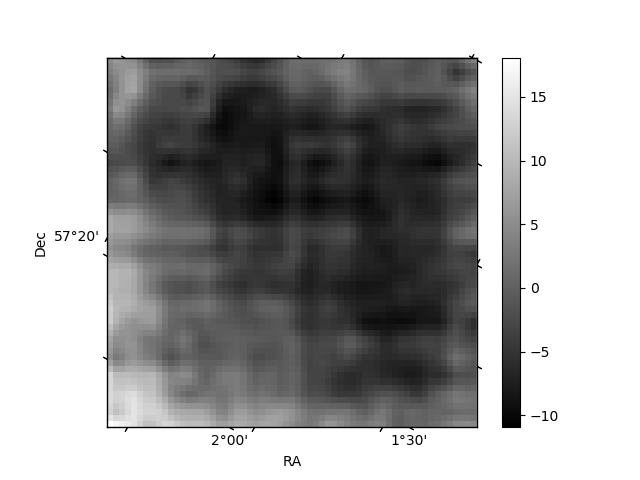
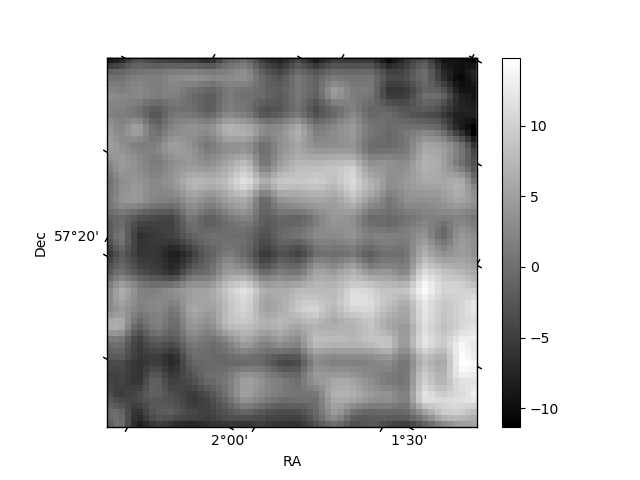
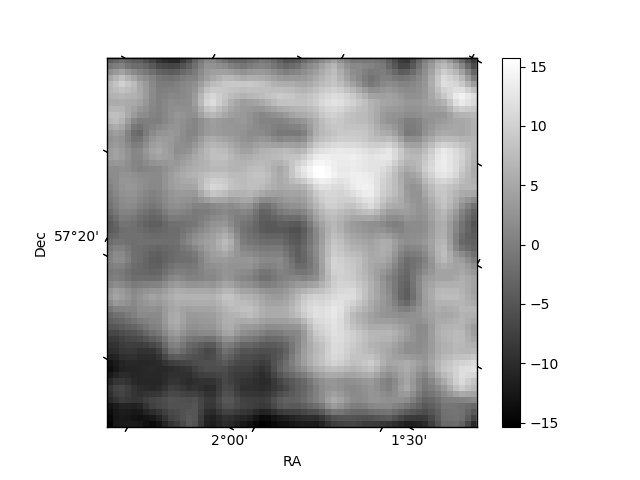
Histogram calculated using DETX and DETY for each event in the final _common_clean file
| Quadrant A | 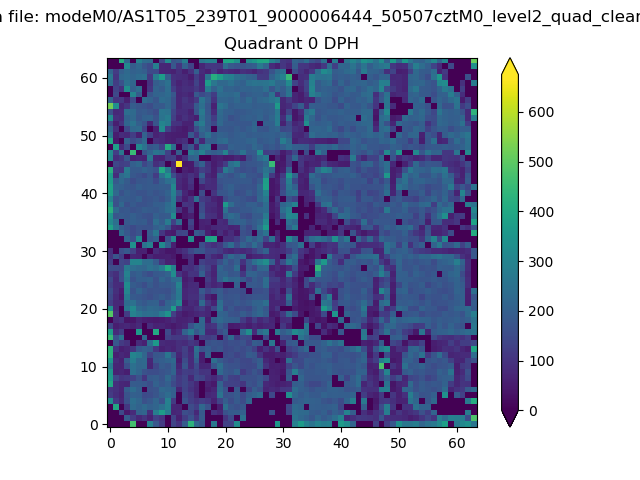 |
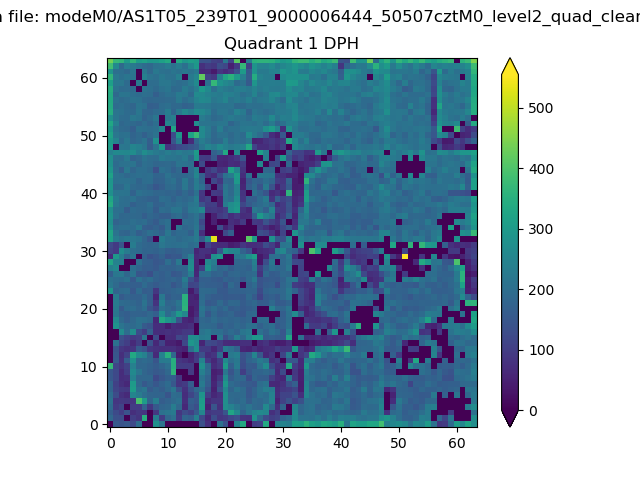 |
Quadrant B |
|---|---|---|---|
| Quadrant D | 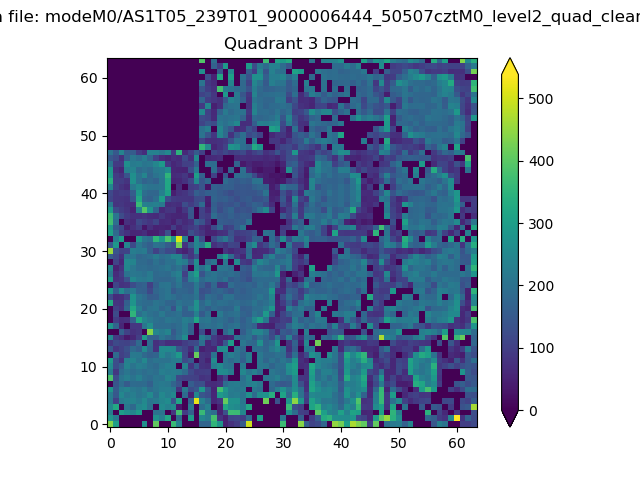 |
 |
Quadrant C |
| Plot type | Count rate plots | Images |
|---|---|---|
| Comparison with Poisson distribution Blue bars denote a histogram of data divided into 1 sec bins. Red curve is a Poisson curve with rate = median count rate of data. |
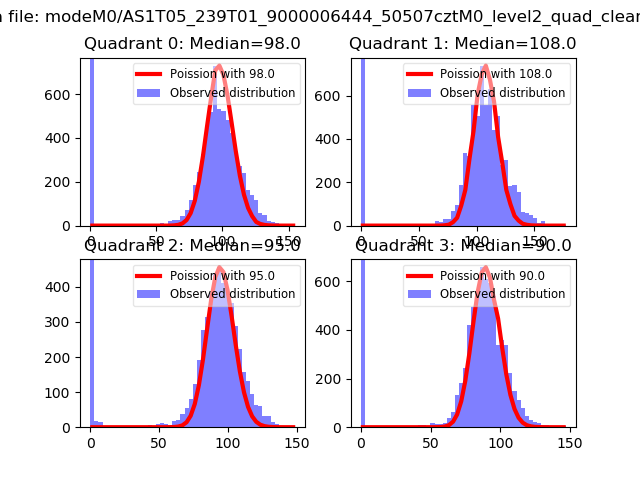 |
 |
| Quadrant-wise count rates Data is divided into 100 sec bins |
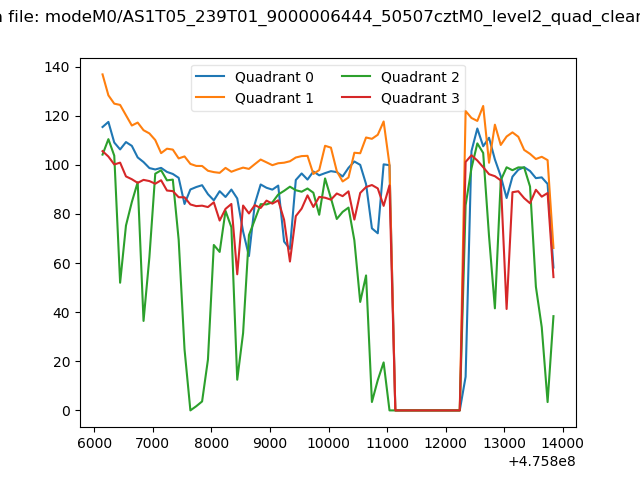 |
|
| Module-wise count rates for Quadrant A Data is divided into 100 sec bins |
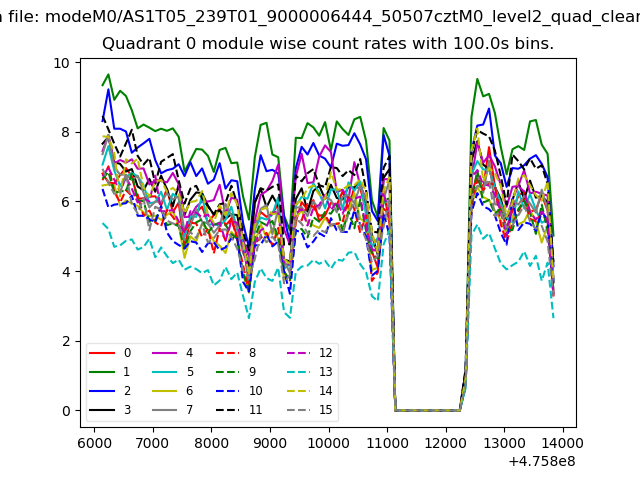 |
 |
| Module-wise count rates for Quadrant B Data is divided into 100 sec bins |
 |
 |
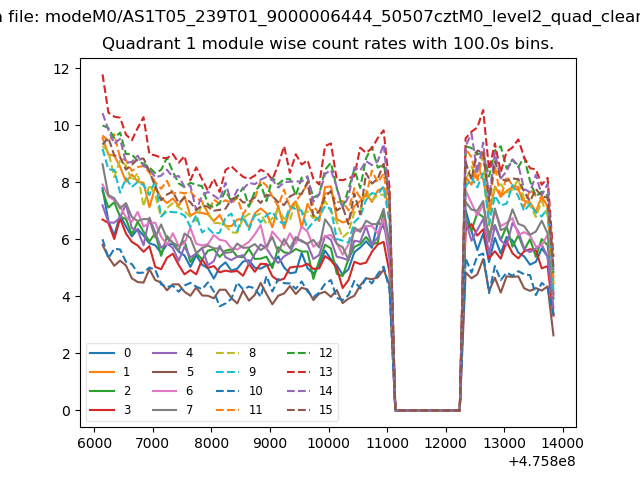
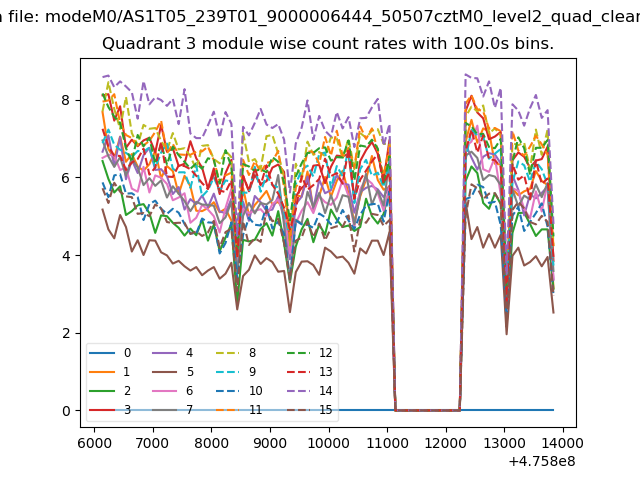
| Module-wise count rates for Quadrant C Data is divided into 100 sec bins |
 |
 |
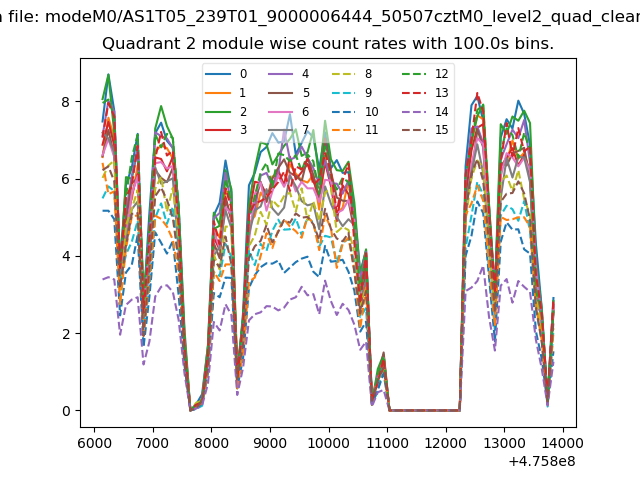
| Module-wise count rates for Quadrant D Data is divided into 100 sec bins |
 |
 |
| Parameter | Plot |
|---|---|
| CZT HV Monitor | 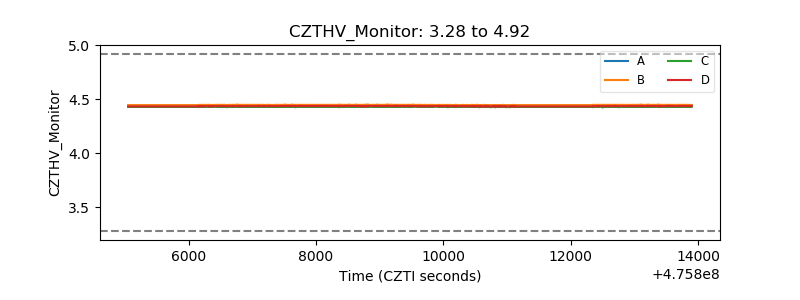 |
| D_VDD | 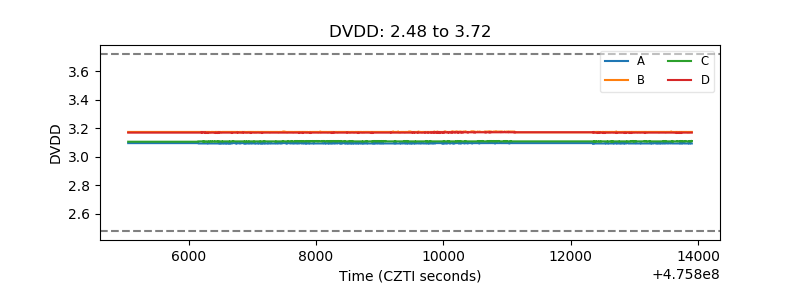 |
| Temperature 1 | 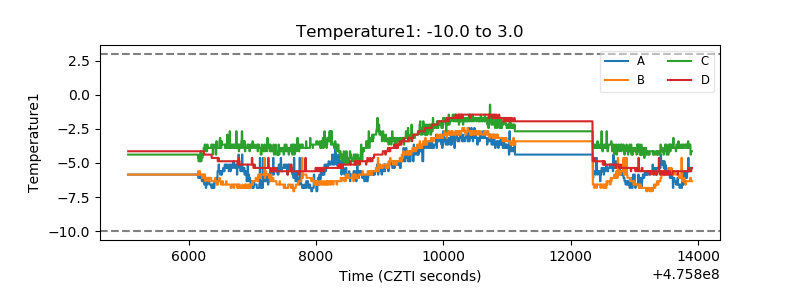 |
| Veto HV Monitor | 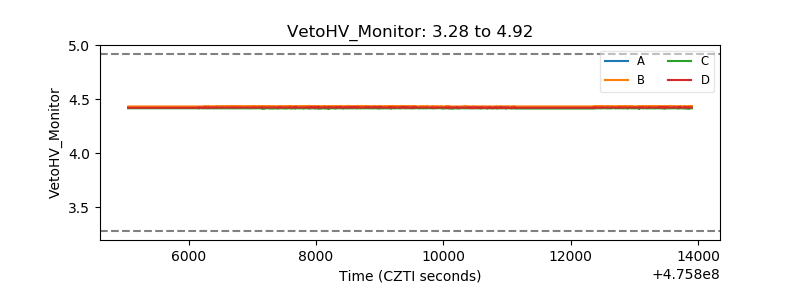 |
| Veto LLD | 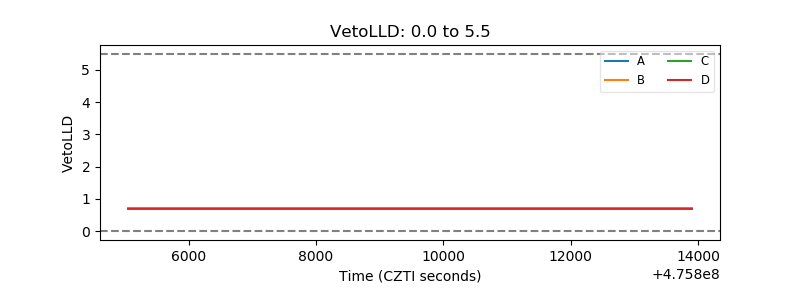 |
| Alpha Counter | 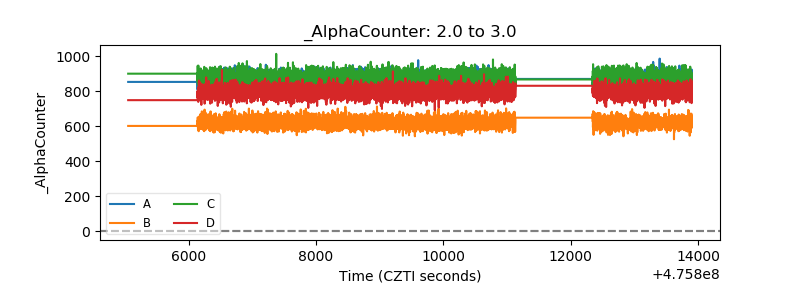 |
| _CPM_Rate | 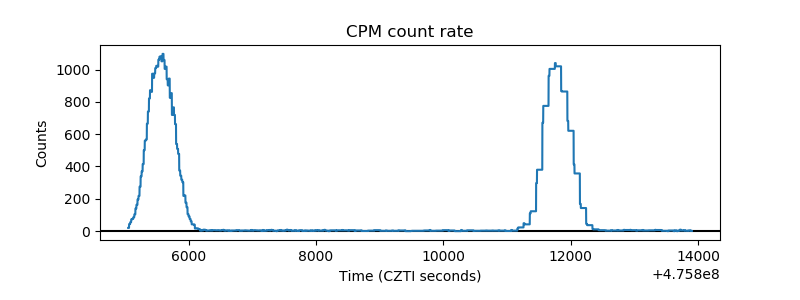 |
| CZT Counter | 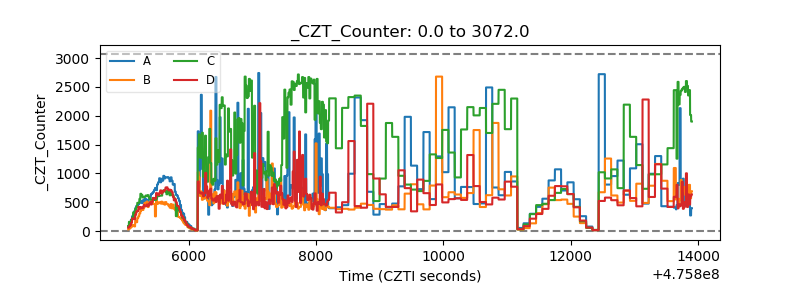 |
| +2.5 Volts monitor | 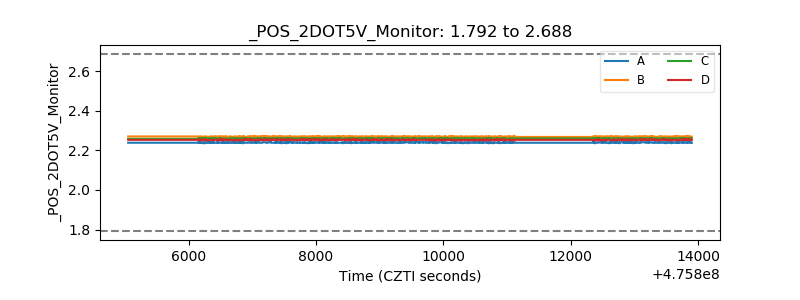 |
| +5 Volts monitor |  |
| _ROLL_ROT | 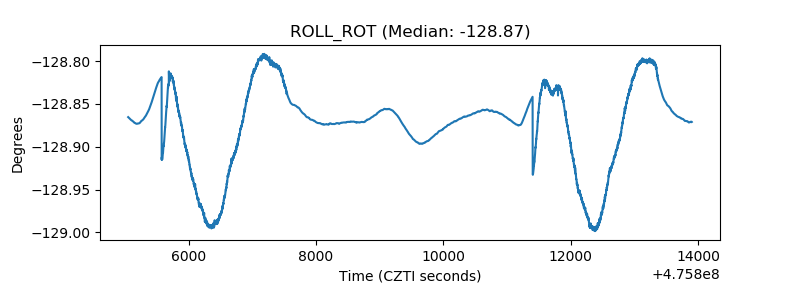 |
| _Roll_DEC | 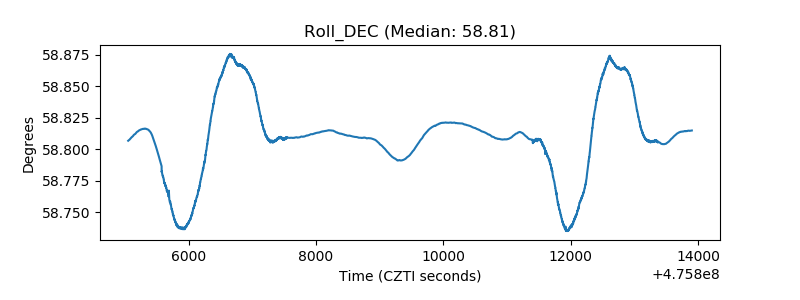 |
| _Roll_RA | 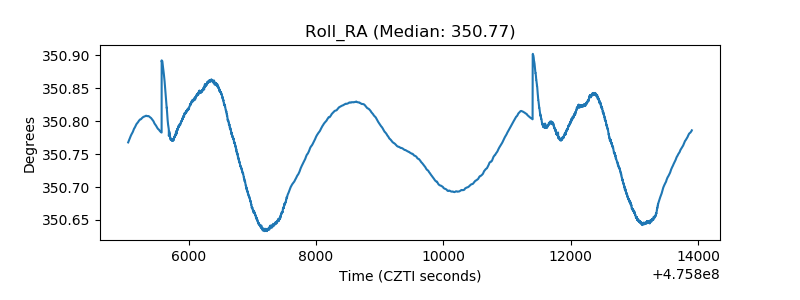 |
| Veto Counter | 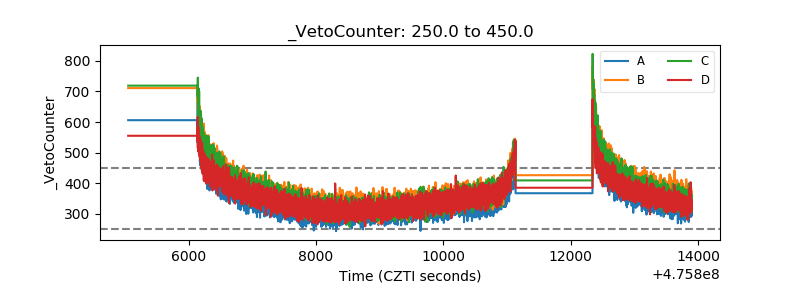 |