| Param | Original file | Final file |
|---|---|---|
| Filename | modeM0/AS1T05_239T01_9000006444_50508cztM0_level2.fits | modeM0/AS1T05_239T01_9000006444_50508cztM0_level2_quad_clean.evt |
| Size (bytes) | 793,307,520 | 84,931,200 |
| Size | 756.6 MB | 81.0 MB |
| Events in quadrant A | 6,455,501 | 549,238 |
| Events in quadrant B | 4,081,486 | 698,642 |
| Events in quadrant C | 12,601,121 | 298,225 |
| Events in quadrant D | 5,719,115 | 566,943 |
| Mode M0 | |||
|---|---|---|---|
| Quadrant | BADHDUFLAG | Total packets | Discarded packets |
| A | 0 | 23650 | 5 |
| B | 0 | 16644 | 2 |
| C | 0 | 41963 | 2 |
| D | 0 | 21573 | 2 |
| Mode M9 | |||
|---|---|---|---|
| Quadrant | BADHDUFLAG | Total packets | Discarded packets |
| A | 0 | 17 | 0 |
| B | 0 | 17 | 0 |
| C | 0 | 18 | 0 |
| D | 0 | 18 | 0 |
| Mode SS | |||
|---|---|---|---|
| Quadrant | BADHDUFLAG | Total packets | Discarded packets |
| A | 0 | 134 | 0 |
| B | 0 | 134 | 0 |
| C | 0 | 134 | 0 |
| D | 0 | 134 | 0 |
| Quadrant | Total seconds | Saturated seconds | Saturation percentage |
|---|---|---|---|
| A | 6569 | 1117 | 17.004110% |
| B | 6569 | 250 | 3.805754% |
| C | 6569 | 3868 | 58.882631% |
| D | 6569 | 417 | 6.347998% |
Noise dominated data is calculated using 1-second bins in cleaned event files. If a bin has >2000 counts, and if more than 50% of those come from <1% of pixels, then it is considered to be noise-dominated and hence unusable.
| Quadrant | # 1 sec bins | Bins with >0 counts | Bins with >2000 counts | High rate bins dominated by noise | Noise dominated (total time) | Noise dominated (detector-on time) | Marked lightcurve |
|---|---|---|---|---|---|---|---|
| A | 7739 | 6568 | 1055 | 1055 | 13.63% | 16.06% | 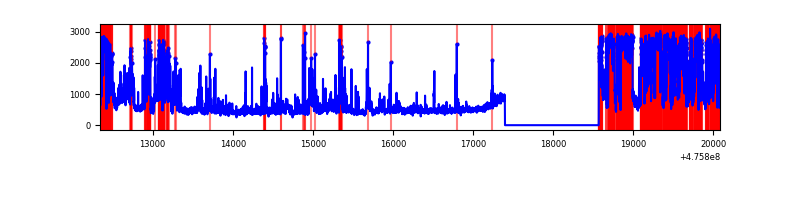 |
| B | 7740 | 6569 | 113 | 113 | 1.46% | 1.72% | 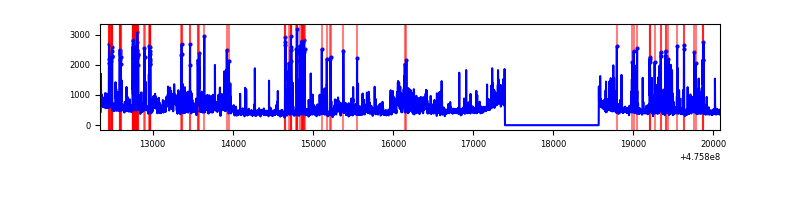 |
| C | 7739 | 6568 | 3637 | 3637 | 47.00% | 55.37% | 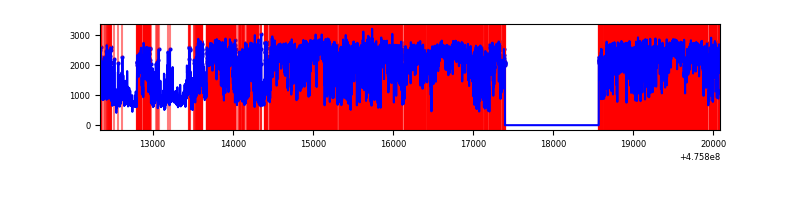 |
| D | 7740 | 6569 | 344 | 344 | 4.44% | 5.24% | 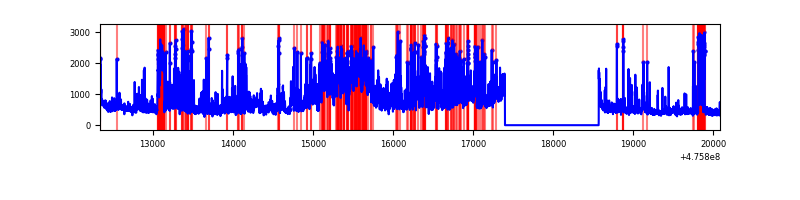 |
Top three noisy pixels from each quadrant. If the there are fewer than three noisy pixels in the level2.evt file, extra rows are filled as -1
| Pixel properties | Quadrant properties | ||||||
|---|---|---|---|---|---|---|---|
| Quadrant | DetID | PixID | Counts | Sigma | Mean | Median | Sigma |
| A | 10 | 253 | 2700053 | 16441.73 | 661 | 646 | 164.2 |
| A | 10 | 251 | 232403 | 1411.6 | 661 | 646 | 164.2 |
| A | 12 | 250 | 191409 | 1161.91 | 661 | 646 | 164.2 |
| B | 1 | 238 | 405135 | 2638.08 | 719 | 694 | 153.3 |
| B | 4 | 170 | 328181 | 2136.12 | 719 | 694 | 153.3 |
| B | 5 | 79 | 109993 | 712.93 | 719 | 694 | 153.3 |
| C | 12 | 249 | 5334096 | 38269.99 | 498 | 494 | 139.4 |
| C | 15 | 235 | 1726821 | 12386.85 | 498 | 494 | 139.4 |
| C | 15 | 196 | 1031203 | 7395.61 | 498 | 494 | 139.4 |
| D | 7 | 77 | 955688 | 5058.88 | 683 | 657 | 188.8 |
| D | 2 | 165 | 515215 | 2725.66 | 683 | 657 | 188.8 |
| D | 7 | 96 | 300417 | 1587.85 | 683 | 657 | 188.8 |
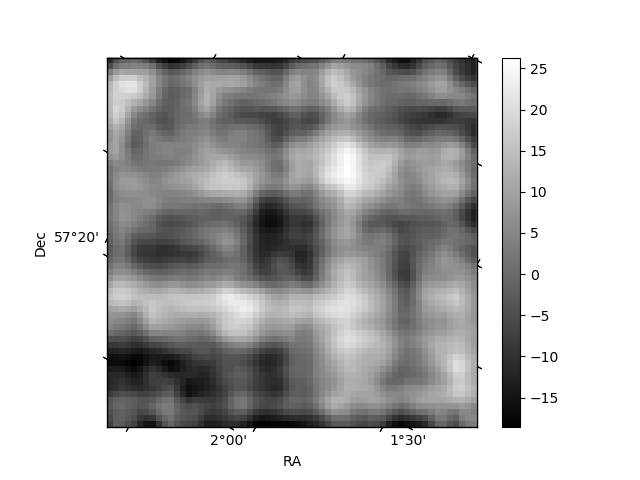
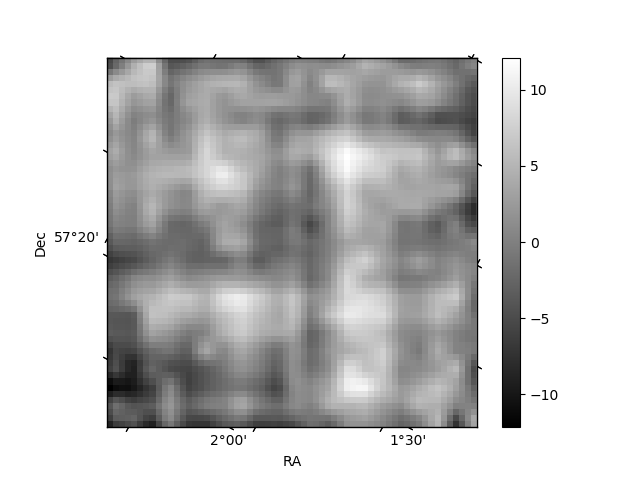
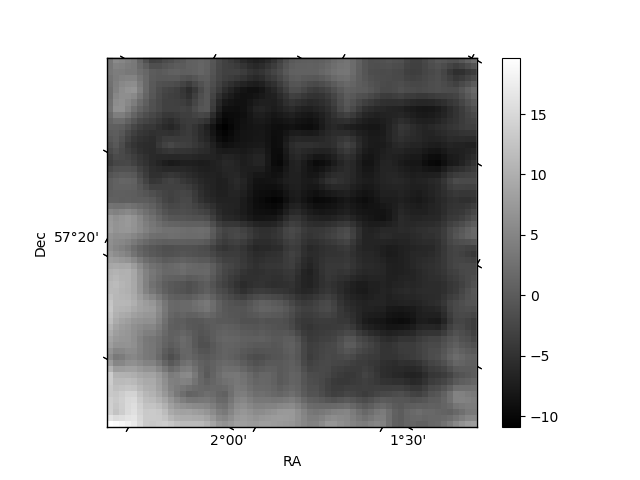
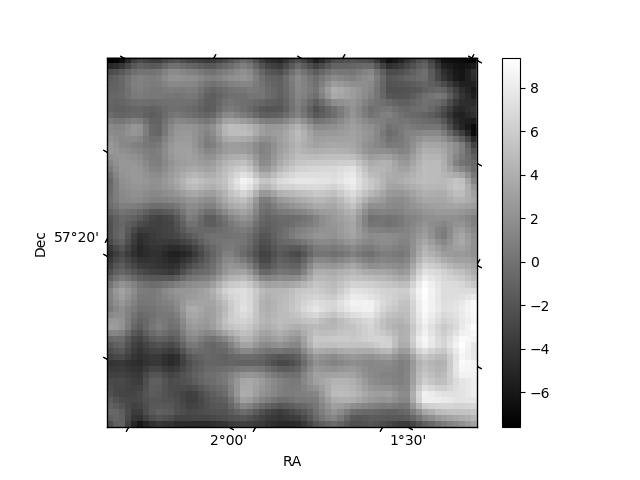
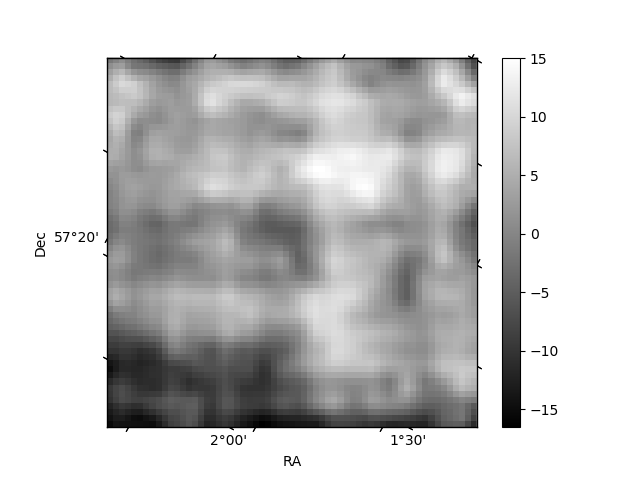
Histogram calculated using DETX and DETY for each event in the final _common_clean file
| Quadrant A | 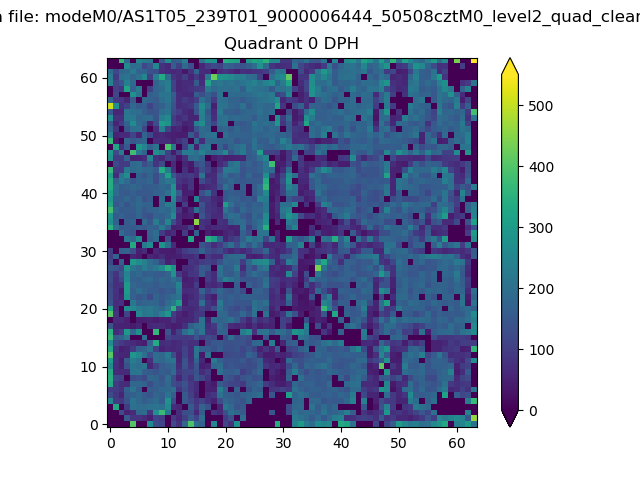 |
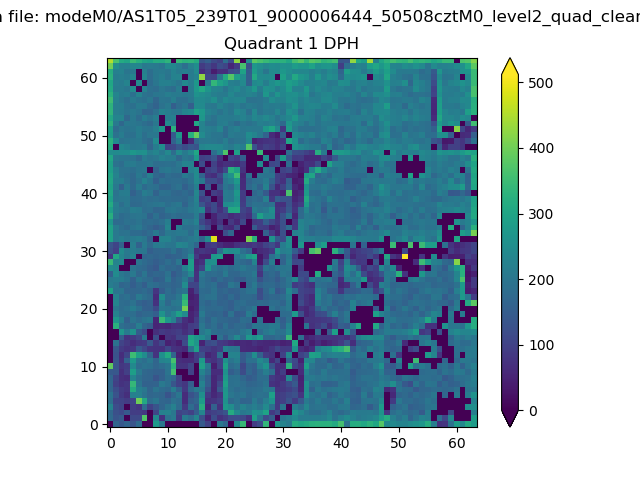 |
Quadrant B |
|---|---|---|---|
| Quadrant D | 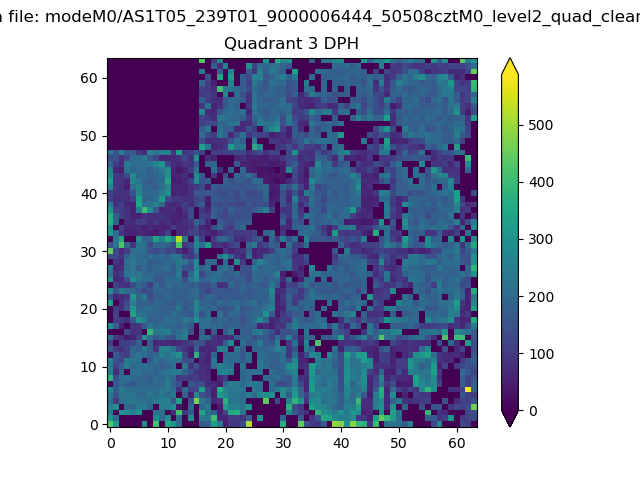 |
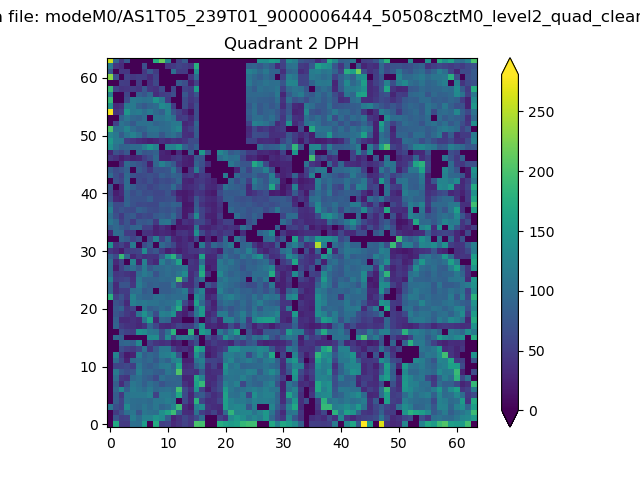 |
Quadrant C |
| Plot type | Count rate plots | Images |
|---|---|---|
| Comparison with Poisson distribution Blue bars denote a histogram of data divided into 1 sec bins. Red curve is a Poisson curve with rate = median count rate of data. |
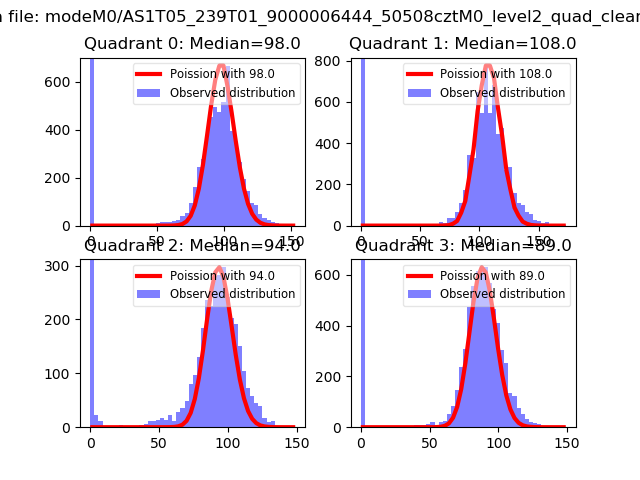 |
 |
| Quadrant-wise count rates Data is divided into 100 sec bins |
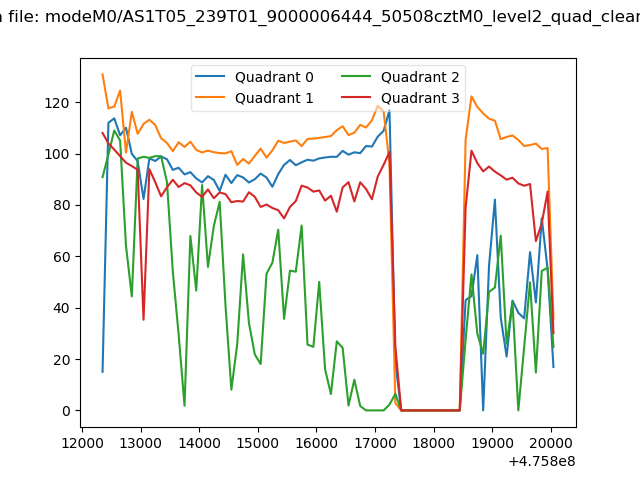 |
|
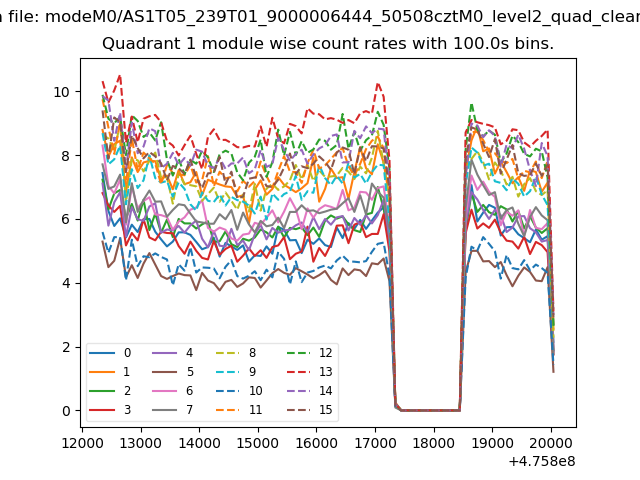
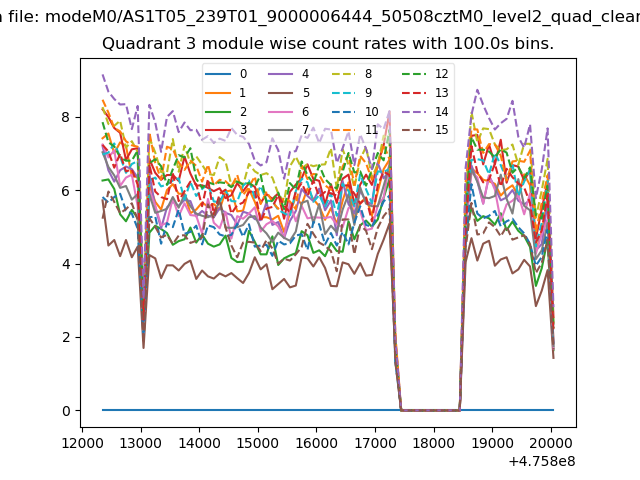
| Module-wise count rates for Quadrant A Data is divided into 100 sec bins |
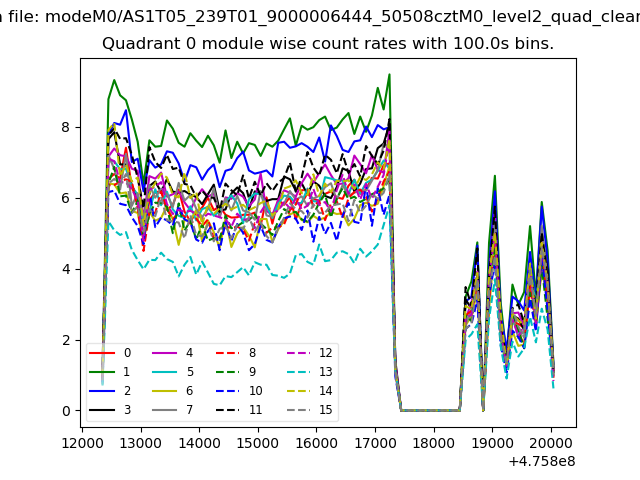 |
 |
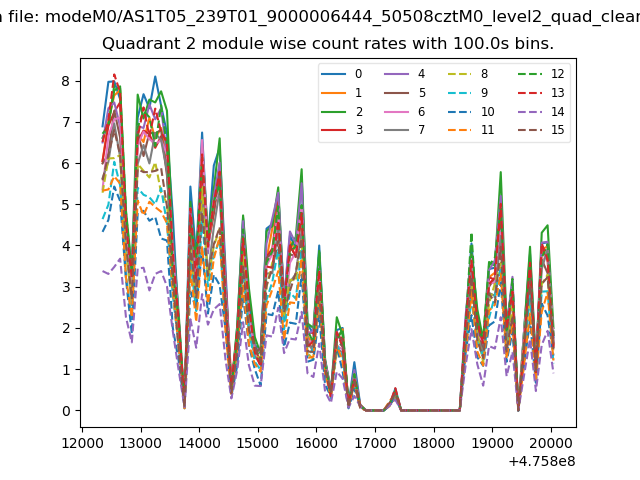
| Module-wise count rates for Quadrant B Data is divided into 100 sec bins |
 |
 |
| Module-wise count rates for Quadrant C Data is divided into 100 sec bins |
 |
 |
| Module-wise count rates for Quadrant D Data is divided into 100 sec bins |
 |
 |
| Parameter | Plot |
|---|---|
| CZT HV Monitor | 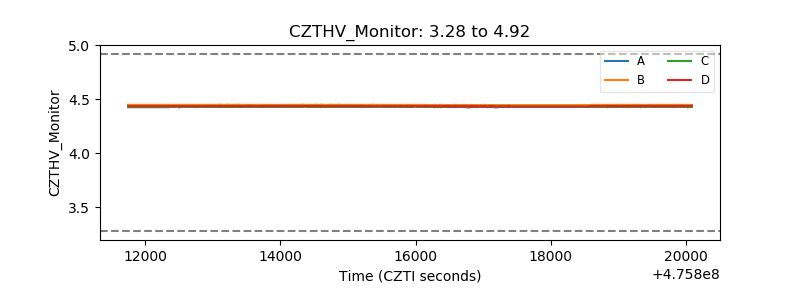 |
| D_VDD | 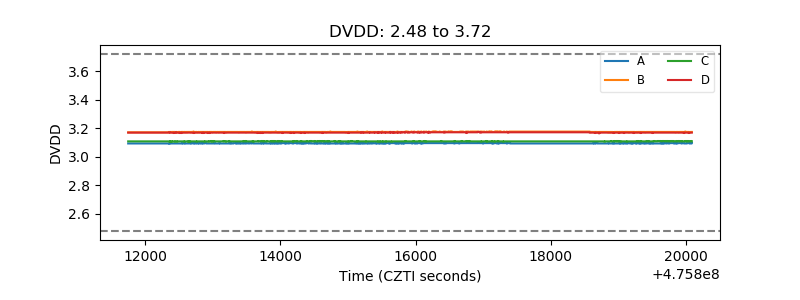 |
| Temperature 1 | 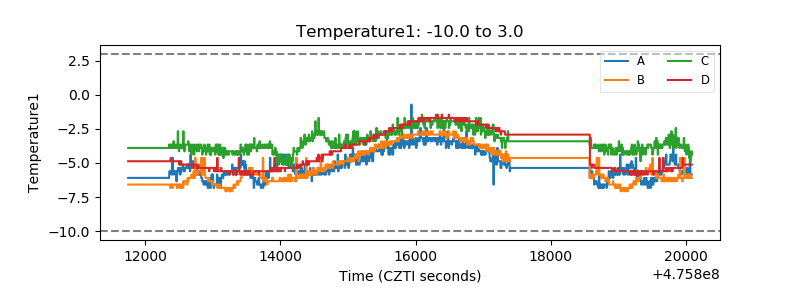 |
| Veto HV Monitor | 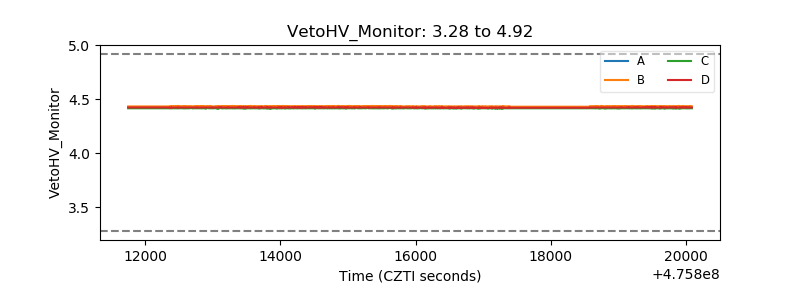 |
| Veto LLD | 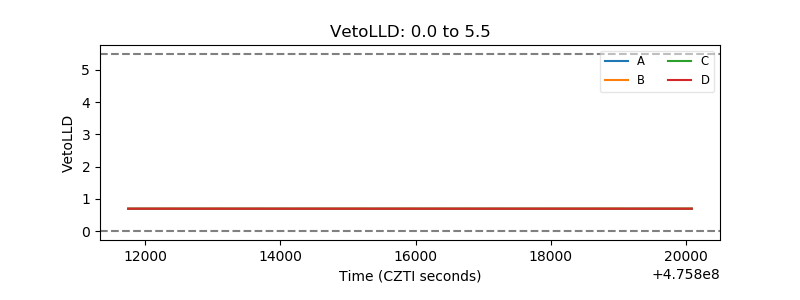 |
| Alpha Counter | 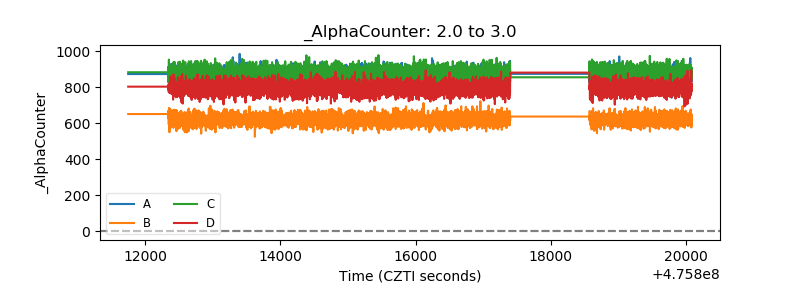 |
| _CPM_Rate | 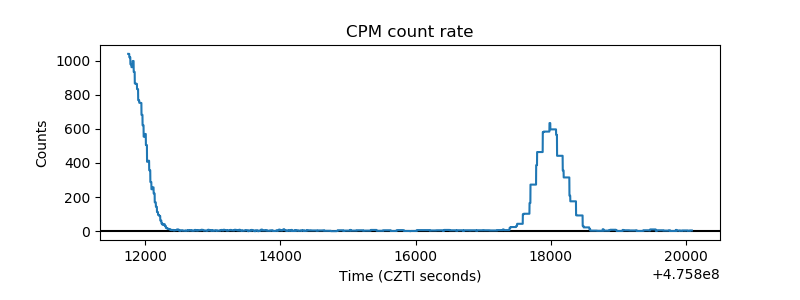 |
| CZT Counter | 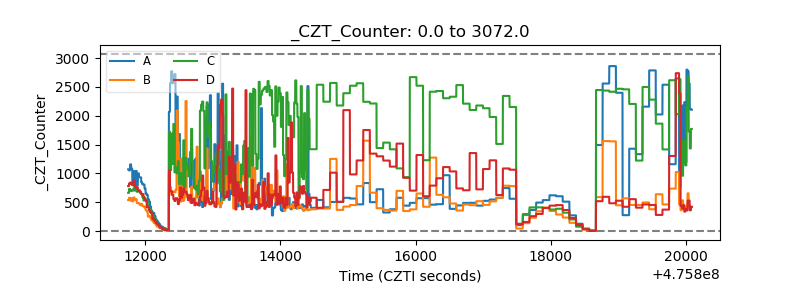 |
| +2.5 Volts monitor | 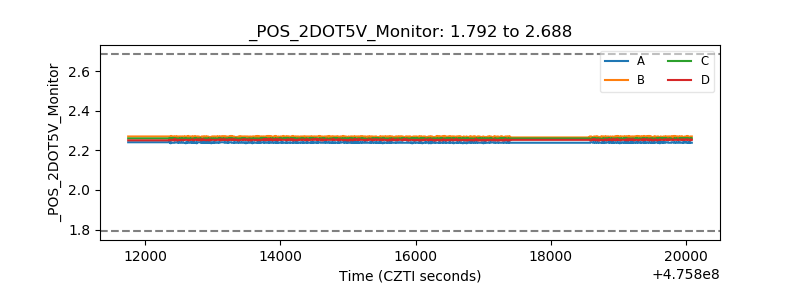 |
| +5 Volts monitor |  |
| _ROLL_ROT | 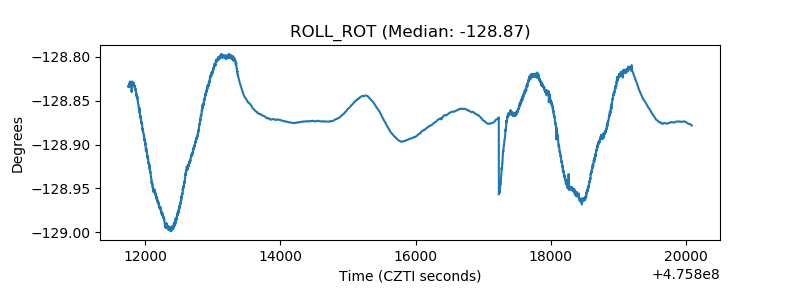 |
| _Roll_DEC | 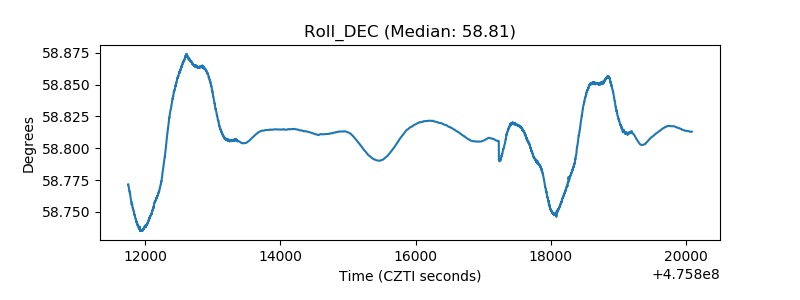 |
| _Roll_RA | 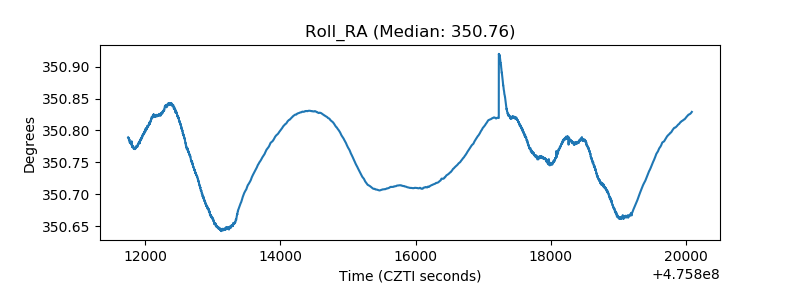 |
| Veto Counter | 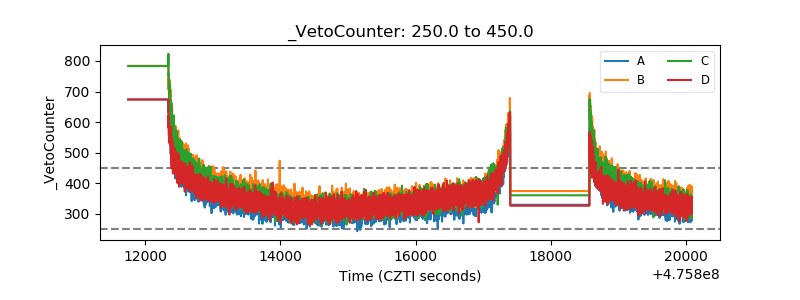 |