| Param | Original file | Final file |
|---|---|---|
| Filename | modeM0/AS1T05_239T01_9000006444_50509cztM0_level2.fits | modeM0/AS1T05_239T01_9000006444_50509cztM0_level2_quad_clean.evt |
| Size (bytes) | 582,289,920 | 77,368,320 |
| Size | 555.3 MB | 73.8 MB |
| Events in quadrant A | 5,766,411 | 467,937 |
| Events in quadrant B | 3,072,509 | 590,804 |
| Events in quadrant C | 7,314,284 | 424,232 |
| Events in quadrant D | 4,958,249 | 459,772 |
| Mode M0 | |||
|---|---|---|---|
| Quadrant | BADHDUFLAG | Total packets | Discarded packets |
| A | 0 | 21112 | 1 |
| B | 0 | 13215 | 1 |
| C | 0 | 25719 | 1 |
| D | 0 | 18780 | 1 |
| Mode M9 | |||
|---|---|---|---|
| Quadrant | BADHDUFLAG | Total packets | Discarded packets |
| A | 0 | 10 | 0 |
| B | 0 | 10 | 0 |
| C | 0 | 10 | 0 |
| D | 0 | 10 | 0 |
| Mode SS | |||
|---|---|---|---|
| Quadrant | BADHDUFLAG | Total packets | Discarded packets |
| A | 0 | 118 | 0 |
| B | 0 | 118 | 0 |
| C | 0 | 118 | 0 |
| D | 0 | 118 | 0 |
| Quadrant | Total seconds | Saturated seconds | Saturation percentage |
|---|---|---|---|
| A | 5712 | 979 | 17.139356% |
| B | 5712 | 159 | 2.783613% |
| C | 5712 | 1402 | 24.544818% |
| D | 5713 | 620 | 10.852442% |
Noise dominated data is calculated using 1-second bins in cleaned event files. If a bin has >2000 counts, and if more than 50% of those come from <1% of pixels, then it is considered to be noise-dominated and hence unusable.
| Quadrant | # 1 sec bins | Bins with >0 counts | Bins with >2000 counts | High rate bins dominated by noise | Noise dominated (total time) | Noise dominated (detector-on time) | Marked lightcurve |
|---|---|---|---|---|---|---|---|
| A | 6747 | 5712 | 870 | 870 | 12.89% | 15.23% | 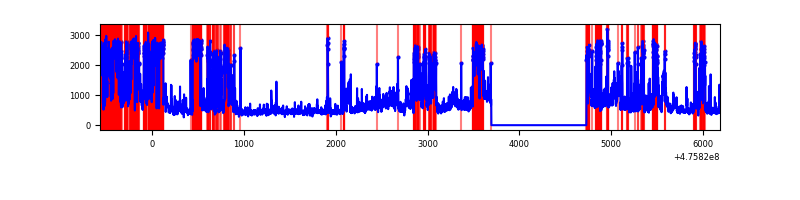 |
| B | 6747 | 5712 | 55 | 55 | 0.82% | 0.96% | 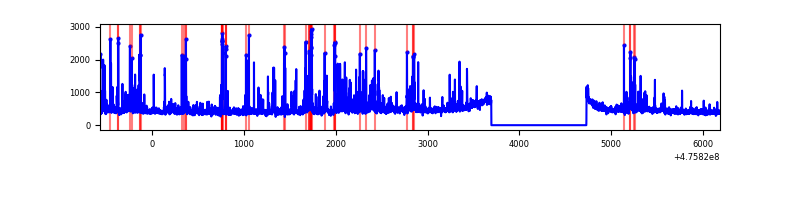 |
| C | 6747 | 5712 | 1300 | 1300 | 19.27% | 22.76% | 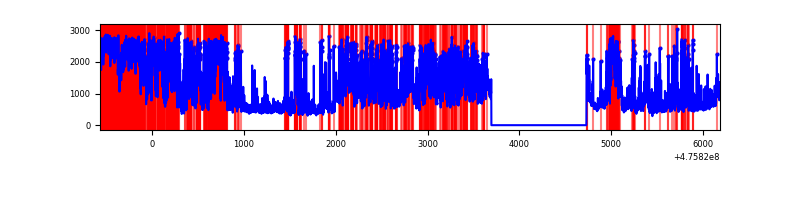 |
| D | 6748 | 5713 | 553 | 553 | 8.20% | 9.68% | 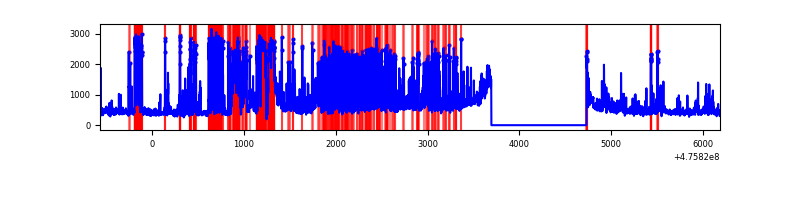 |
Top three noisy pixels from each quadrant. If the there are fewer than three noisy pixels in the level2.evt file, extra rows are filled as -1
| Pixel properties | Quadrant properties | ||||||
|---|---|---|---|---|---|---|---|
| Quadrant | DetID | PixID | Counts | Sigma | Mean | Median | Sigma |
| A | 10 | 253 | 2539352 | 17917.15 | 572 | 557 | 141.7 |
| A | 12 | 250 | 210191 | 1479.46 | 572 | 557 | 141.7 |
| A | 10 | 251 | 165242 | 1162.24 | 572 | 557 | 141.7 |
| B | 1 | 238 | 218113 | 1657.34 | 613 | 592 | 131.2 |
| B | 4 | 170 | 126753 | 961.25 | 613 | 592 | 131.2 |
| B | 6 | 203 | 70780 | 534.78 | 613 | 592 | 131.2 |
| C | 15 | 235 | 1436773 | 9320.77 | 548 | 543 | 154.1 |
| C | 0 | 208 | 914324 | 5930.21 | 548 | 543 | 154.1 |
| C | 12 | 247 | 535129 | 3469.33 | 548 | 543 | 154.1 |
| D | 7 | 77 | 804632 | 5118.56 | 567 | 548 | 157.1 |
| D | 6 | 42 | 639322 | 4066.25 | 567 | 548 | 157.1 |
| D | 7 | 96 | 242926 | 1542.9 | 567 | 548 | 157.1 |
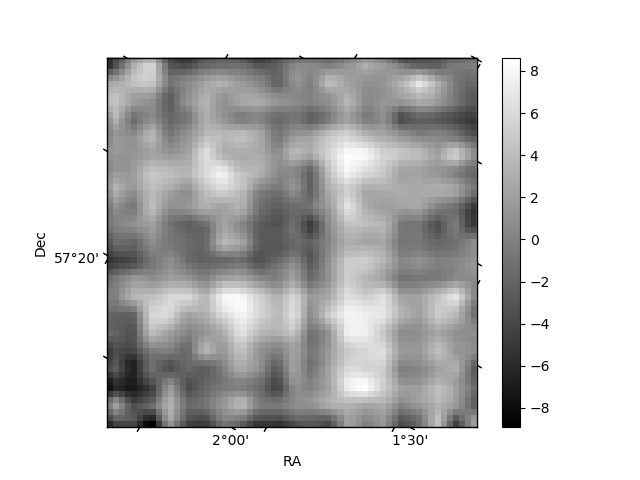
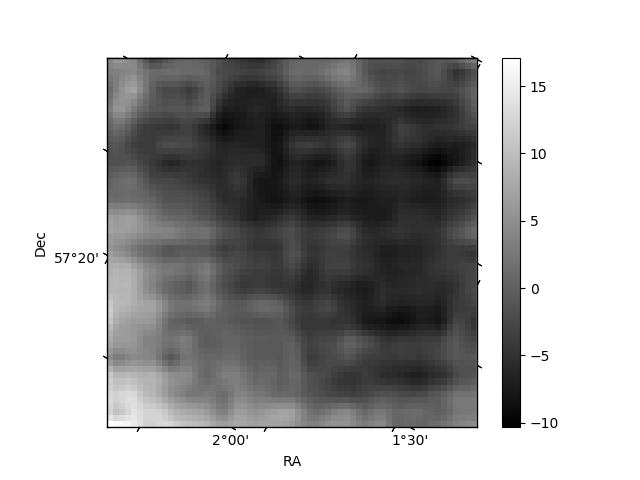
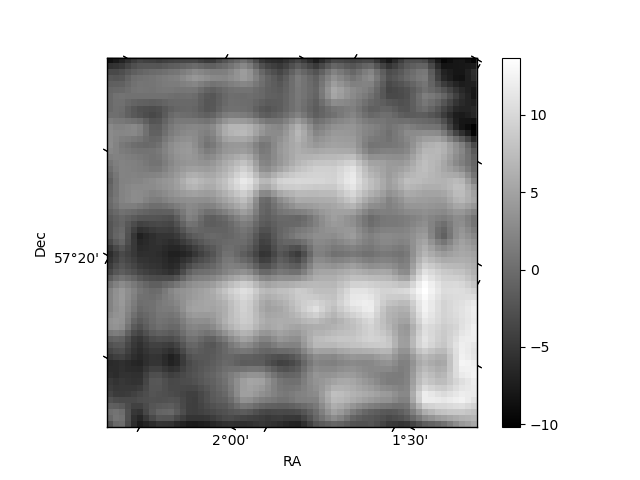
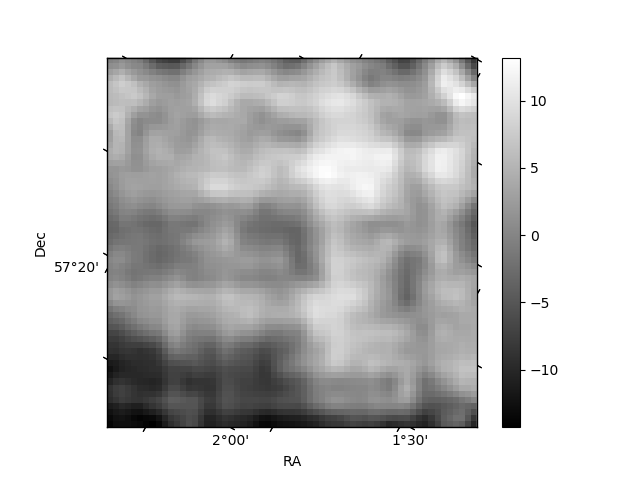
Histogram calculated using DETX and DETY for each event in the final _common_clean file
| Quadrant A | 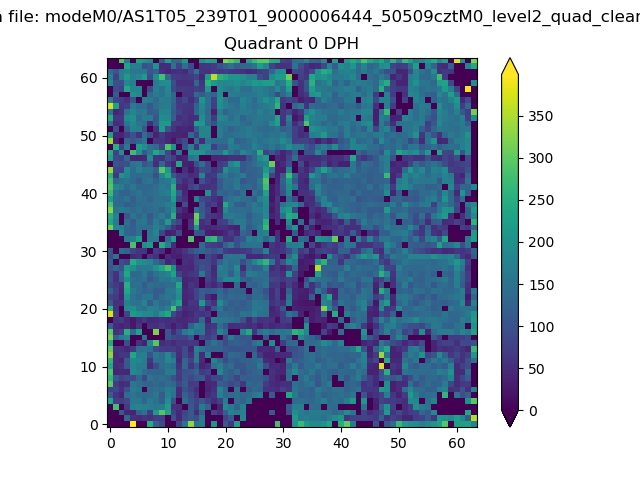 |
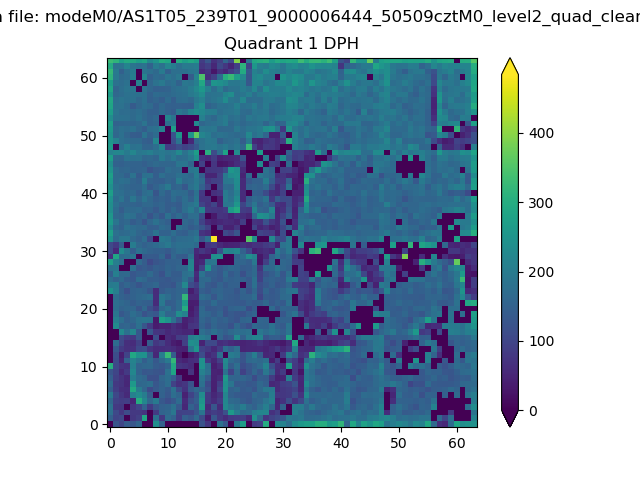 |
Quadrant B |
|---|---|---|---|
| Quadrant D | 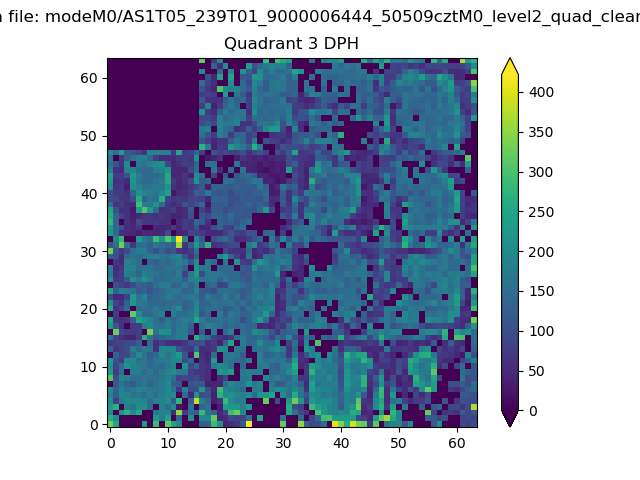 |
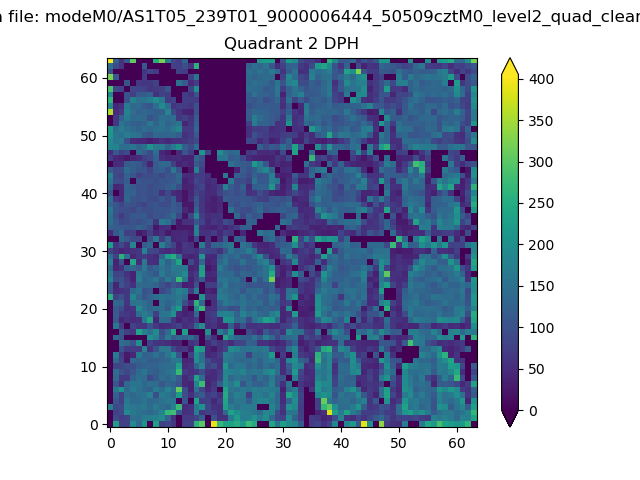 |
Quadrant C |
| Plot type | Count rate plots | Images |
|---|---|---|
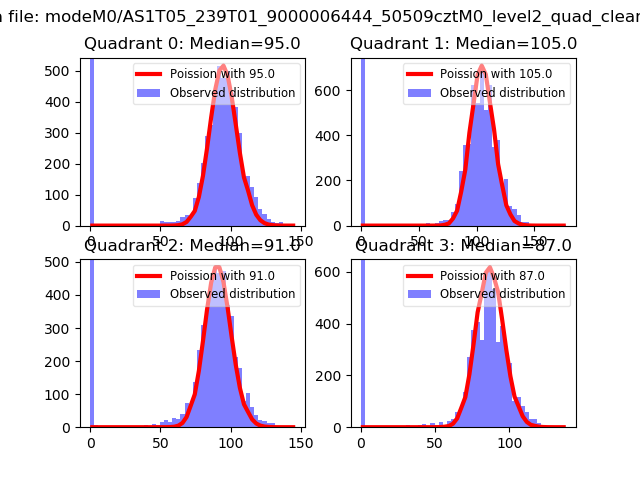
| Comparison with Poisson distribution Blue bars denote a histogram of data divided into 1 sec bins. Red curve is a Poisson curve with rate = median count rate of data. |
 |
 |
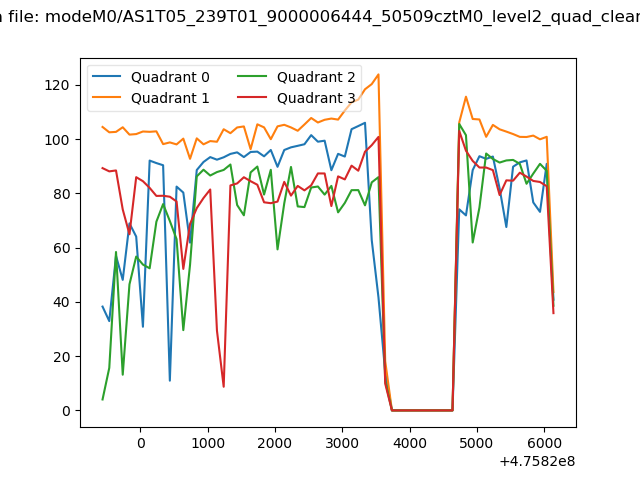
| Quadrant-wise count rates Data is divided into 100 sec bins |
 |
|
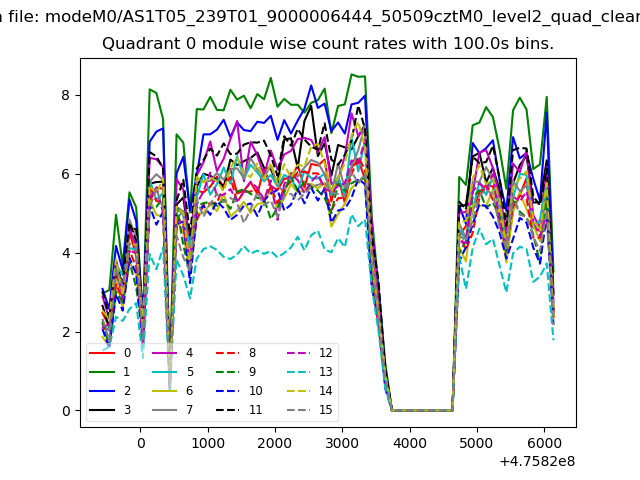
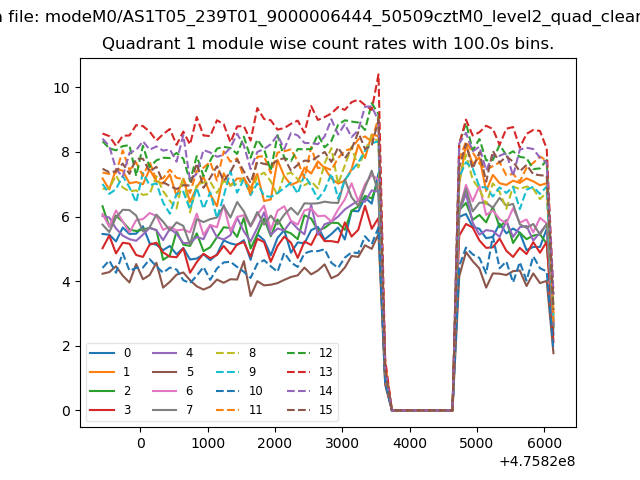
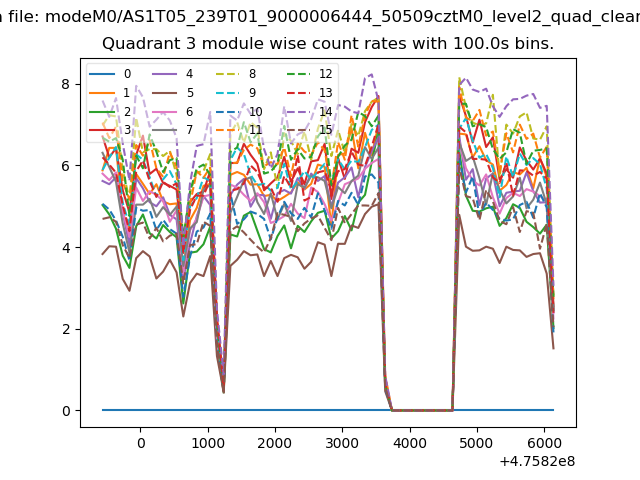
| Module-wise count rates for Quadrant A Data is divided into 100 sec bins |
 |
 |
| Module-wise count rates for Quadrant B Data is divided into 100 sec bins |
 |
 |
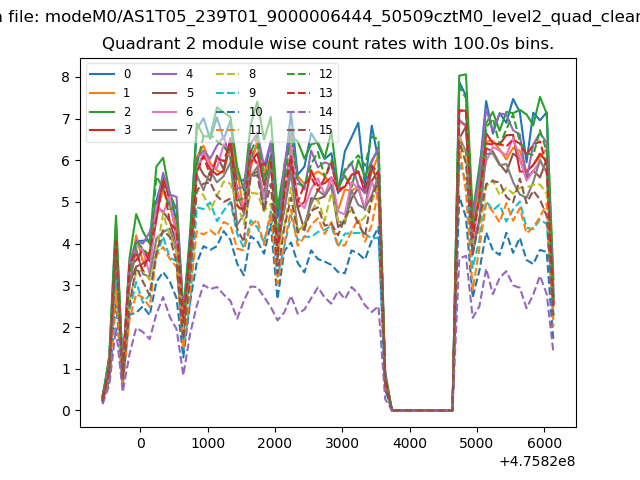
| Module-wise count rates for Quadrant C Data is divided into 100 sec bins |
 |
 |
| Module-wise count rates for Quadrant D Data is divided into 100 sec bins |
 |
 |
| Parameter | Plot |
|---|---|
| CZT HV Monitor | 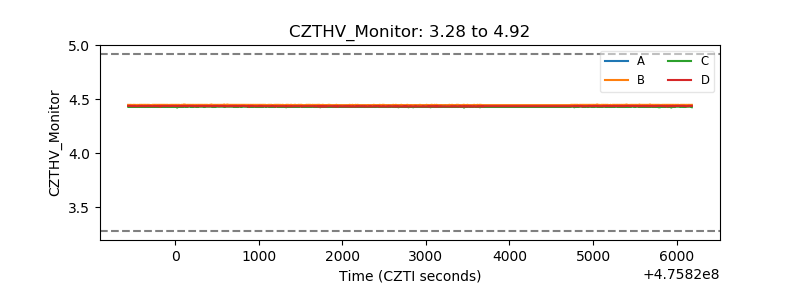 |
| D_VDD | 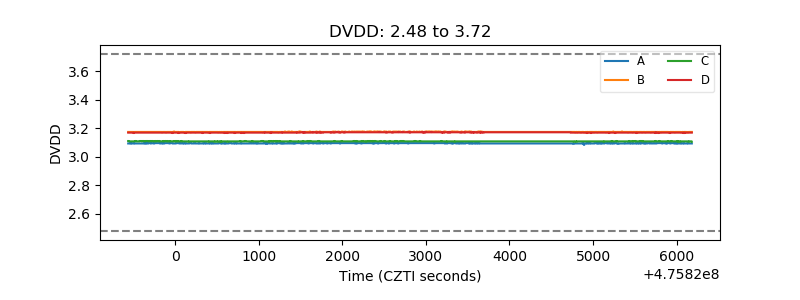 |
| Temperature 1 | 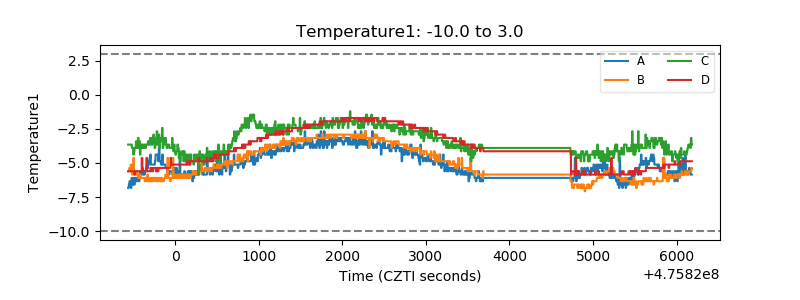 |
| Veto HV Monitor | 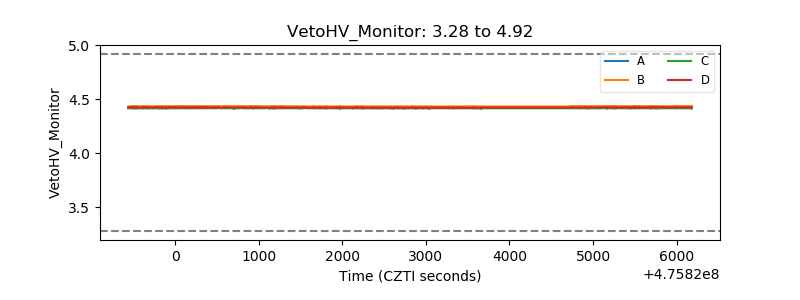 |
| Veto LLD | 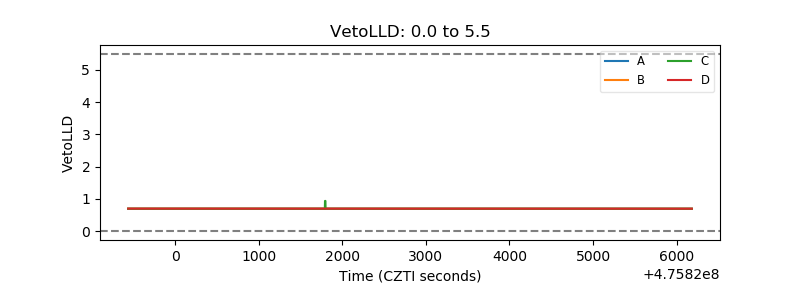 |
| Alpha Counter | 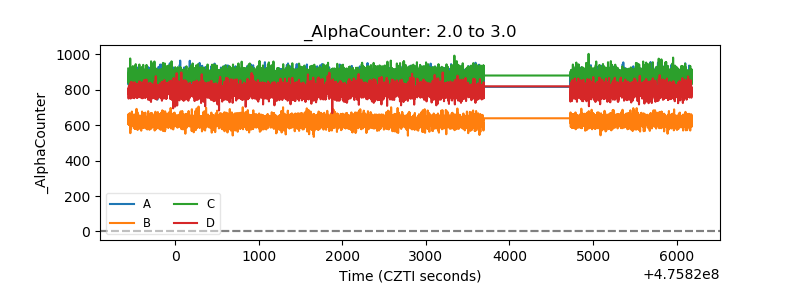 |
| _CPM_Rate | 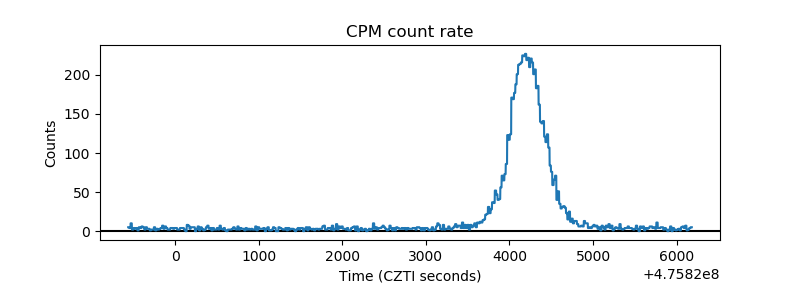 |
| CZT Counter | 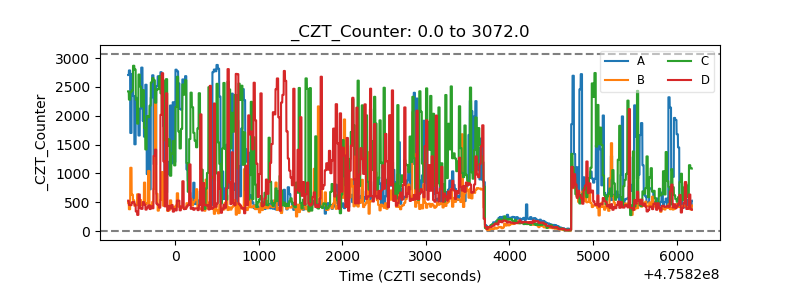 |
| +2.5 Volts monitor | 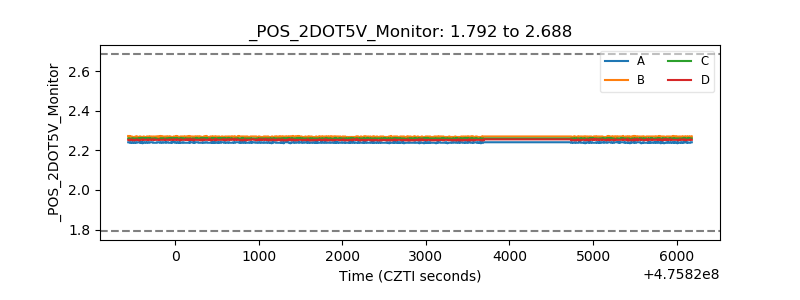 |
| +5 Volts monitor | 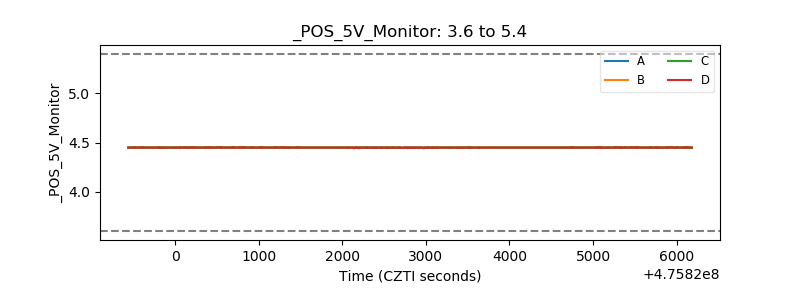 |
| _ROLL_ROT | 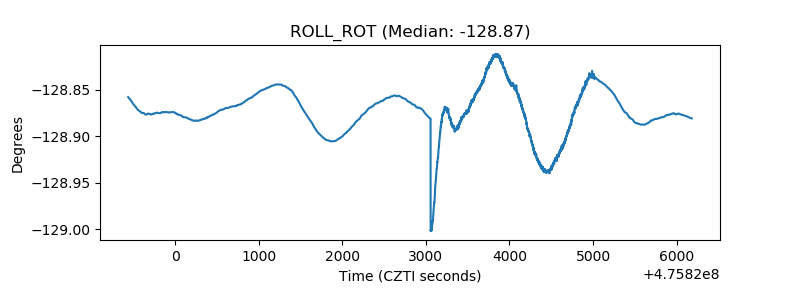 |
| _Roll_DEC | 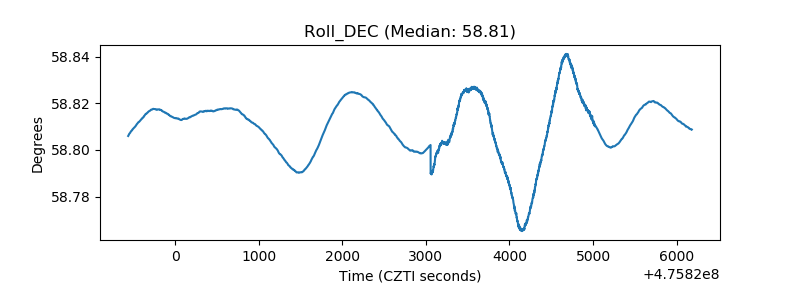 |
| _Roll_RA | 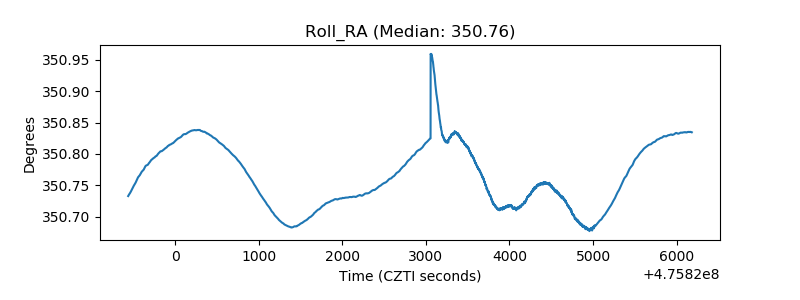 |
| Veto Counter | 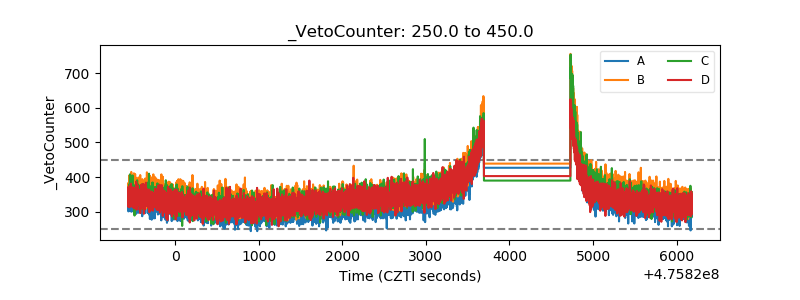 |