| Param | Original file | Final file |
|---|---|---|
| Filename | modeM0/AS1T05_239T01_9000006444_50510cztM0_level2.fits | modeM0/AS1T05_239T01_9000006444_50510cztM0_level2_quad_clean.evt |
| Size (bytes) | 620,795,520 | 91,238,400 |
| Size | 592.0 MB | 87.0 MB |
| Events in quadrant A | 5,895,151 | 571,123 |
| Events in quadrant B | 3,534,734 | 668,652 |
| Events in quadrant C | 8,118,614 | 500,242 |
| Events in quadrant D | 4,914,707 | 557,660 |
| Mode M0 | |||
|---|---|---|---|
| Quadrant | BADHDUFLAG | Total packets | Discarded packets |
| A | 0 | 22019 | 2 |
| B | 0 | 15489 | 1 |
| C | 0 | 28835 | 1 |
| D | 0 | 19328 | 1 |
| Mode M9 | |||
|---|---|---|---|
| Quadrant | BADHDUFLAG | Total packets | Discarded packets |
| A | 0 | 7 | 0 |
| B | 0 | 7 | 0 |
| C | 0 | 7 | 0 |
| D | 0 | 7 | 0 |
| Mode SS | |||
|---|---|---|---|
| Quadrant | BADHDUFLAG | Total packets | Discarded packets |
| A | 0 | 136 | 0 |
| B | 0 | 136 | 0 |
| C | 0 | 136 | 0 |
| D | 0 | 136 | 0 |
| Quadrant | Total seconds | Saturated seconds | Saturation percentage |
|---|---|---|---|
| A | 6664 | 735 | 11.029412% |
| B | 6665 | 240 | 3.600900% |
| C | 6665 | 1406 | 21.095274% |
| D | 6665 | 218 | 3.270818% |
Noise dominated data is calculated using 1-second bins in cleaned event files. If a bin has >2000 counts, and if more than 50% of those come from <1% of pixels, then it is considered to be noise-dominated and hence unusable.
| Quadrant | # 1 sec bins | Bins with >0 counts | Bins with >2000 counts | High rate bins dominated by noise | Noise dominated (total time) | Noise dominated (detector-on time) | Marked lightcurve |
|---|---|---|---|---|---|---|---|
| A | 7408 | 6663 | 636 | 636 | 8.59% | 9.55% | 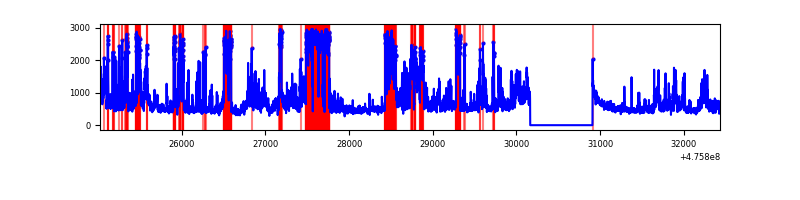 |
| B | 7410 | 6665 | 89 | 89 | 1.20% | 1.34% | 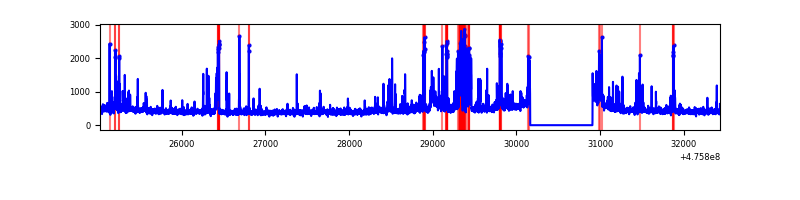 |
| C | 7409 | 6664 | 1354 | 1354 | 18.28% | 20.32% | 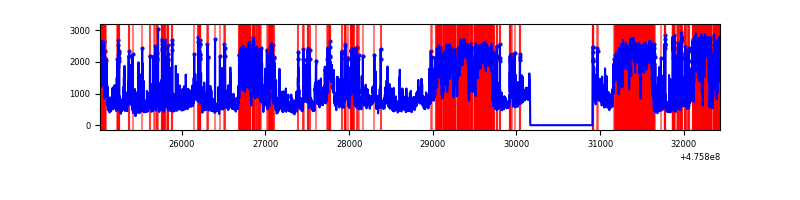 |
| D | 7409 | 6665 | 149 | 149 | 2.01% | 2.24% | 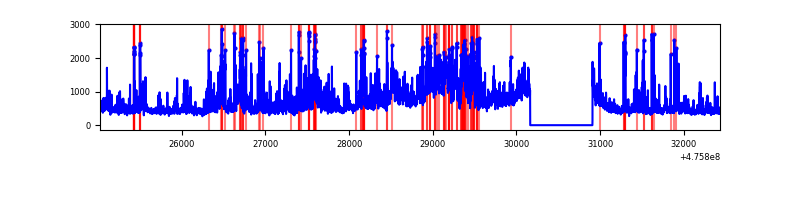 |
Top three noisy pixels from each quadrant. If the there are fewer than three noisy pixels in the level2.evt file, extra rows are filled as -1
| Pixel properties | Quadrant properties | ||||||
|---|---|---|---|---|---|---|---|
| Quadrant | DetID | PixID | Counts | Sigma | Mean | Median | Sigma |
| A | 10 | 253 | 1938871 | 11577.23 | 680 | 665 | 167.4 |
| A | 9 | 96 | 428205 | 2553.77 | 680 | 665 | 167.4 |
| A | 12 | 250 | 231614 | 1379.5 | 680 | 665 | 167.4 |
| B | 7 | 0 | 299341 | 1989.26 | 702 | 677 | 150.1 |
| B | 8 | 234 | 89704 | 592.97 | 702 | 677 | 150.1 |
| B | 3 | 249 | 79006 | 521.71 | 702 | 677 | 150.1 |
| C | 15 | 235 | 2441963 | 13900.58 | 638 | 633 | 175.6 |
| C | 12 | 247 | 746351 | 4246.01 | 638 | 633 | 175.6 |
| C | 4 | 5 | 465845 | 2648.85 | 638 | 633 | 175.6 |
| D | 7 | 61 | 566716 | 3041.63 | 677 | 654 | 186.1 |
| D | 6 | 42 | 282900 | 1516.6 | 677 | 654 | 186.1 |
| D | 2 | 249 | 278673 | 1493.89 | 677 | 654 | 186.1 |
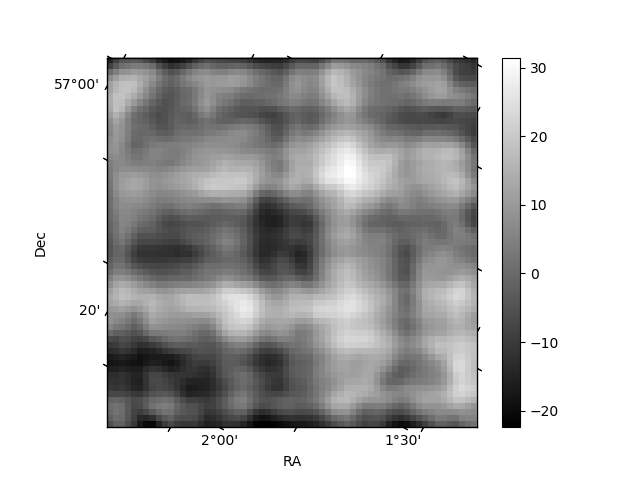
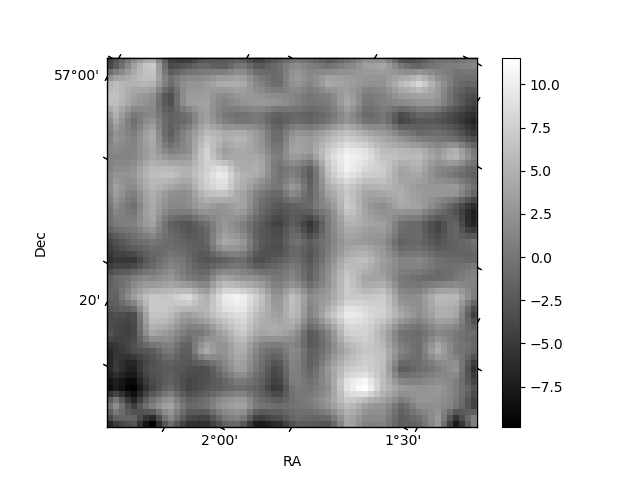
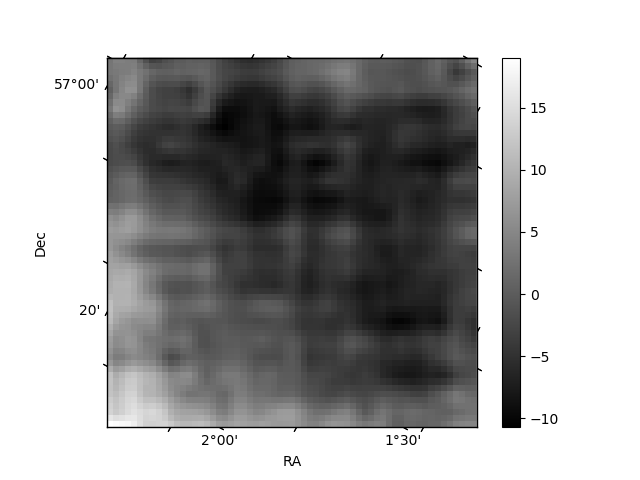
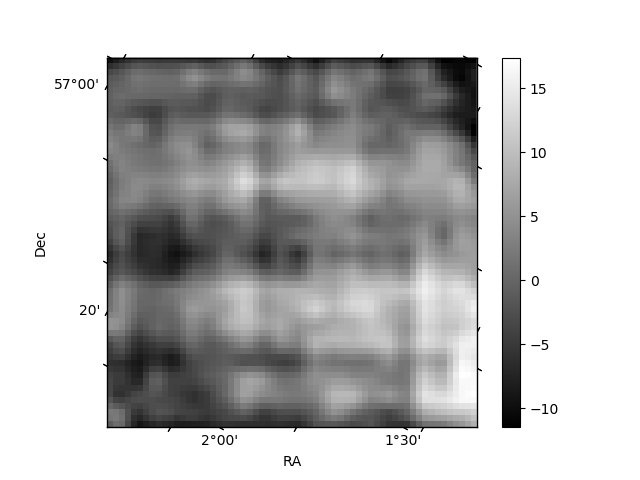
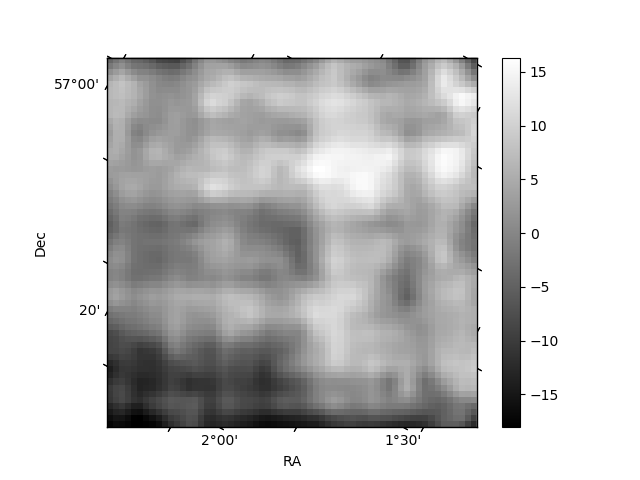
Histogram calculated using DETX and DETY for each event in the final _common_clean file
| Quadrant A | 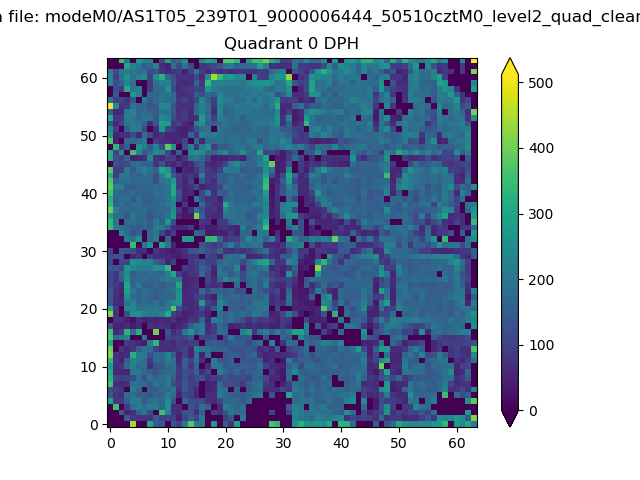 |
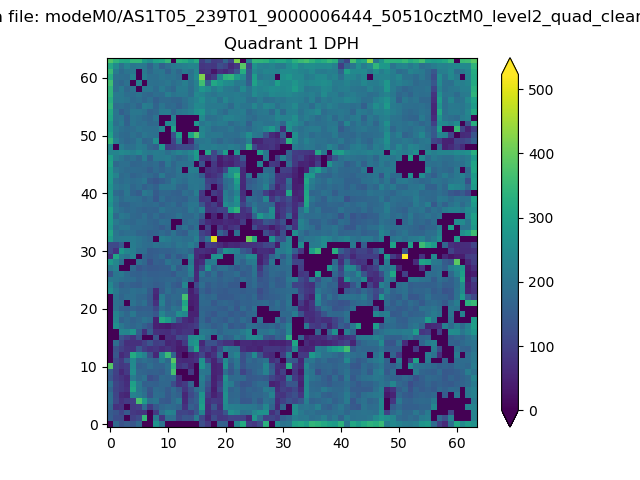 |
Quadrant B |
|---|---|---|---|
| Quadrant D | 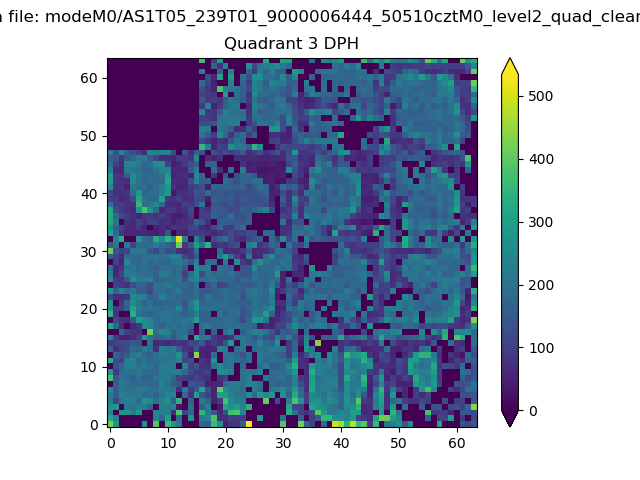 |
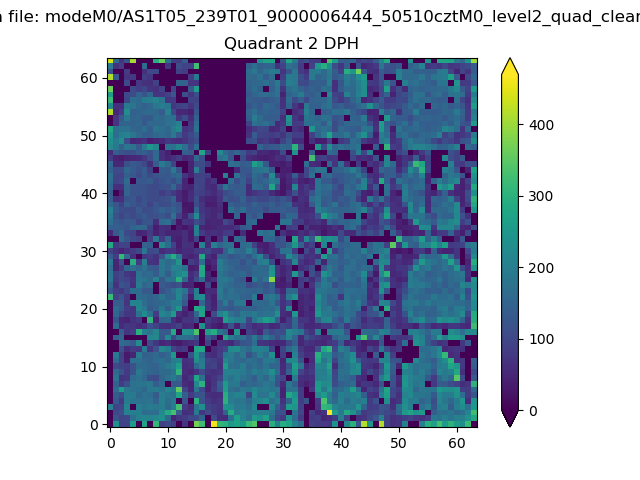 |
Quadrant C |
| Plot type | Count rate plots | Images |
|---|---|---|
| Comparison with Poisson distribution Blue bars denote a histogram of data divided into 1 sec bins. Red curve is a Poisson curve with rate = median count rate of data. |
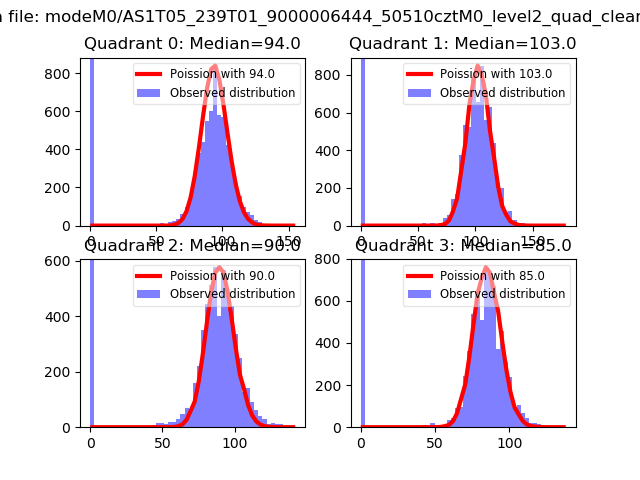 |
 |
| Quadrant-wise count rates Data is divided into 100 sec bins |
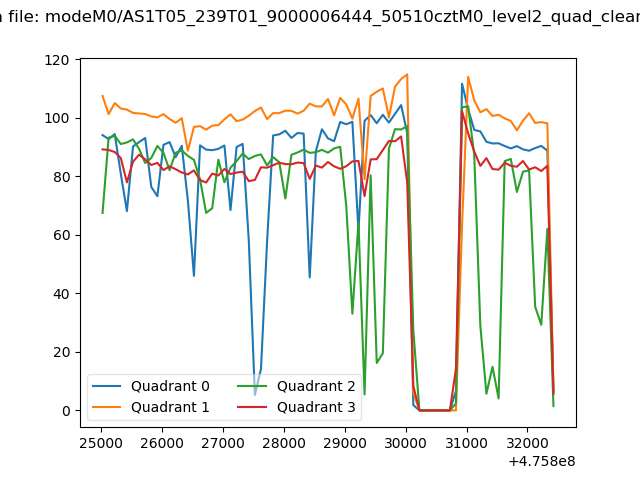 |
|
| Module-wise count rates for Quadrant A Data is divided into 100 sec bins |
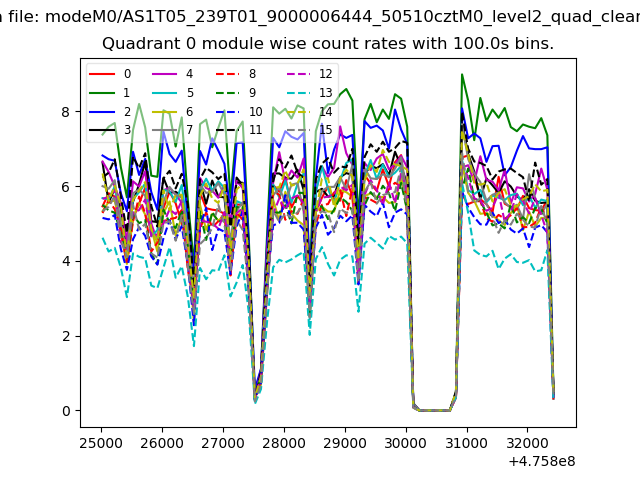 |
 |
| Module-wise count rates for Quadrant B Data is divided into 100 sec bins |
 |
 |
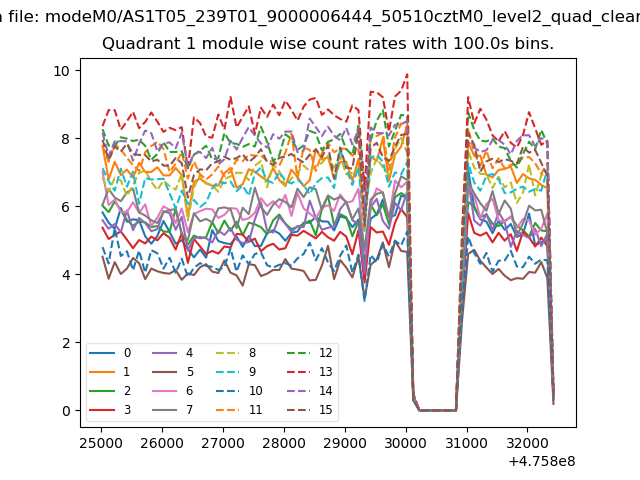
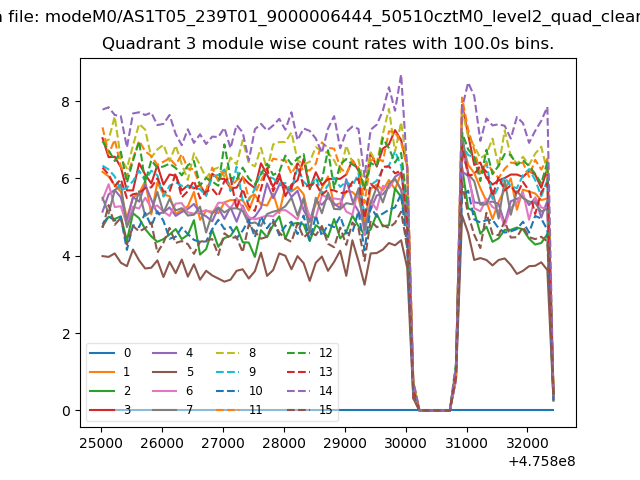
| Module-wise count rates for Quadrant C Data is divided into 100 sec bins |
 |
 |
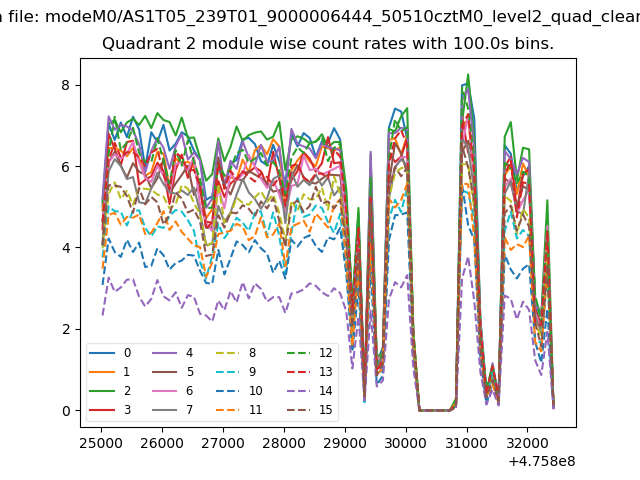
| Module-wise count rates for Quadrant D Data is divided into 100 sec bins |
 |
 |
| Parameter | Plot |
|---|---|
| CZT HV Monitor | 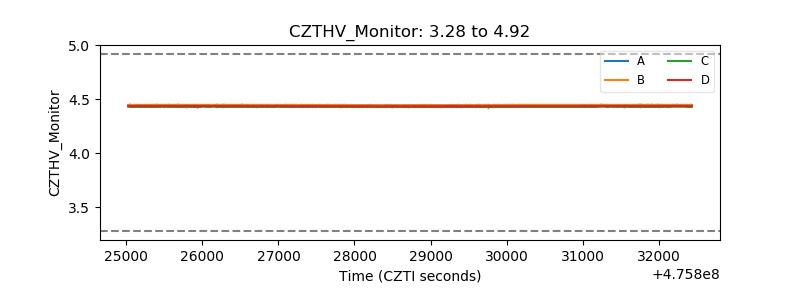 |
| D_VDD |  |
| Temperature 1 | 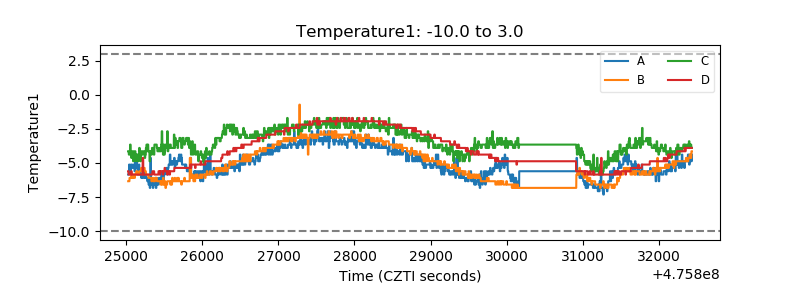 |
| Veto HV Monitor | 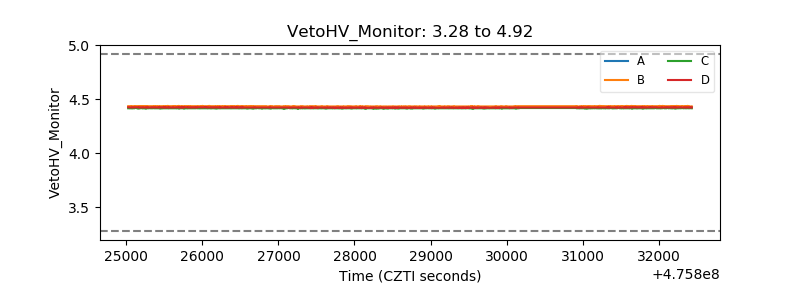 |
| Veto LLD | 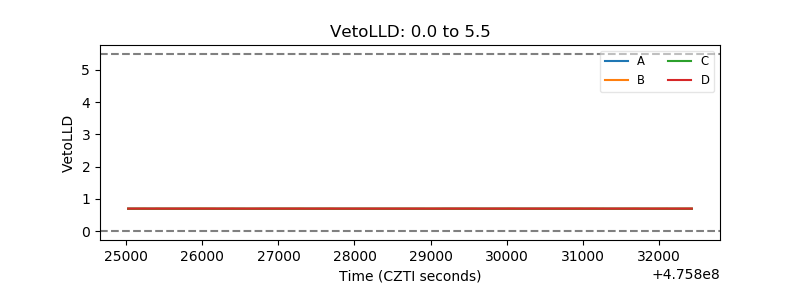 |
| Alpha Counter | 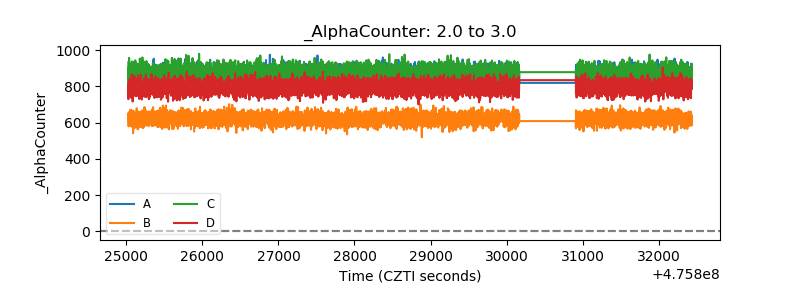 |
| _CPM_Rate | 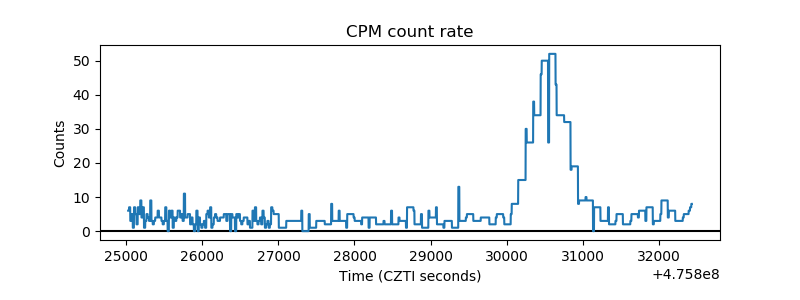 |
| CZT Counter | 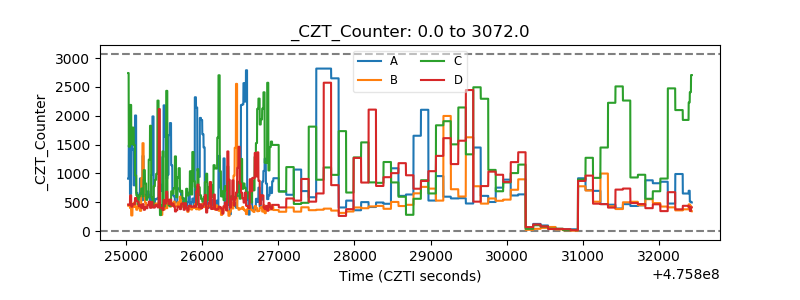 |
| +2.5 Volts monitor |  |
| +5 Volts monitor | 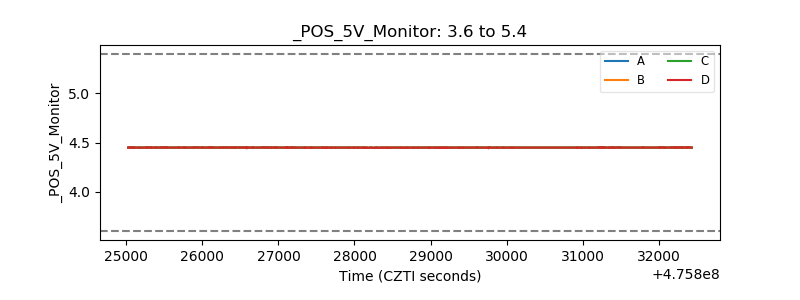 |
| _ROLL_ROT | 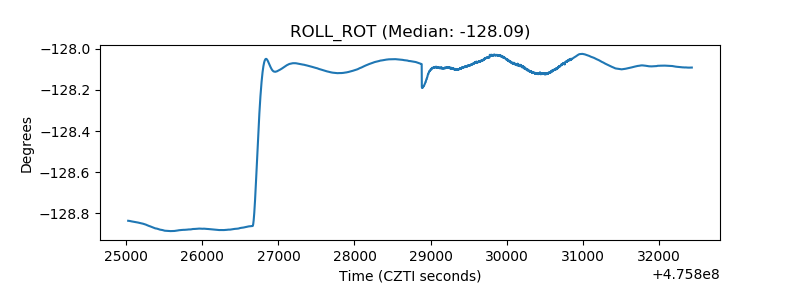 |
| _Roll_DEC | 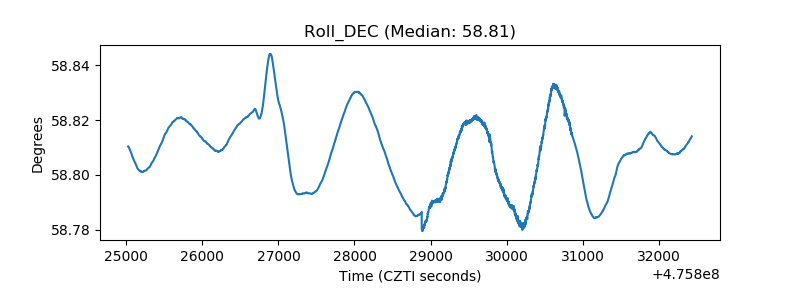 |
| _Roll_RA | 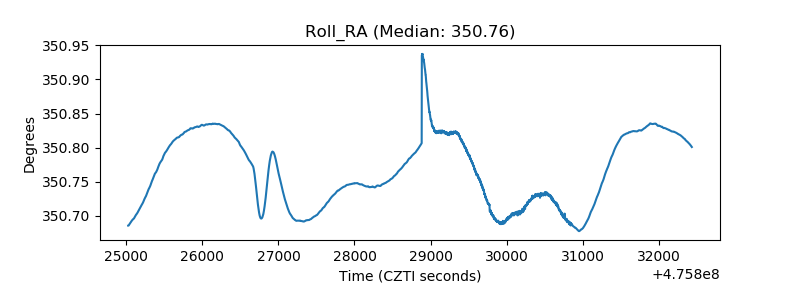 |
| Veto Counter | 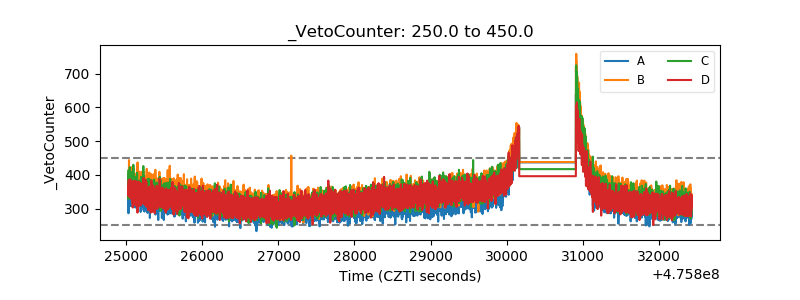 |