| Param | Original file | Final file |
|---|---|---|
| Filename | modeM0/AS1T05_239T01_9000006444_50511cztM0_level2.fits | modeM0/AS1T05_239T01_9000006444_50511cztM0_level2_quad_clean.evt |
| Size (bytes) | 766,748,160 | 95,538,240 |
| Size | 731.2 MB | 91.1 MB |
| Events in quadrant A | 8,151,717 | 532,277 |
| Events in quadrant B | 4,015,956 | 724,969 |
| Events in quadrant C | 9,628,374 | 537,356 |
| Events in quadrant D | 6,027,897 | 595,168 |
| Mode M0 | |||
|---|---|---|---|
| Quadrant | BADHDUFLAG | Total packets | Discarded packets |
| A | 0 | 29171 | 1 |
| B | 0 | 17087 | 3 |
| C | 0 | 33763 | 1 |
| D | 0 | 22943 | 1 |
| Mode SS | |||
|---|---|---|---|
| Quadrant | BADHDUFLAG | Total packets | Discarded packets |
| A | 0 | 144 | 0 |
| B | 0 | 144 | 0 |
| C | 0 | 144 | 0 |
| D | 0 | 144 | 0 |
| Quadrant | Total seconds | Saturated seconds | Saturation percentage |
|---|---|---|---|
| A | 7220 | 1698 | 23.518006% |
| B | 7220 | 295 | 4.085873% |
| C | 7220 | 1616 | 22.382271% |
| D | 7220 | 451 | 6.246537% |
Noise dominated data is calculated using 1-second bins in cleaned event files. If a bin has >2000 counts, and if more than 50% of those come from <1% of pixels, then it is considered to be noise-dominated and hence unusable.
| Quadrant | # 1 sec bins | Bins with >0 counts | Bins with >2000 counts | High rate bins dominated by noise | Noise dominated (total time) | Noise dominated (detector-on time) | Marked lightcurve |
|---|---|---|---|---|---|---|---|
| A | 7239 | 7219 | 1286 | 1286 | 17.76% | 17.81% | 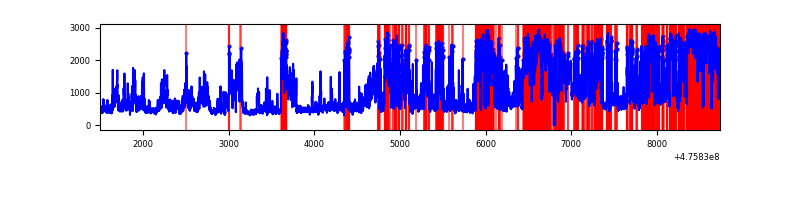 |
| B | 7239 | 7219 | 79 | 79 | 1.09% | 1.09% | 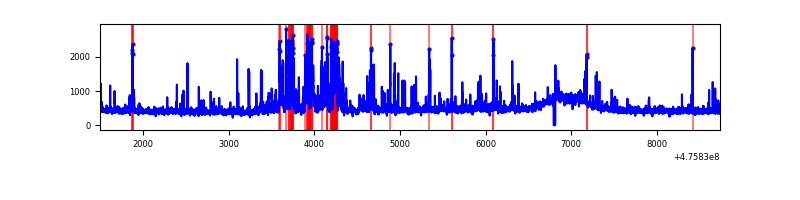 |
| C | 7239 | 7219 | 1487 | 1487 | 20.54% | 20.60% | 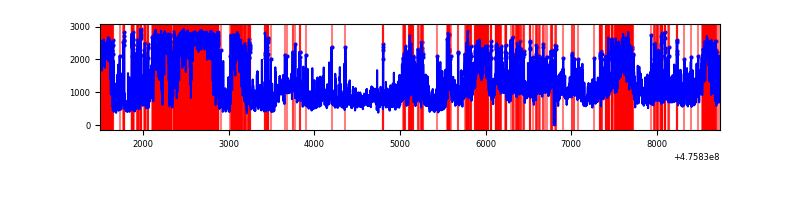 |
| D | 7239 | 7219 | 434 | 434 | 6.00% | 6.01% | 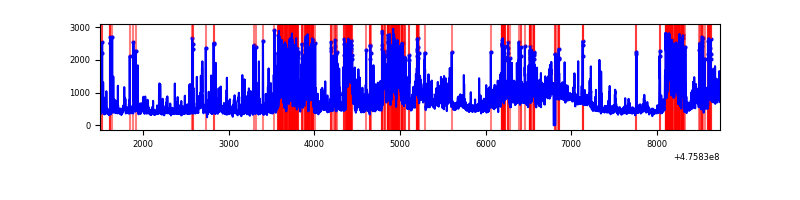 |
Top three noisy pixels from each quadrant. If the there are fewer than three noisy pixels in the level2.evt file, extra rows are filled as -1
| Pixel properties | Quadrant properties | ||||||
|---|---|---|---|---|---|---|---|
| Quadrant | DetID | PixID | Counts | Sigma | Mean | Median | Sigma |
| A | 4 | 249 | 2380680 | 13944.92 | 692 | 674 | 170.7 |
| A | 10 | 253 | 1518411 | 8892.72 | 692 | 674 | 170.7 |
| A | 6 | 161 | 525857 | 3077.15 | 692 | 674 | 170.7 |
| B | 7 | 0 | 537445 | 3166.98 | 786 | 757 | 169.5 |
| B | 3 | 249 | 66698 | 389.11 | 786 | 757 | 169.5 |
| B | 0 | 155 | 42371 | 245.56 | 786 | 757 | 169.5 |
| C | 12 | 247 | 1809966 | 9368.03 | 709 | 705 | 193.1 |
| C | 4 | 5 | 1379567 | 7139.5 | 709 | 705 | 193.1 |
| C | 15 | 235 | 757373 | 3917.89 | 709 | 705 | 193.1 |
| D | 11 | 161 | 589280 | 2815.67 | 758 | 730 | 209.0 |
| D | 6 | 42 | 471182 | 2250.68 | 758 | 730 | 209.0 |
| D | 7 | 60 | 279353 | 1332.95 | 758 | 730 | 209.0 |
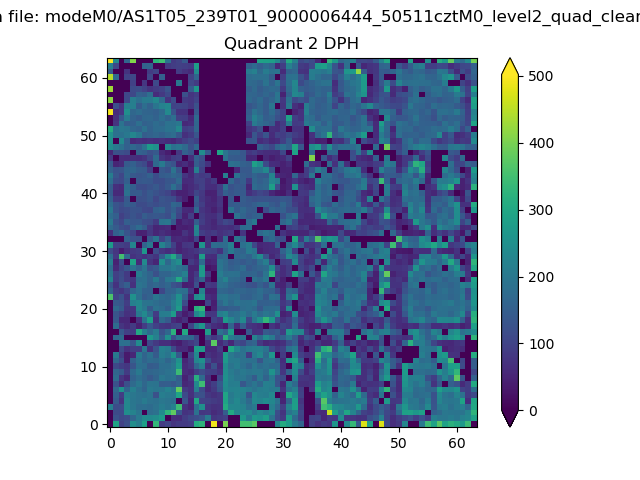
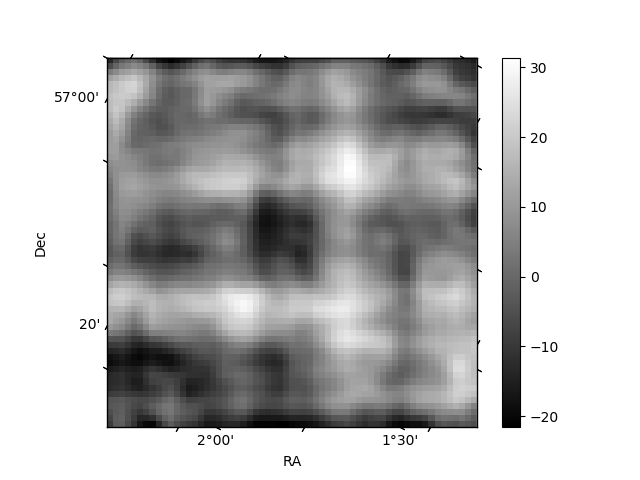
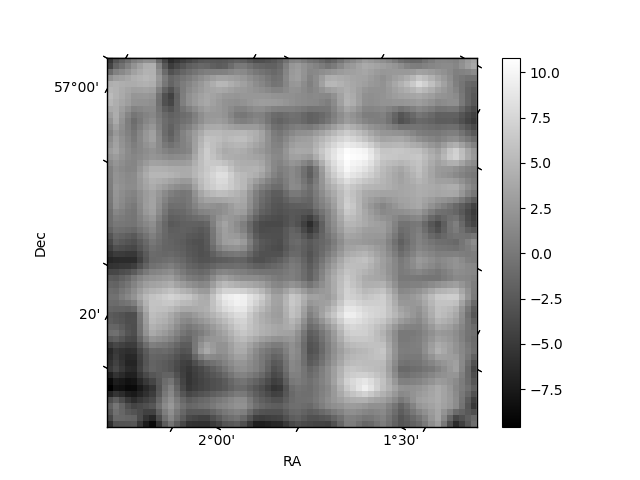
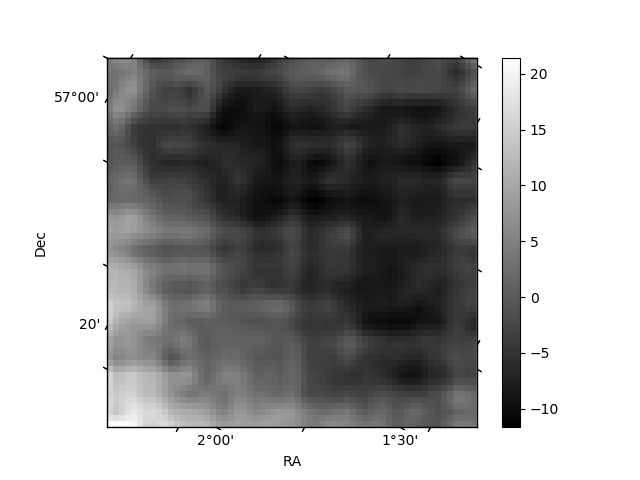
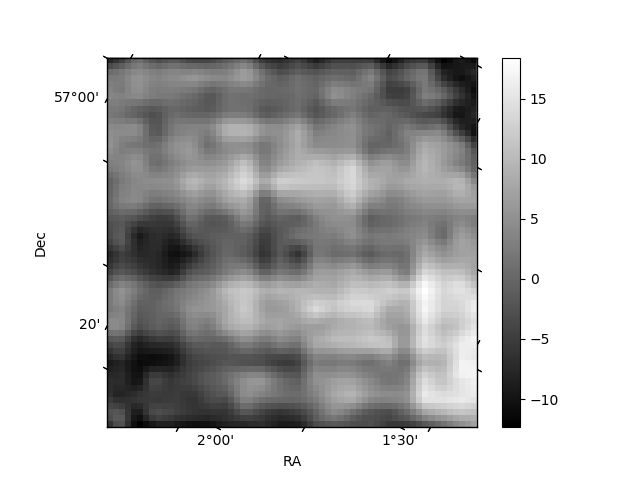
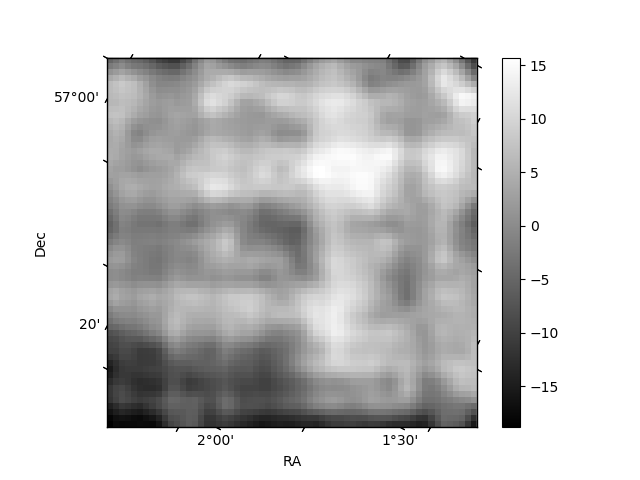
Histogram calculated using DETX and DETY for each event in the final _common_clean file
| Quadrant A | 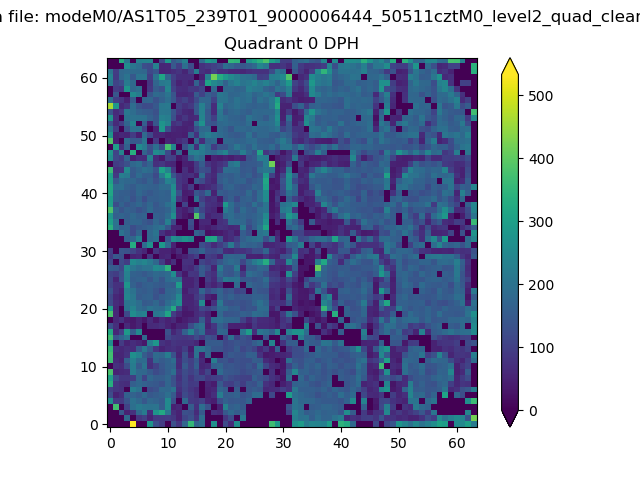 |
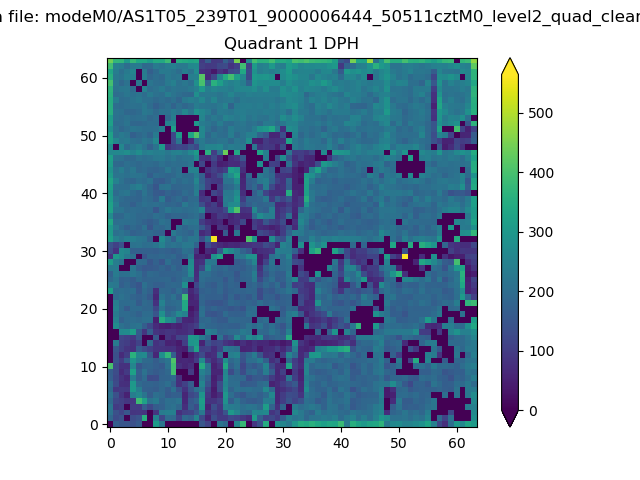 |
Quadrant B |
|---|---|---|---|
| Quadrant D | 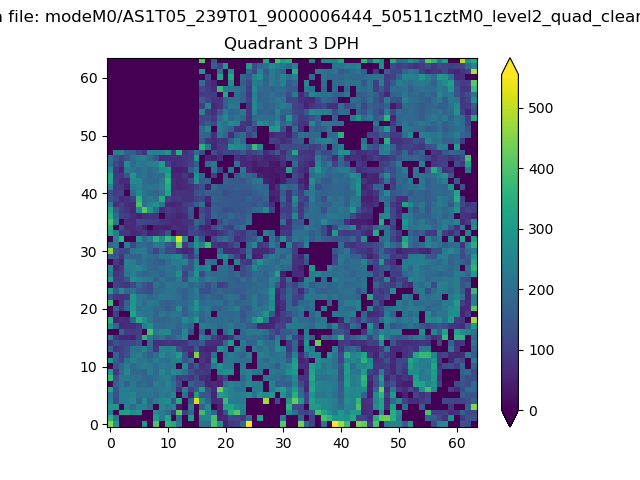 |
 |
Quadrant C |
| Plot type | Count rate plots | Images |
|---|---|---|
| Comparison with Poisson distribution Blue bars denote a histogram of data divided into 1 sec bins. Red curve is a Poisson curve with rate = median count rate of data. |
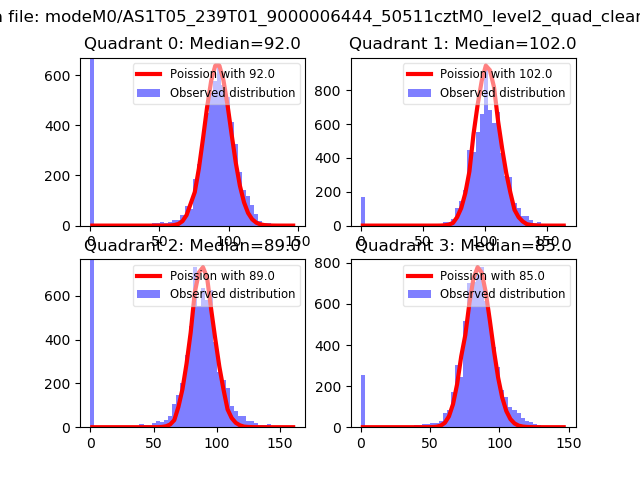 |
 |
| Quadrant-wise count rates Data is divided into 100 sec bins |
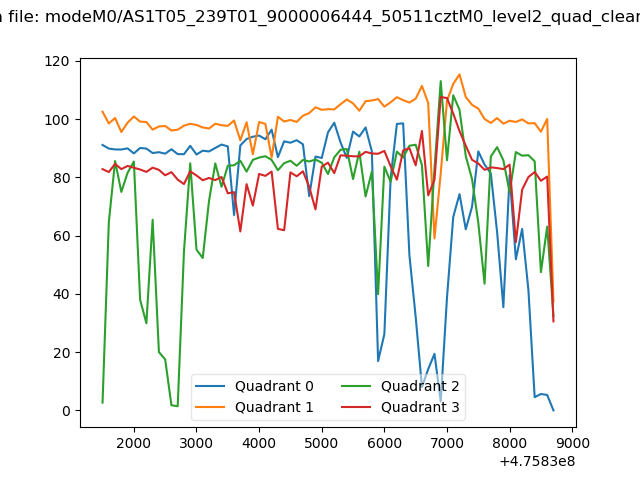 |
|
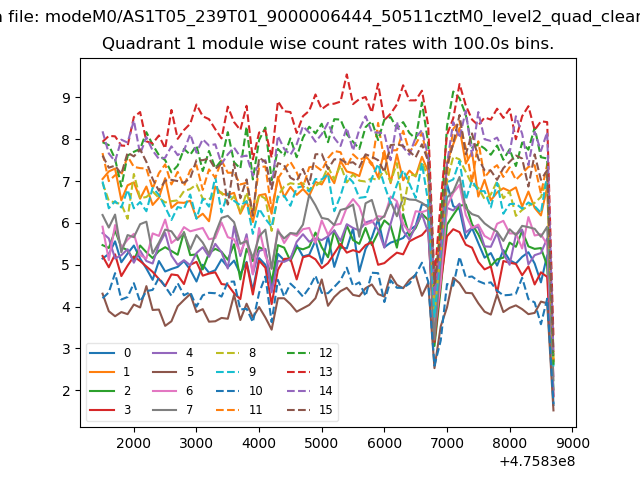
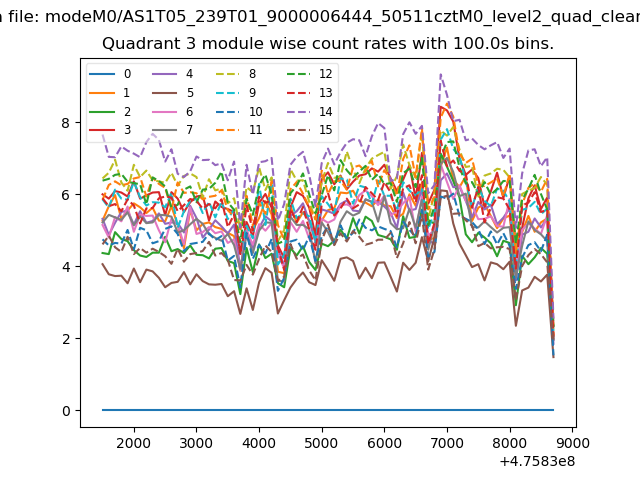
| Module-wise count rates for Quadrant A Data is divided into 100 sec bins |
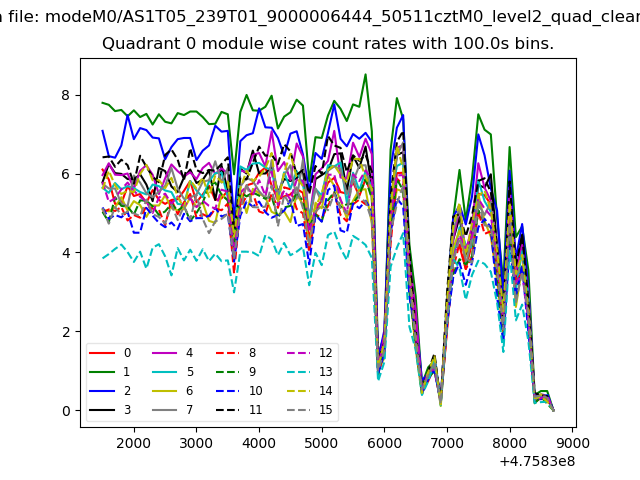 |
 |
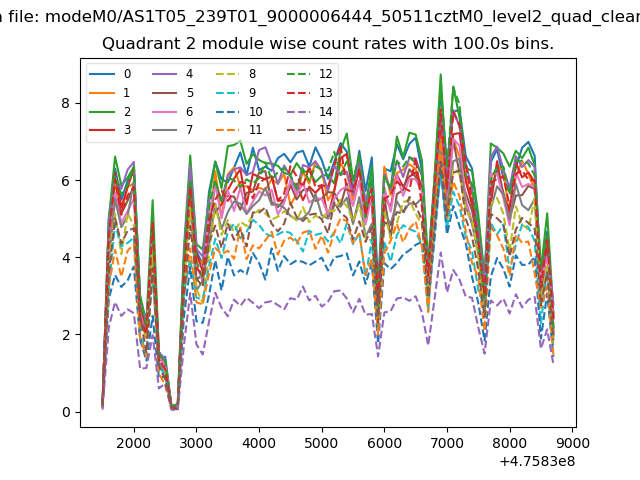
| Module-wise count rates for Quadrant B Data is divided into 100 sec bins |
 |
 |
| Module-wise count rates for Quadrant C Data is divided into 100 sec bins |
 |
 |
| Module-wise count rates for Quadrant D Data is divided into 100 sec bins |
 |
 |
| Parameter | Plot |
|---|---|
| CZT HV Monitor | 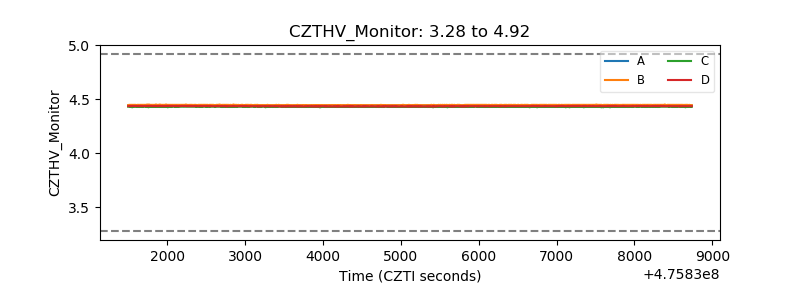 |
| D_VDD | 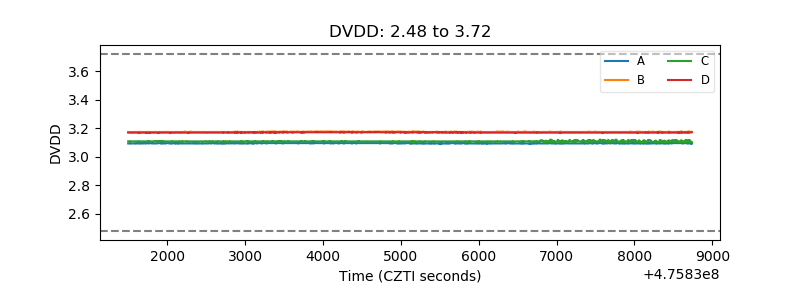 |
| Temperature 1 | 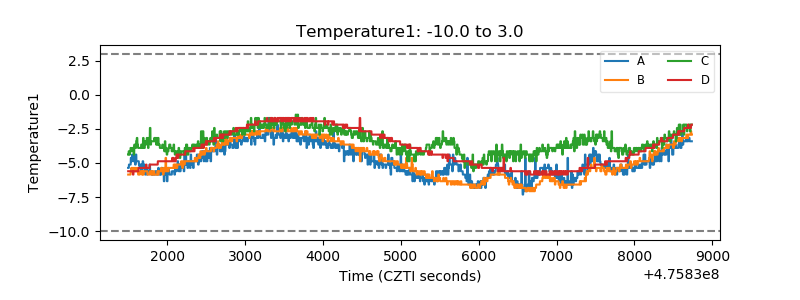 |
| Veto HV Monitor | 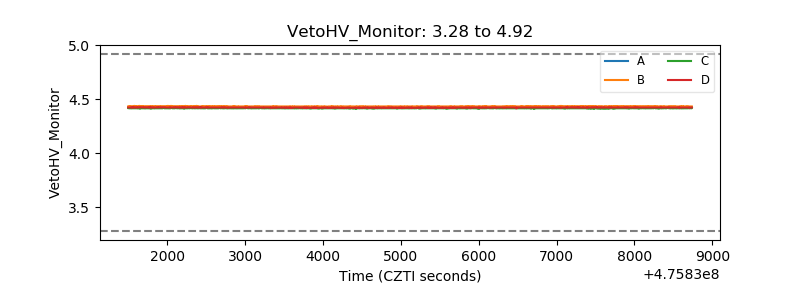 |
| Veto LLD | 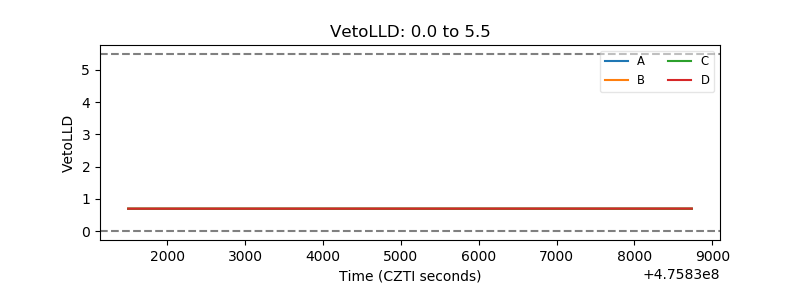 |
| Alpha Counter | 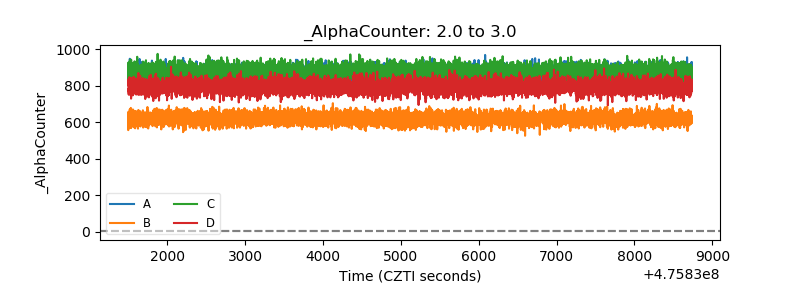 |
| _CPM_Rate | 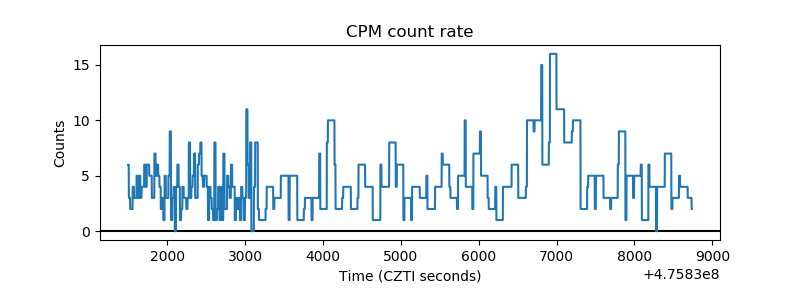 |
| CZT Counter | 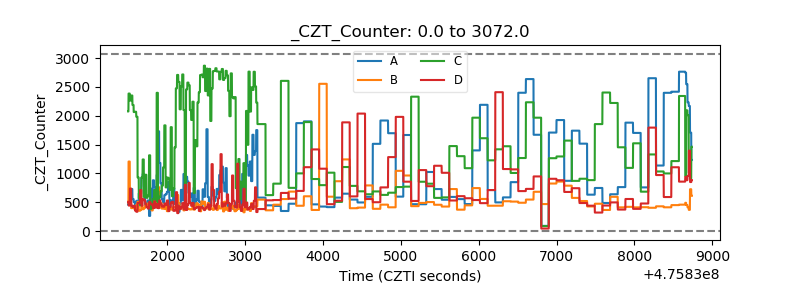 |
| +2.5 Volts monitor |  |
| +5 Volts monitor | 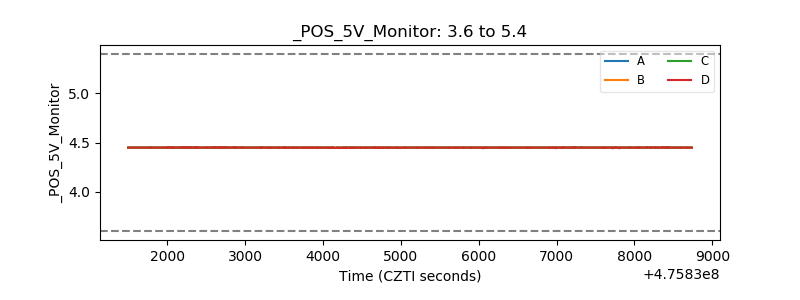 |
| _ROLL_ROT | 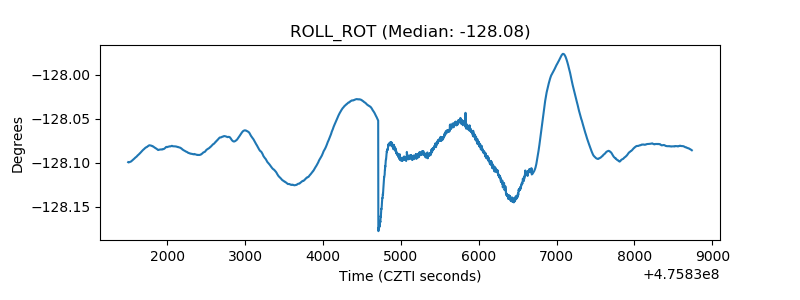 |
| _Roll_DEC | 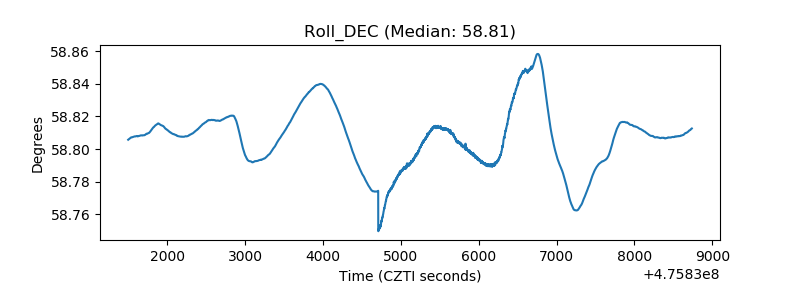 |
| _Roll_RA | 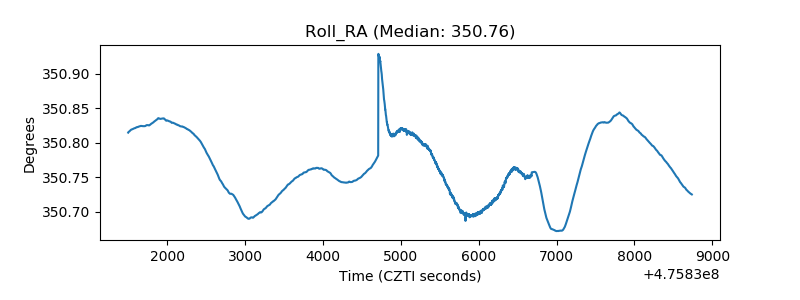 |
| Veto Counter | 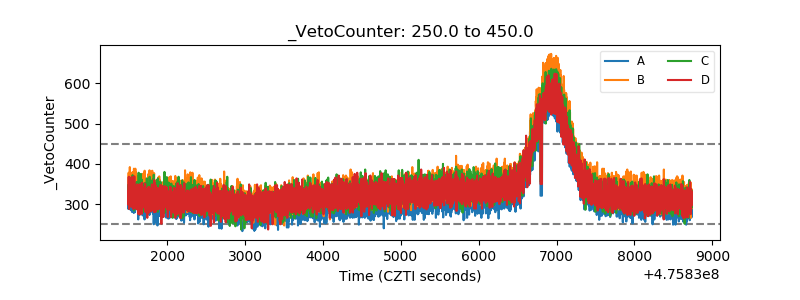 |