| Param | Original file | Final file |
|---|---|---|
| Filename | modeM0/AS1T05_239T01_9000006444_50512cztM0_level2.fits | modeM0/AS1T05_239T01_9000006444_50512cztM0_level2_quad_clean.evt |
| Size (bytes) | 955,883,520 | 92,119,680 |
| Size | 911.6 MB | 87.9 MB |
| Events in quadrant A | 8,408,375 | 560,398 |
| Events in quadrant B | 3,930,875 | 743,542 |
| Events in quadrant C | 11,310,013 | 495,361 |
| Events in quadrant D | 11,161,493 | 471,981 |
| Mode M0 | |||
|---|---|---|---|
| Quadrant | BADHDUFLAG | Total packets | Discarded packets |
| A | 0 | 30106 | 0 |
| B | 0 | 17026 | 0 |
| C | 0 | 38819 | 0 |
| D | 0 | 38351 | 0 |
| Mode SS | |||
|---|---|---|---|
| Quadrant | BADHDUFLAG | Total packets | Discarded packets |
| A | 0 | 150 | 0 |
| B | 0 | 150 | 0 |
| C | 0 | 150 | 0 |
| D | 0 | 150 | 0 |
| Quadrant | Total seconds | Saturated seconds | Saturation percentage |
|---|---|---|---|
| A | 7431 | 1553 | 20.898937% |
| B | 7431 | 143 | 1.924371% |
| C | 7431 | 2175 | 29.269277% |
| D | 7432 | 2061 | 27.731432% |
Noise dominated data is calculated using 1-second bins in cleaned event files. If a bin has >2000 counts, and if more than 50% of those come from <1% of pixels, then it is considered to be noise-dominated and hence unusable.
| Quadrant | # 1 sec bins | Bins with >0 counts | Bins with >2000 counts | High rate bins dominated by noise | Noise dominated (total time) | Noise dominated (detector-on time) | Marked lightcurve |
|---|---|---|---|---|---|---|---|
| A | 7431 | 7431 | 1357 | 1357 | 18.26% | 18.26% | 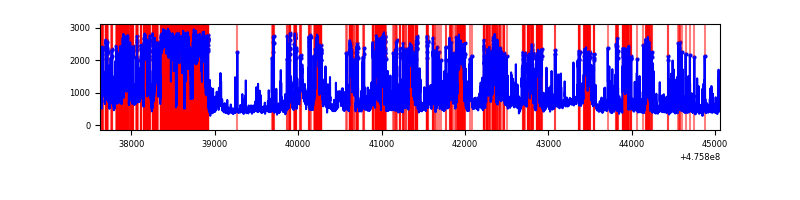 |
| B | 7431 | 7431 | 136 | 136 | 1.83% | 1.83% | 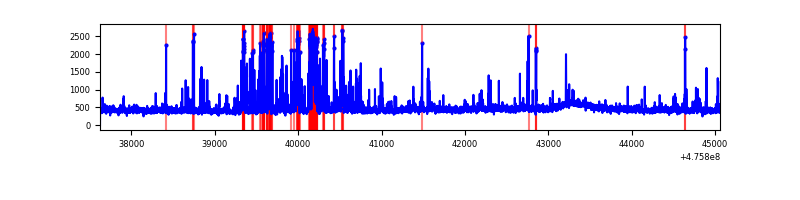 |
| C | 7431 | 7431 | 2115 | 2115 | 28.46% | 28.46% | 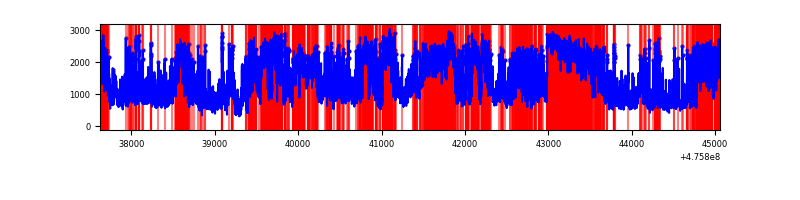 |
| D | 7432 | 7432 | 2172 | 2172 | 29.22% | 29.22% | 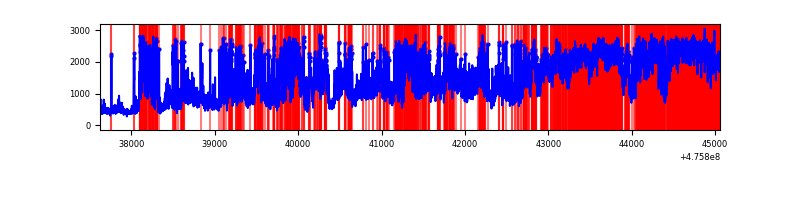 |
Top three noisy pixels from each quadrant. If the there are fewer than three noisy pixels in the level2.evt file, extra rows are filled as -1
| Pixel properties | Quadrant properties | ||||||
|---|---|---|---|---|---|---|---|
| Quadrant | DetID | PixID | Counts | Sigma | Mean | Median | Sigma |
| A | 4 | 249 | 2045076 | 11596.01 | 711 | 694 | 176.3 |
| A | 12 | 250 | 1386073 | 7858.06 | 711 | 694 | 176.3 |
| A | 6 | 161 | 736371 | 4172.86 | 711 | 694 | 176.3 |
| B | 7 | 0 | 553641 | 3271.51 | 778 | 750 | 169.0 |
| B | 0 | 213 | 48439 | 282.18 | 778 | 750 | 169.0 |
| B | 0 | 155 | 42695 | 248.19 | 778 | 750 | 169.0 |
| C | 12 | 247 | 2007964 | 10983.02 | 667 | 666 | 182.8 |
| C | 0 | 208 | 829430 | 4534.62 | 667 | 666 | 182.8 |
| C | 15 | 147 | 796191 | 4352.75 | 667 | 666 | 182.8 |
| D | 7 | 61 | 4331964 | 23004.47 | 679 | 657 | 188.3 |
| D | 7 | 60 | 580321 | 3078.72 | 679 | 657 | 188.3 |
| D | 6 | 42 | 484271 | 2568.57 | 679 | 657 | 188.3 |
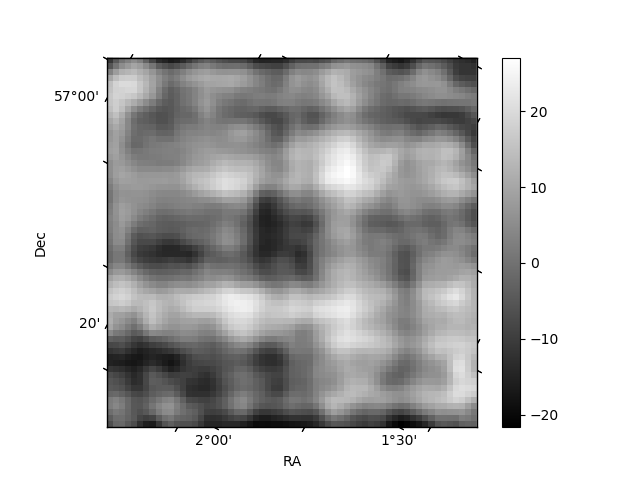
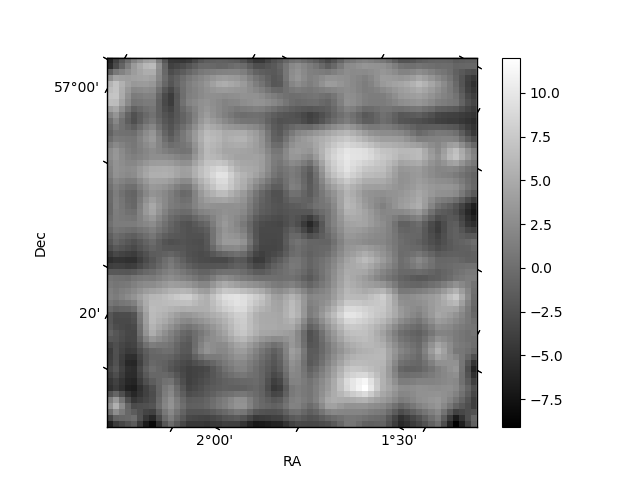
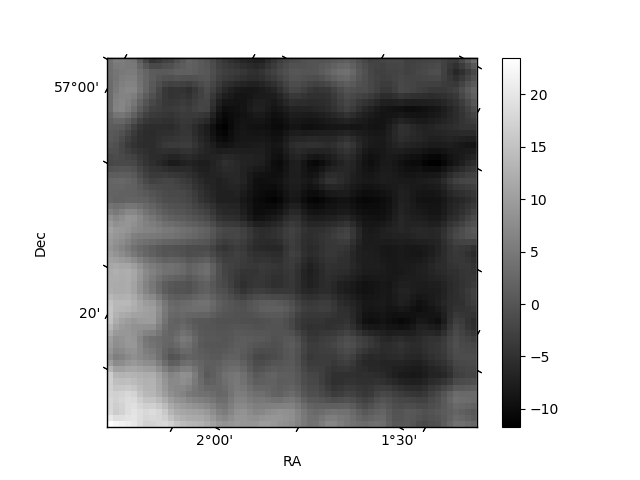
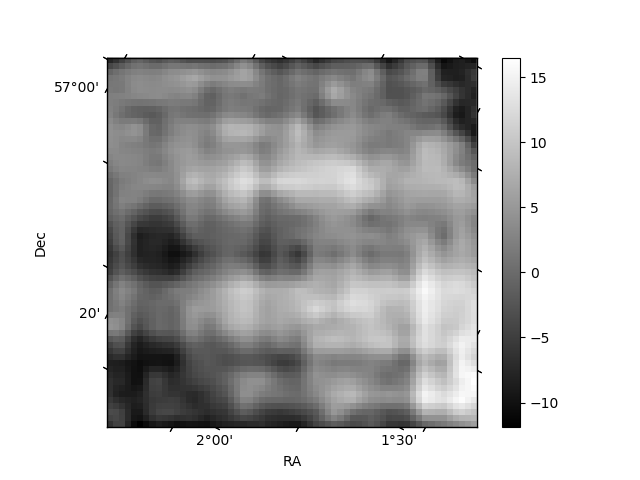
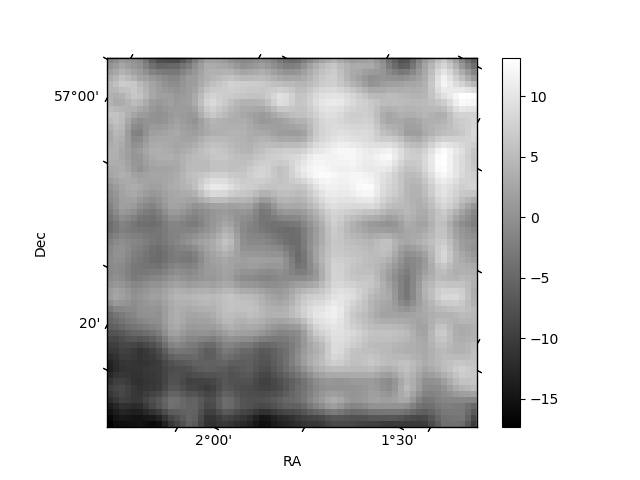
Histogram calculated using DETX and DETY for each event in the final _common_clean file
| Quadrant A | 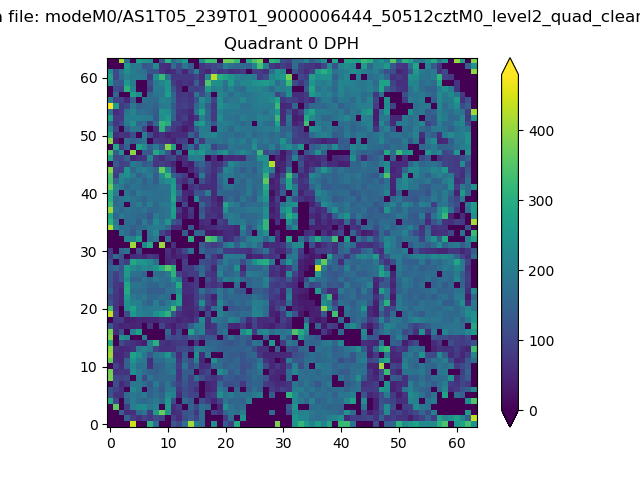 |
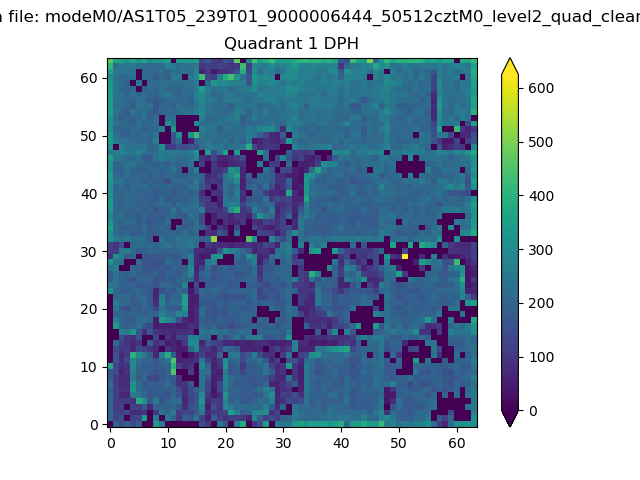 |
Quadrant B |
|---|---|---|---|
| Quadrant D | 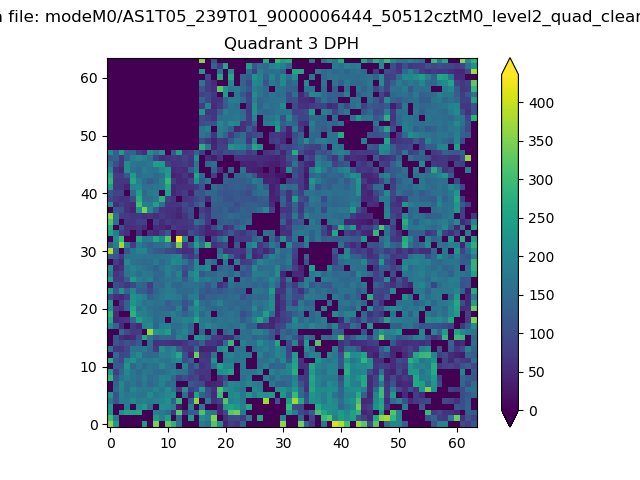 |
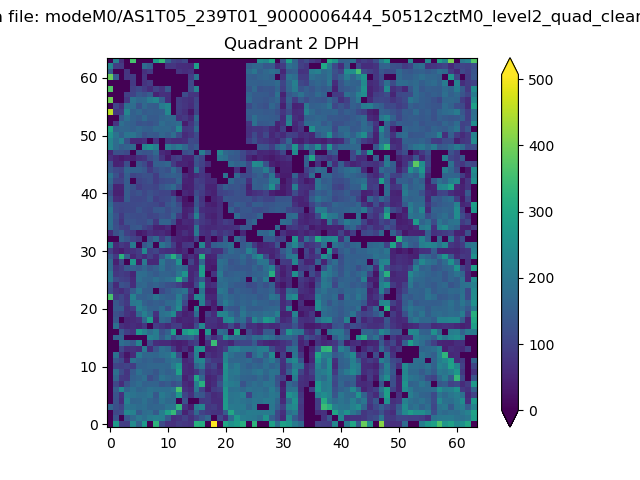 |
Quadrant C |
| Plot type | Count rate plots | Images |
|---|---|---|
| Comparison with Poisson distribution Blue bars denote a histogram of data divided into 1 sec bins. Red curve is a Poisson curve with rate = median count rate of data. |
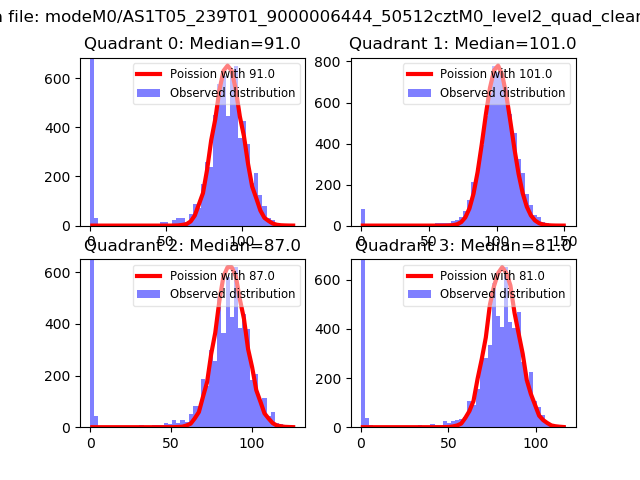 |
 |
| Quadrant-wise count rates Data is divided into 100 sec bins |
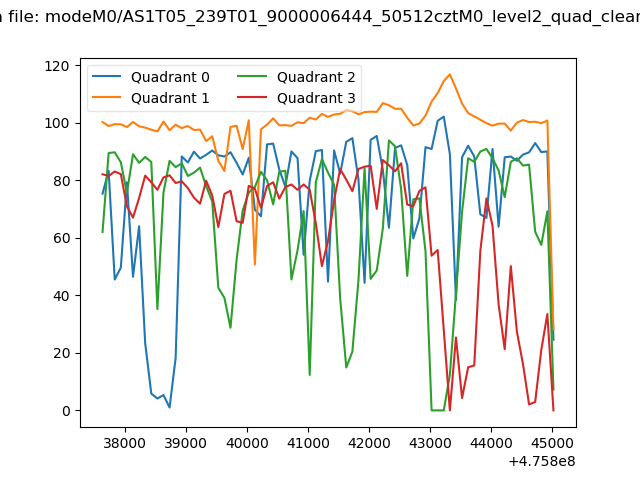 |
|
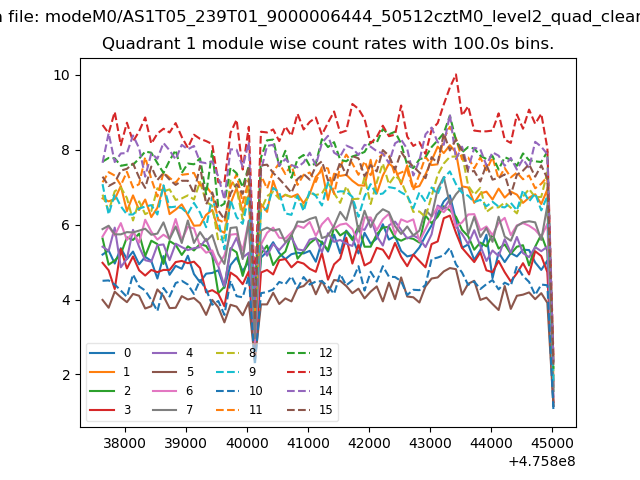
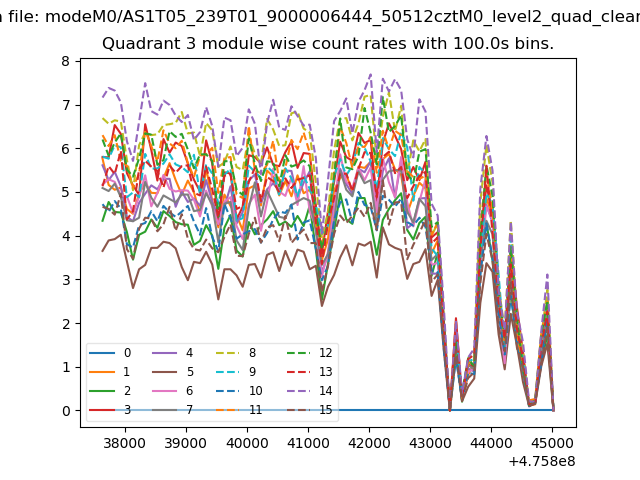
| Module-wise count rates for Quadrant A Data is divided into 100 sec bins |
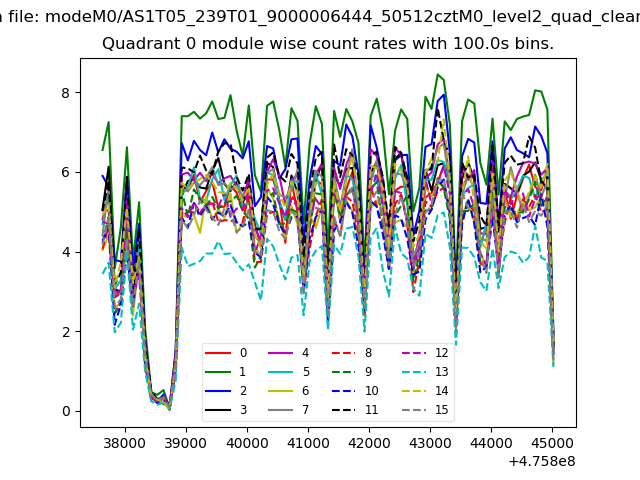 |
 |
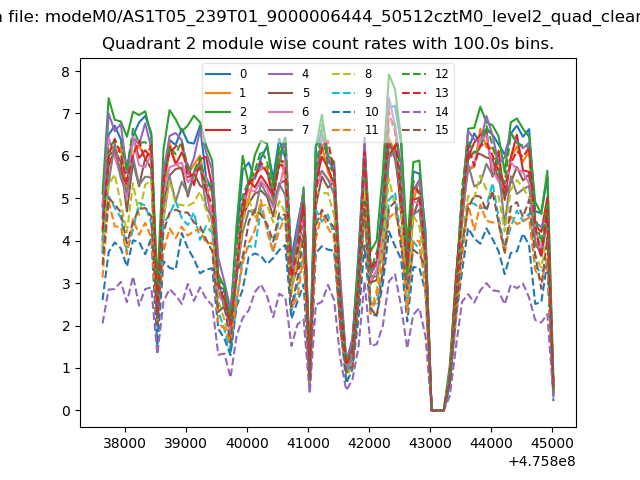
| Module-wise count rates for Quadrant B Data is divided into 100 sec bins |
 |
 |
| Module-wise count rates for Quadrant C Data is divided into 100 sec bins |
 |
 |
| Module-wise count rates for Quadrant D Data is divided into 100 sec bins |
 |
 |
| Parameter | Plot |
|---|---|
| CZT HV Monitor | 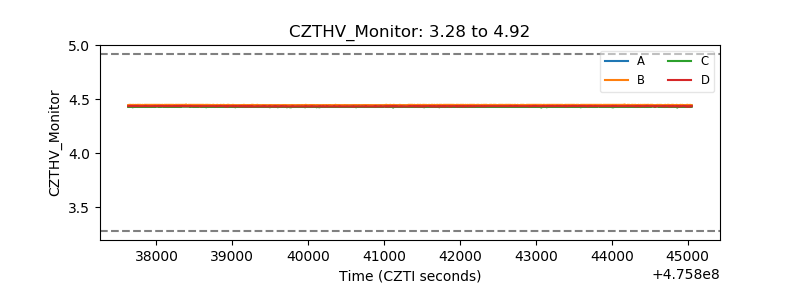 |
| D_VDD | 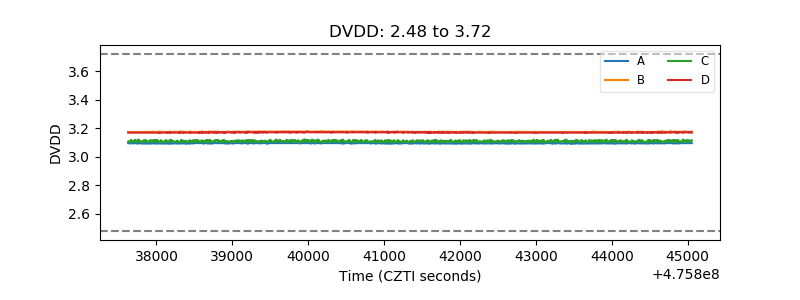 |
| Temperature 1 | 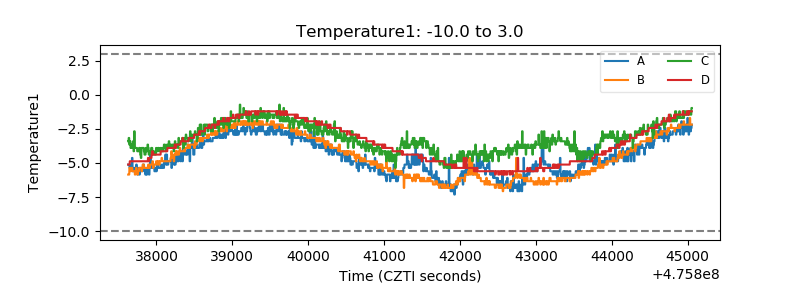 |
| Veto HV Monitor |  |
| Veto LLD | 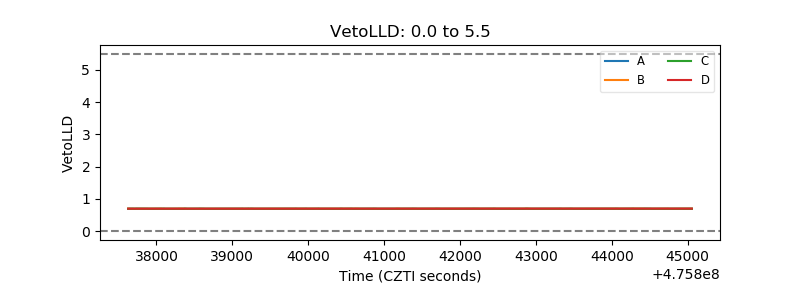 |
| Alpha Counter | 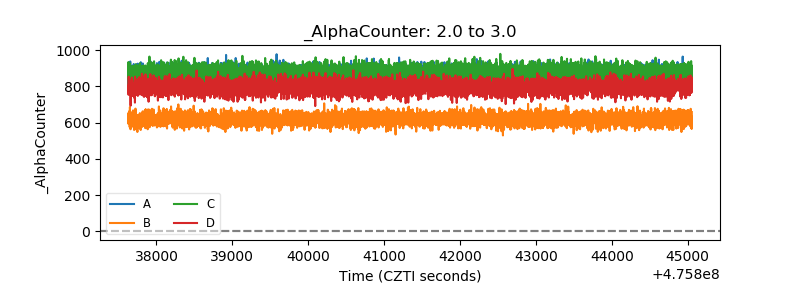 |
| _CPM_Rate | 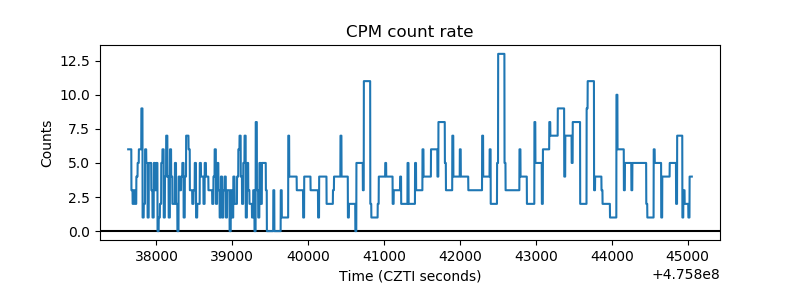 |
| CZT Counter | 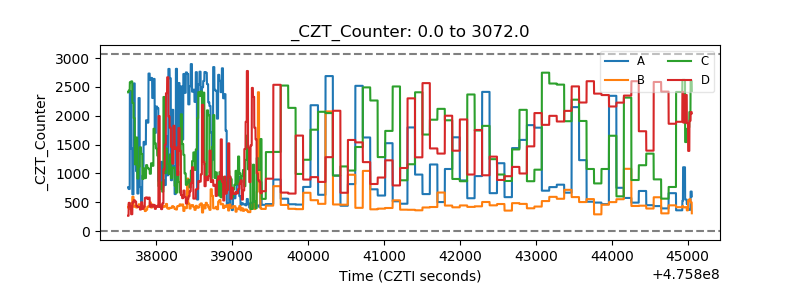 |
| +2.5 Volts monitor | 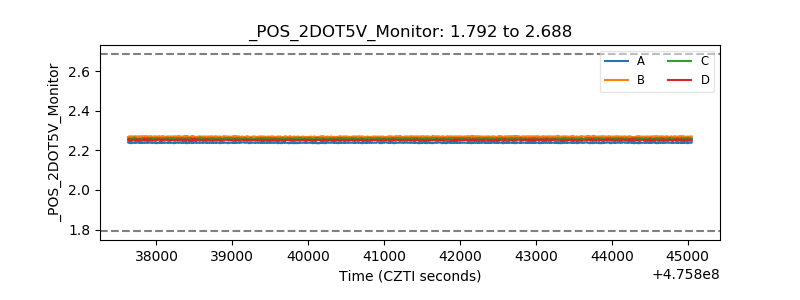 |
| +5 Volts monitor |  |
| _ROLL_ROT | 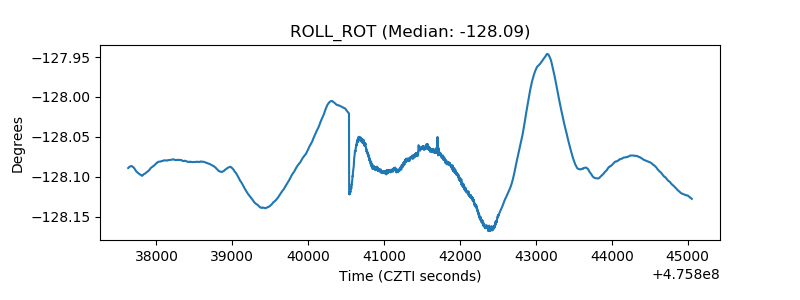 |
| _Roll_DEC | 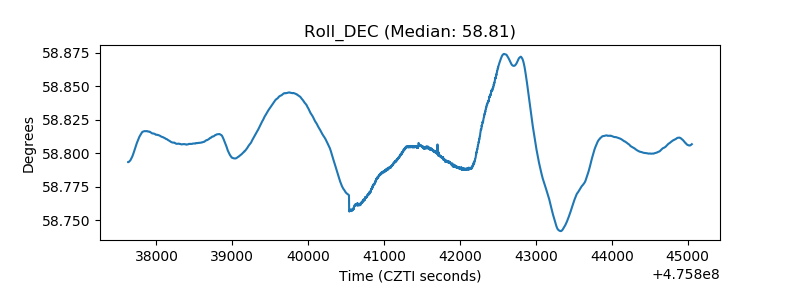 |
| _Roll_RA | 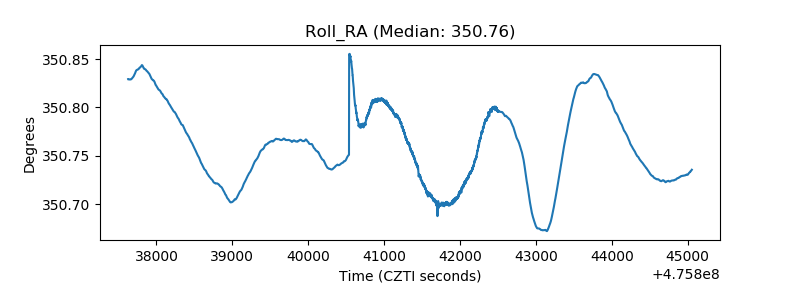 |
| Veto Counter | 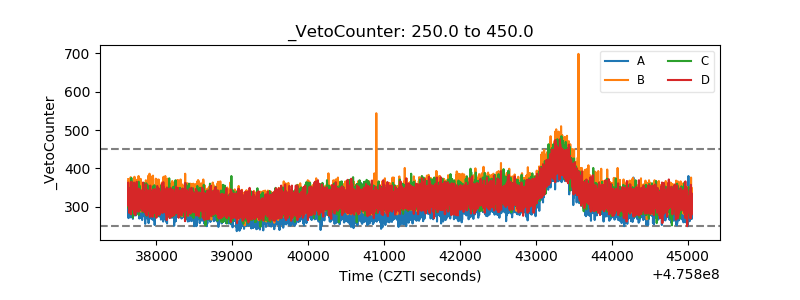 |