| Param | Original file | Final file |
|---|---|---|
| Filename | modeM0/AS1T05_239T01_9000006444_50513cztM0_level2.fits | modeM0/AS1T05_239T01_9000006444_50513cztM0_level2_quad_clean.evt |
| Size (bytes) | 1,191,283,200 | 69,609,600 |
| Size | 1.1 GB | 66.4 MB |
| Events in quadrant A | 6,674,214 | 628,782 |
| Events in quadrant B | 3,875,745 | 738,520 |
| Events in quadrant C | 15,299,822 | 197,271 |
| Events in quadrant D | 17,679,725 | 30,692 |
| Mode M0 | |||
|---|---|---|---|
| Quadrant | BADHDUFLAG | Total packets | Discarded packets |
| A | 0 | 24837 | 0 |
| B | 0 | 16655 | 1 |
| C | 0 | 50534 | 0 |
| D | 0 | 57419 | 0 |
| Mode SS | |||
|---|---|---|---|
| Quadrant | BADHDUFLAG | Total packets | Discarded packets |
| A | 0 | 148 | 0 |
| B | 0 | 148 | 0 |
| C | 0 | 148 | 0 |
| D | 0 | 148 | 0 |
| Quadrant | Total seconds | Saturated seconds | Saturation percentage |
|---|---|---|---|
| A | 7352 | 736 | 10.010881% |
| B | 7352 | 79 | 1.074538% |
| C | 7352 | 5426 | 73.803047% |
| D | 7352 | 7065 | 96.096300% |
Noise dominated data is calculated using 1-second bins in cleaned event files. If a bin has >2000 counts, and if more than 50% of those come from <1% of pixels, then it is considered to be noise-dominated and hence unusable.
| Quadrant | # 1 sec bins | Bins with >0 counts | Bins with >2000 counts | High rate bins dominated by noise | Noise dominated (total time) | Noise dominated (detector-on time) | Marked lightcurve |
|---|---|---|---|---|---|---|---|
| A | 7352 | 7352 | 612 | 612 | 8.32% | 8.32% | 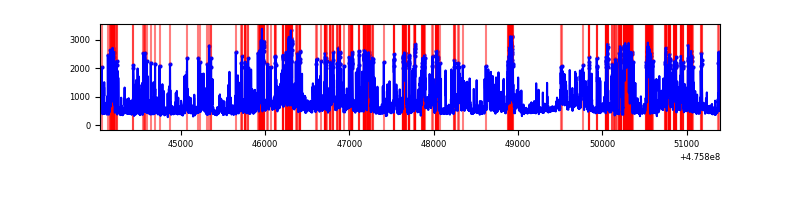 |
| B | 7352 | 7352 | 68 | 68 | 0.92% | 0.92% | 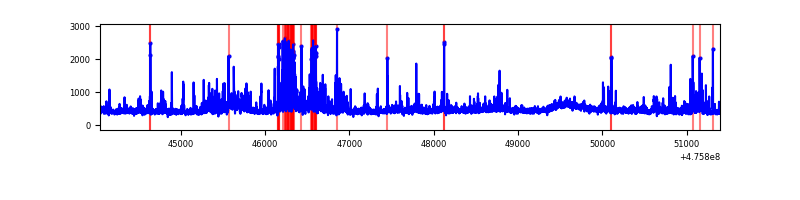 |
| C | 7352 | 7352 | 4841 | 4841 | 65.85% | 65.85% | 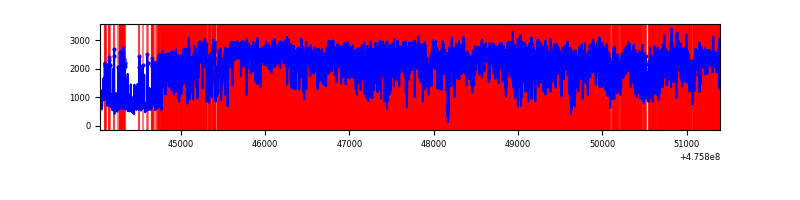 |
| D | 7352 | 7352 | 6909 | 6909 | 93.97% | 93.97% | 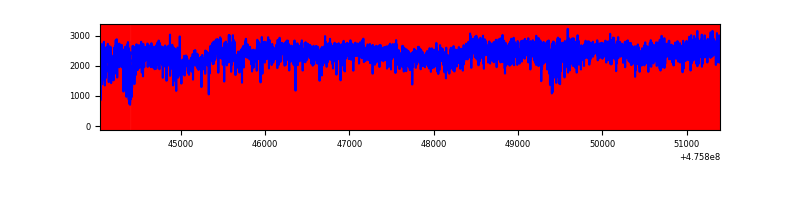 |
Top three noisy pixels from each quadrant. If the there are fewer than three noisy pixels in the level2.evt file, extra rows are filled as -1
| Pixel properties | Quadrant properties | ||||||
|---|---|---|---|---|---|---|---|
| Quadrant | DetID | PixID | Counts | Sigma | Mean | Median | Sigma |
| A | 12 | 250 | 850295 | 4529.84 | 753 | 734 | 187.5 |
| A | 10 | 253 | 726499 | 3869.76 | 753 | 734 | 187.5 |
| A | 6 | 161 | 591680 | 3150.91 | 753 | 734 | 187.5 |
| B | 7 | 0 | 275719 | 1666.69 | 771 | 746 | 165.0 |
| B | 4 | 170 | 197230 | 1190.95 | 771 | 746 | 165.0 |
| B | 8 | 128 | 51557 | 307.98 | 771 | 746 | 165.0 |
| C | 12 | 249 | 3063454 | 25192.28 | 430 | 427 | 121.6 |
| C | 15 | 196 | 3022990 | 24859.48 | 430 | 427 | 121.6 |
| C | 15 | 214 | 2733185 | 22475.94 | 430 | 427 | 121.6 |
| D | 7 | 61 | 8613341 | 108256.47 | 260 | 250 | 79.6 |
| D | 15 | 184 | 5162657 | 64885.41 | 260 | 250 | 79.6 |
| D | 6 | 42 | 738208 | 9275.27 | 260 | 250 | 79.6 |
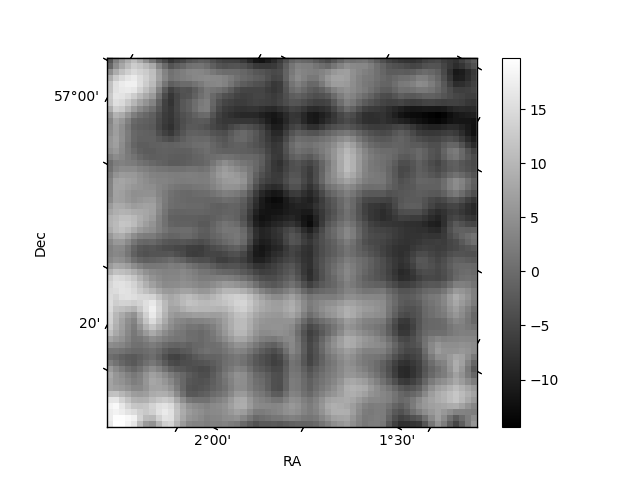
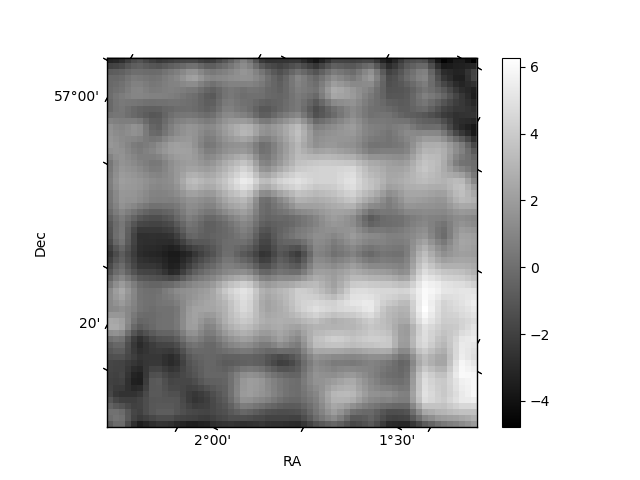
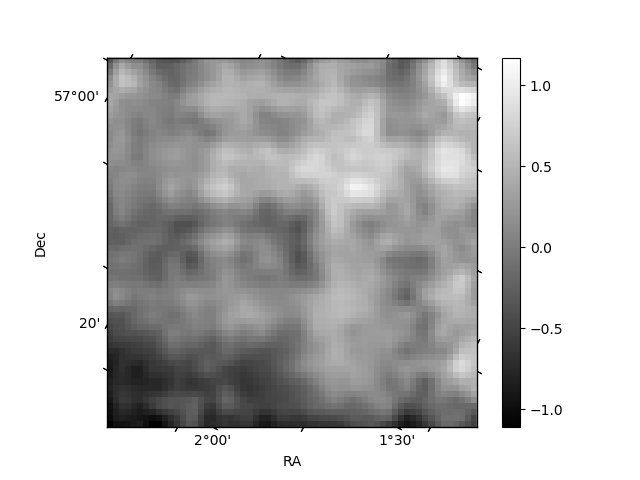
Histogram calculated using DETX and DETY for each event in the final _common_clean file
| Quadrant A | 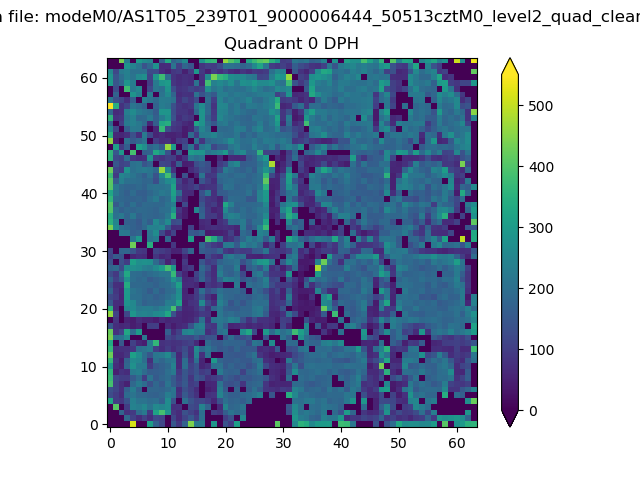 |
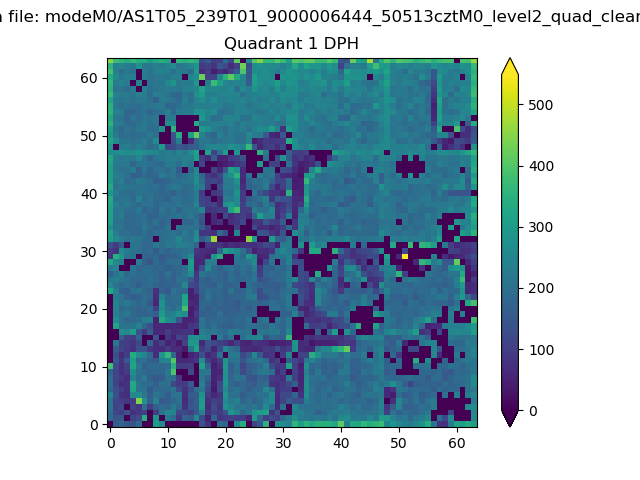 |
Quadrant B |
|---|---|---|---|
| Quadrant D | 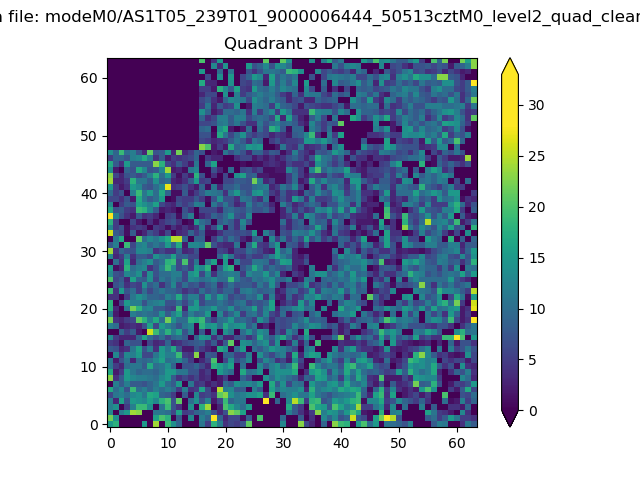 |
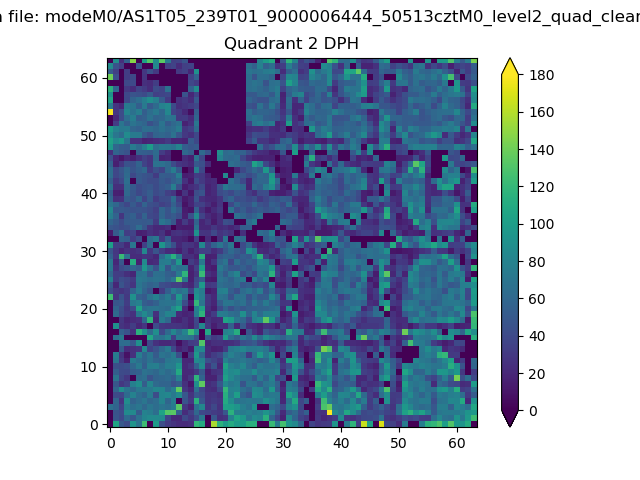 |
Quadrant C |
| Plot type | Count rate plots | Images |
|---|---|---|
| Comparison with Poisson distribution Blue bars denote a histogram of data divided into 1 sec bins. Red curve is a Poisson curve with rate = median count rate of data. |
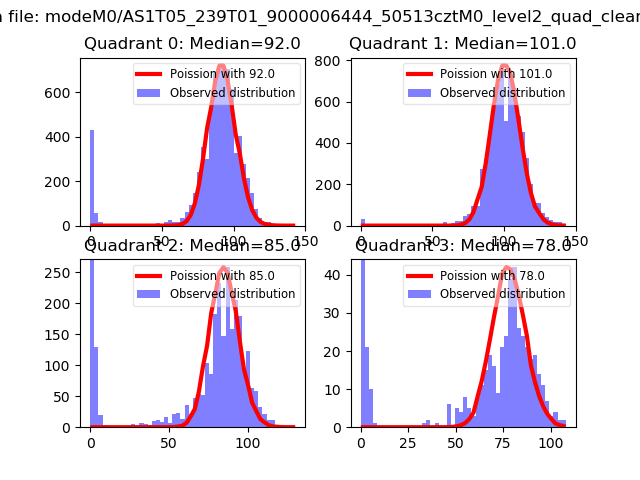 |
 |
| Quadrant-wise count rates Data is divided into 100 sec bins |
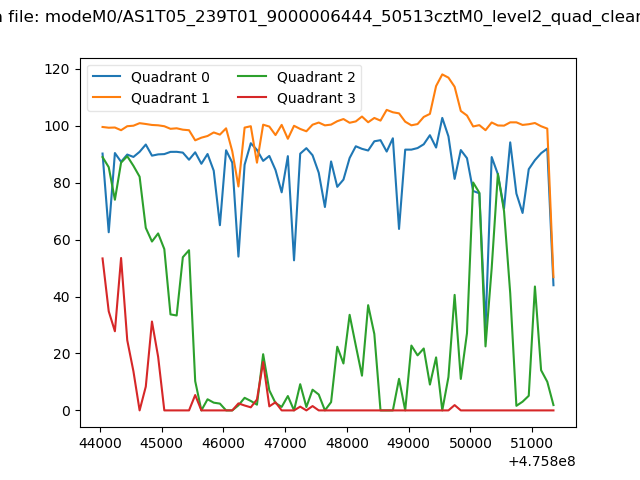 |
|
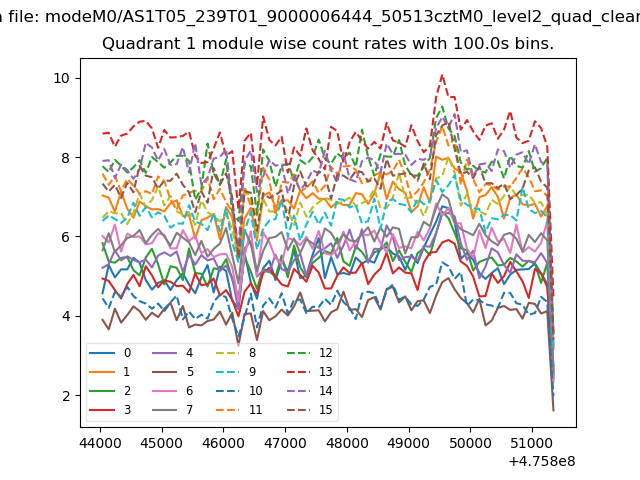
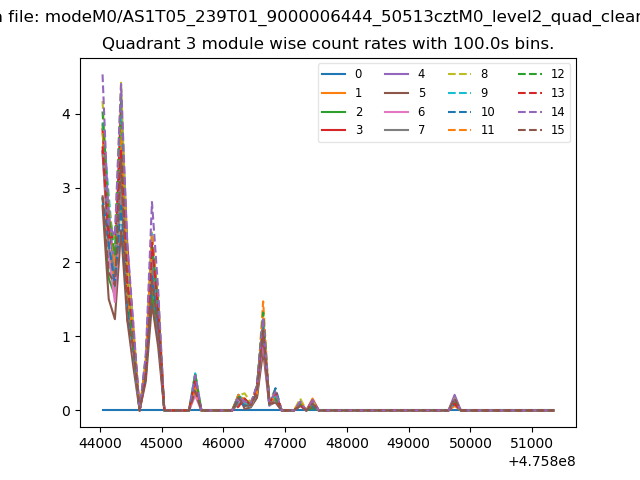
| Module-wise count rates for Quadrant A Data is divided into 100 sec bins |
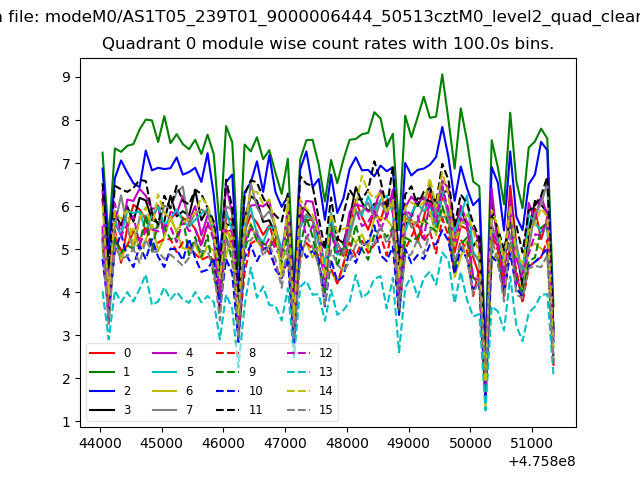 |
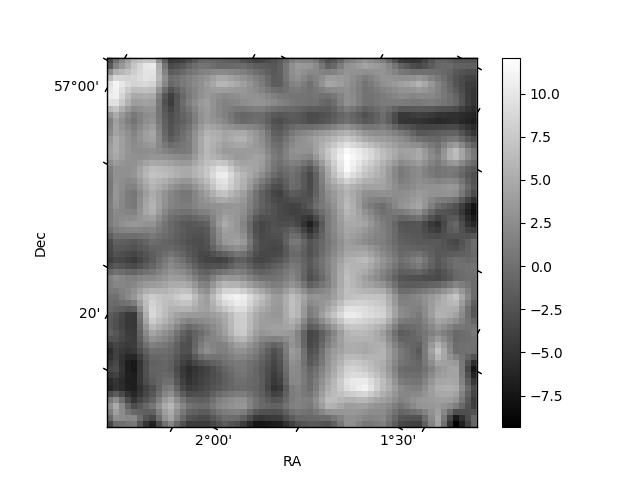 |
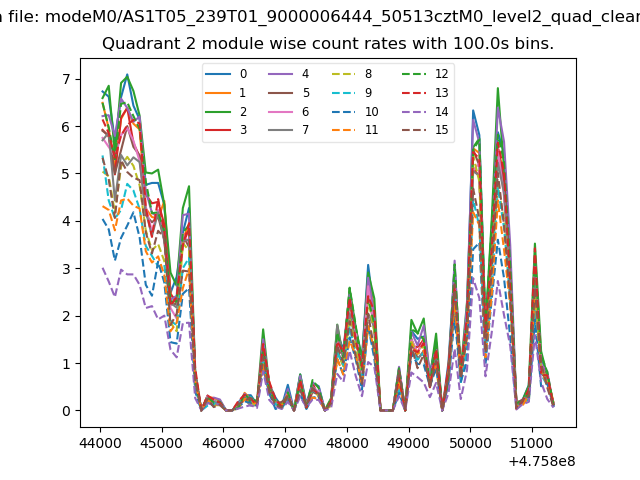
| Module-wise count rates for Quadrant B Data is divided into 100 sec bins |
 |
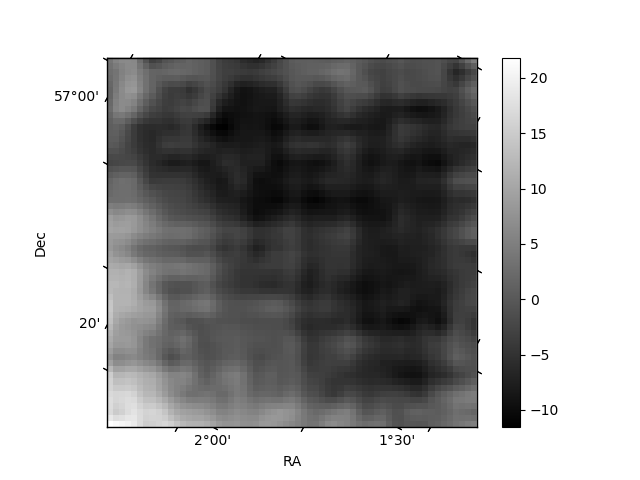 |
| Module-wise count rates for Quadrant C Data is divided into 100 sec bins |
 |
 |
| Module-wise count rates for Quadrant D Data is divided into 100 sec bins |
 |
 |
| Parameter | Plot |
|---|---|
| CZT HV Monitor | 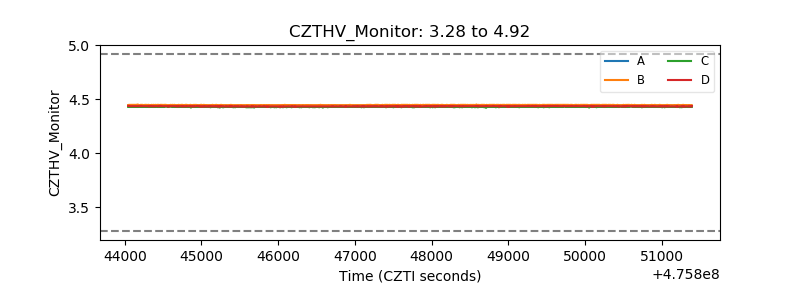 |
| D_VDD | 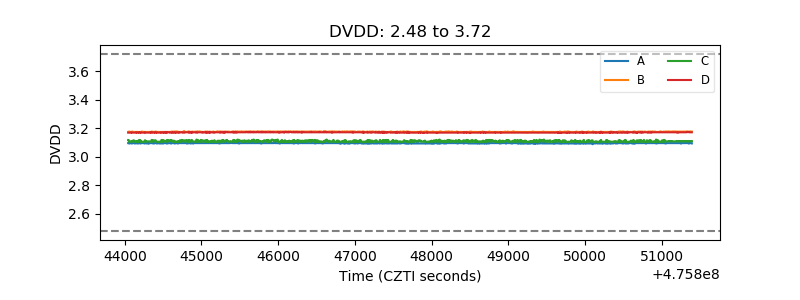 |
| Temperature 1 | 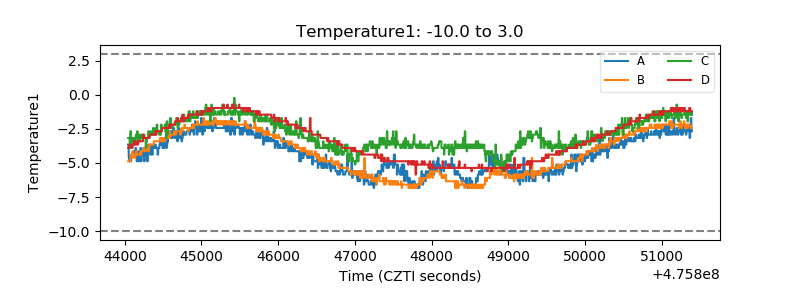 |
| Veto HV Monitor |  |
| Veto LLD | 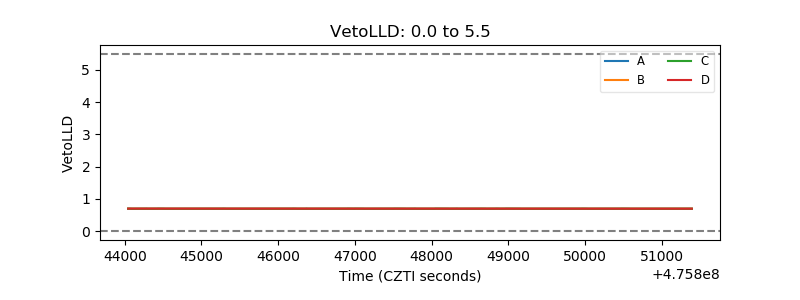 |
| Alpha Counter | 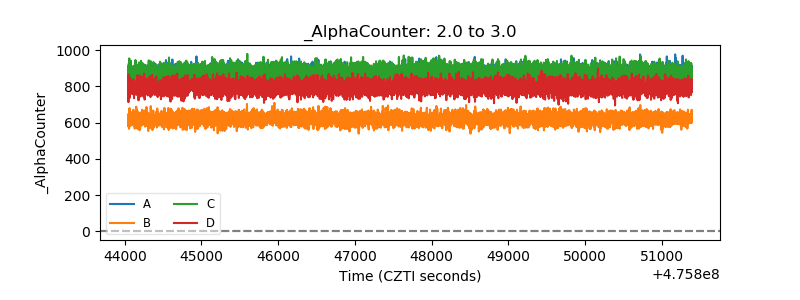 |
| _CPM_Rate | 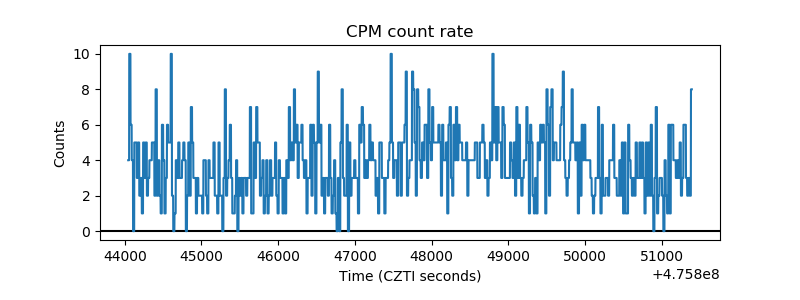 |
| CZT Counter | 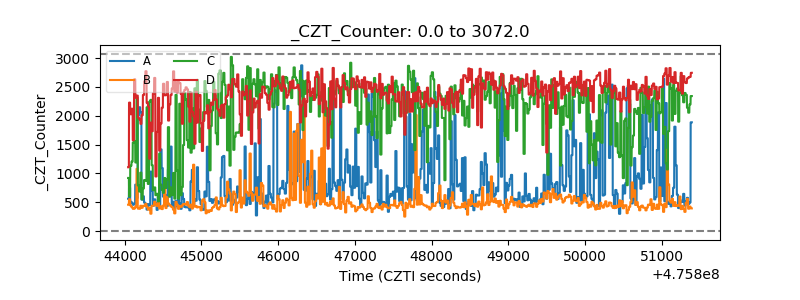 |
| +2.5 Volts monitor | 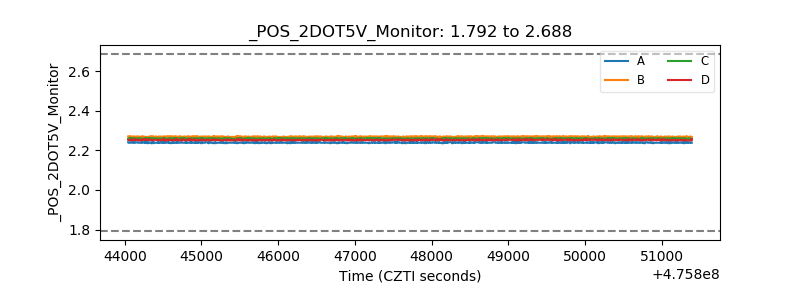 |
| +5 Volts monitor | 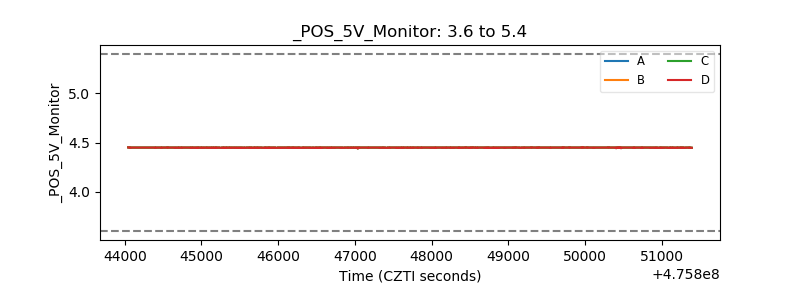 |
| _ROLL_ROT | 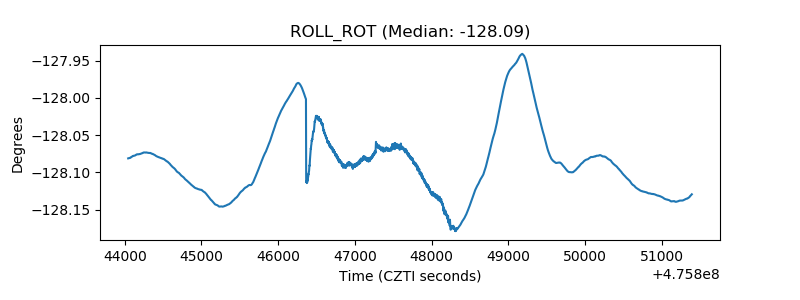 |
| _Roll_DEC | 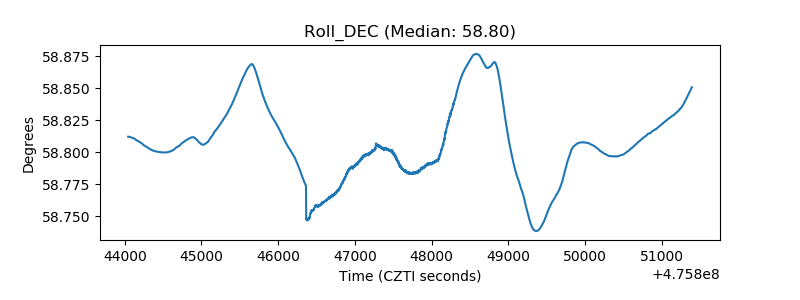 |
| _Roll_RA | 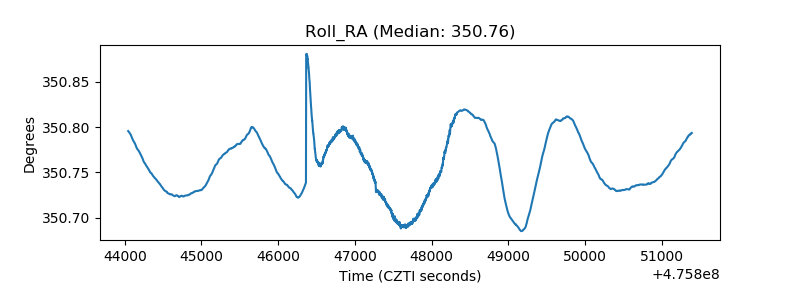 |
| Veto Counter | 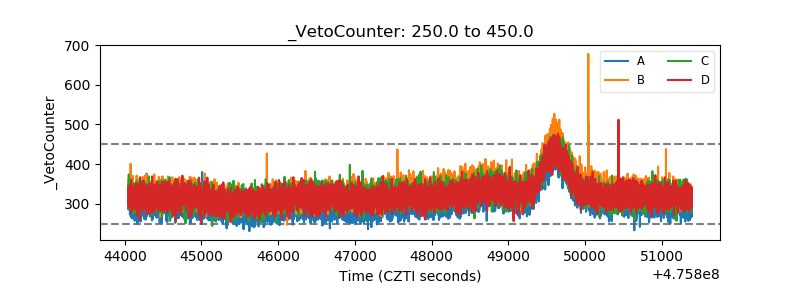 |