| Param | Original file | Final file |
|---|---|---|
| Filename | modeM0/AS1T05_239T01_9000006444_50517cztM0_level2.fits | modeM0/AS1T05_239T01_9000006444_50517cztM0_level2_quad_clean.evt |
| Size (bytes) | 694,563,840 | 89,513,280 |
| Size | 662.4 MB | 85.4 MB |
| Events in quadrant A | 6,694,882 | 544,864 |
| Events in quadrant B | 3,959,382 | 675,984 |
| Events in quadrant C | 7,528,011 | 521,436 |
| Events in quadrant D | 7,007,134 | 498,189 |
| Mode M0 | |||
|---|---|---|---|
| Quadrant | BADHDUFLAG | Total packets | Discarded packets |
| A | 0 | 24362 | 1 |
| B | 0 | 16318 | 1 |
| C | 0 | 27107 | 1 |
| D | 0 | 25406 | 1 |
| Mode M9 | |||
|---|---|---|---|
| Quadrant | BADHDUFLAG | Total packets | Discarded packets |
| A | 0 | 8 | 0 |
| B | 0 | 8 | 0 |
| C | 0 | 8 | 0 |
| D | 0 | 8 | 0 |
| Mode SS | |||
|---|---|---|---|
| Quadrant | BADHDUFLAG | Total packets | Discarded packets |
| A | 0 | 138 | 0 |
| B | 0 | 138 | 0 |
| C | 0 | 138 | 0 |
| D | 0 | 138 | 0 |
| Quadrant | Total seconds | Saturated seconds | Saturation percentage |
|---|---|---|---|
| A | 6732 | 1111 | 16.503268% |
| B | 6733 | 182 | 2.703104% |
| C | 6733 | 1107 | 16.441408% |
| D | 6733 | 934 | 13.871974% |
Noise dominated data is calculated using 1-second bins in cleaned event files. If a bin has >2000 counts, and if more than 50% of those come from <1% of pixels, then it is considered to be noise-dominated and hence unusable.
| Quadrant | # 1 sec bins | Bins with >0 counts | Bins with >2000 counts | High rate bins dominated by noise | Noise dominated (total time) | Noise dominated (detector-on time) | Marked lightcurve |
|---|---|---|---|---|---|---|---|
| A | 7547 | 6733 | 1038 | 1038 | 13.75% | 15.42% | 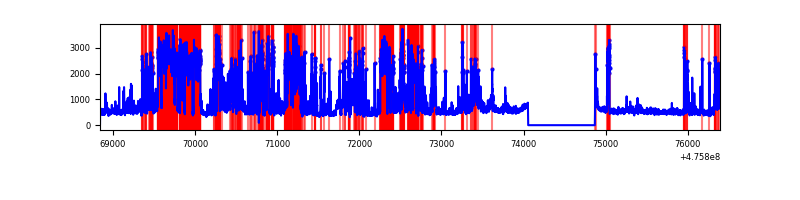 |
| B | 7548 | 6734 | 106 | 106 | 1.40% | 1.57% | 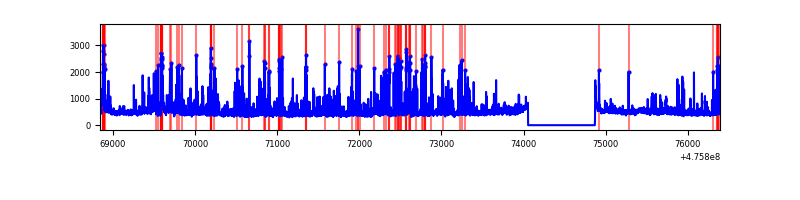 |
| C | 7548 | 6734 | 968 | 968 | 12.82% | 14.37% | 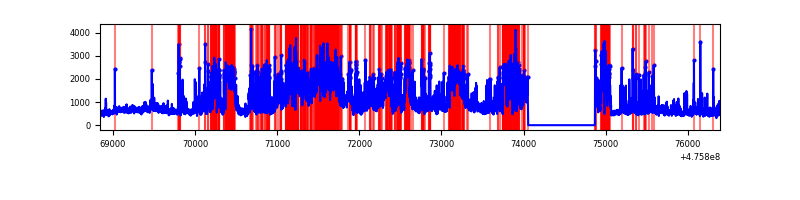 |
| D | 7548 | 6734 | 920 | 920 | 12.19% | 13.66% | 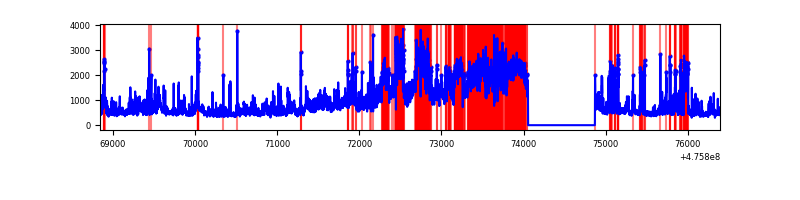 |
Top three noisy pixels from each quadrant. If the there are fewer than three noisy pixels in the level2.evt file, extra rows are filled as -1
| Pixel properties | Quadrant properties | ||||||
|---|---|---|---|---|---|---|---|
| Quadrant | DetID | PixID | Counts | Sigma | Mean | Median | Sigma |
| A | 4 | 249 | 1678425 | 10198.48 | 667 | 648 | 164.5 |
| A | 10 | 253 | 1098463 | 6673.14 | 667 | 648 | 164.5 |
| A | 12 | 250 | 415307 | 2520.53 | 667 | 648 | 164.5 |
| B | 12 | 18 | 475348 | 3133.93 | 712 | 687 | 151.5 |
| B | 7 | 0 | 172082 | 1131.63 | 712 | 687 | 151.5 |
| B | 4 | 206 | 107417 | 704.68 | 712 | 687 | 151.5 |
| C | 12 | 249 | 1127163 | 6136.26 | 666 | 664 | 183.6 |
| C | 15 | 196 | 979618 | 5332.55 | 666 | 664 | 183.6 |
| C | 1 | 44 | 668303 | 3636.76 | 666 | 664 | 183.6 |
| D | 7 | 61 | 2655585 | 14382.39 | 660 | 637 | 184.6 |
| D | 15 | 184 | 562125 | 3041.69 | 660 | 637 | 184.6 |
| D | 6 | 42 | 340675 | 1842.05 | 660 | 637 | 184.6 |
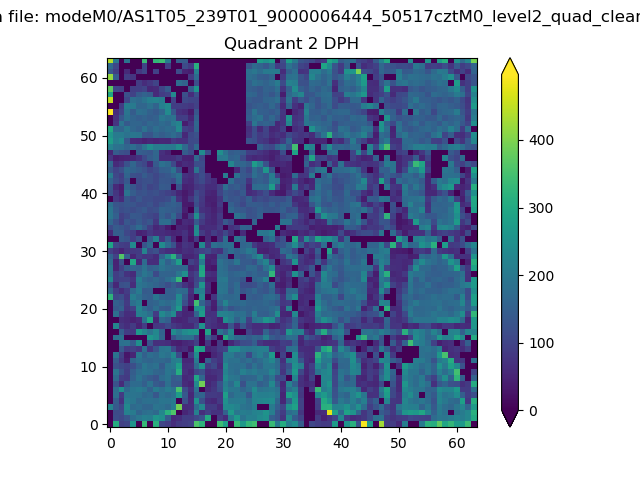
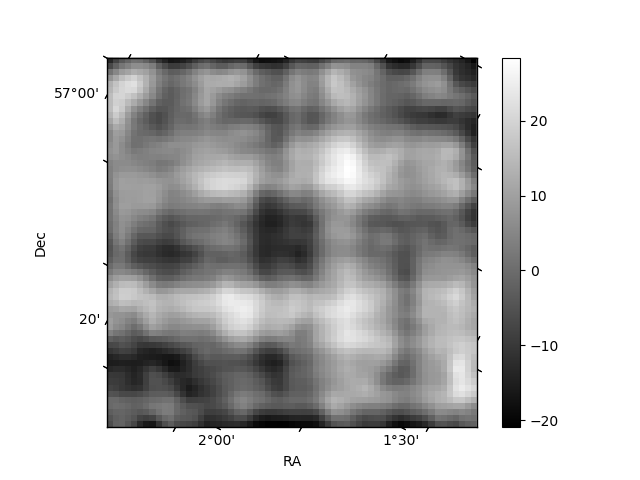
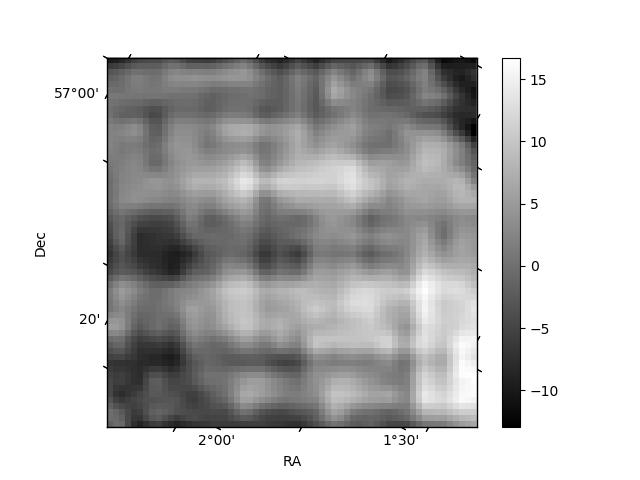
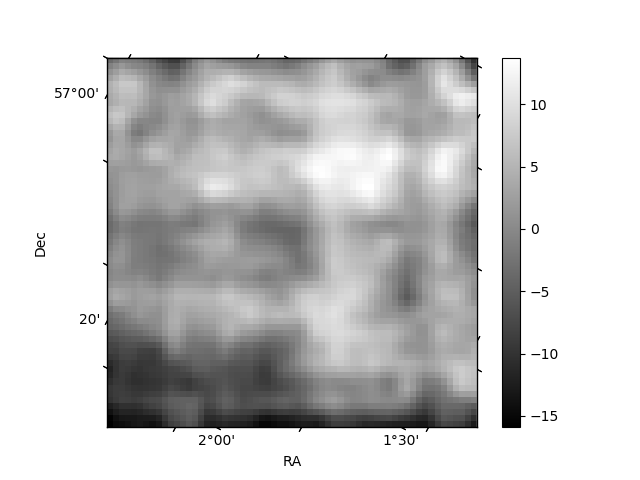
Histogram calculated using DETX and DETY for each event in the final _common_clean file
| Quadrant A | 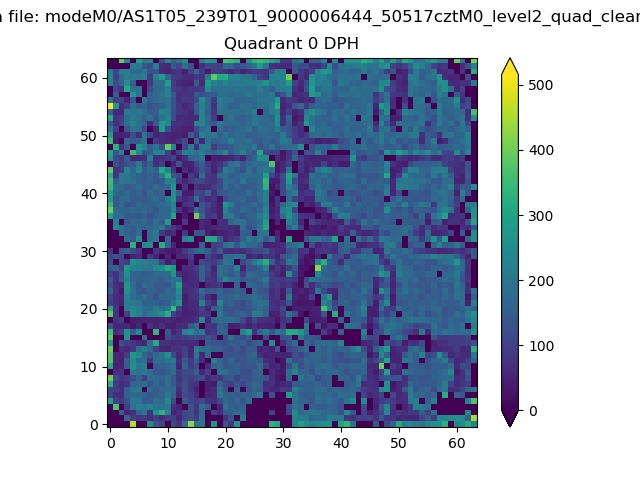 |
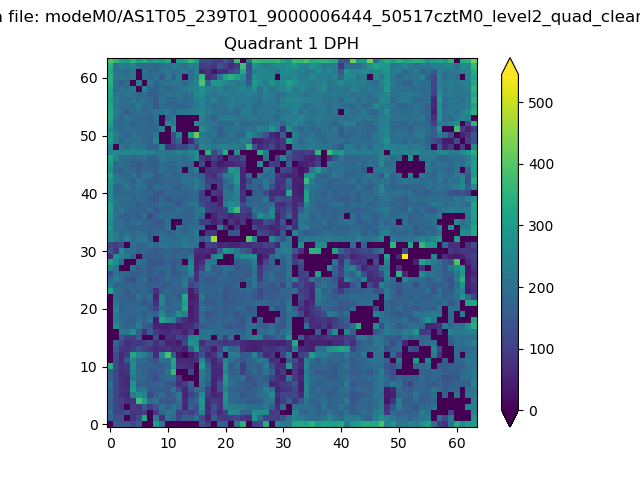 |
Quadrant B |
|---|---|---|---|
| Quadrant D | 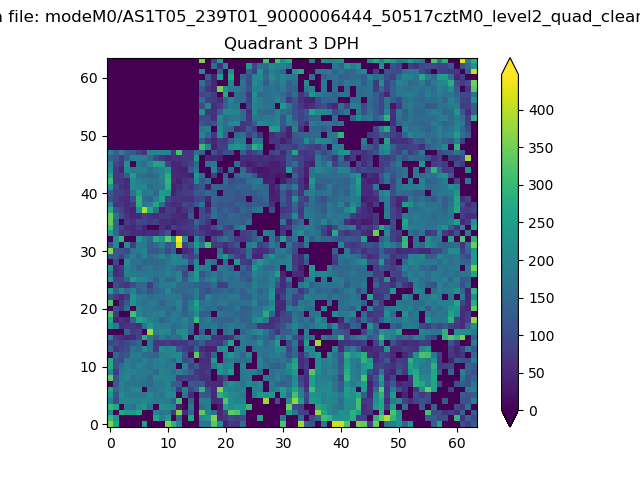 |
 |
Quadrant C |
| Plot type | Count rate plots | Images |
|---|---|---|
| Comparison with Poisson distribution Blue bars denote a histogram of data divided into 1 sec bins. Red curve is a Poisson curve with rate = median count rate of data. |
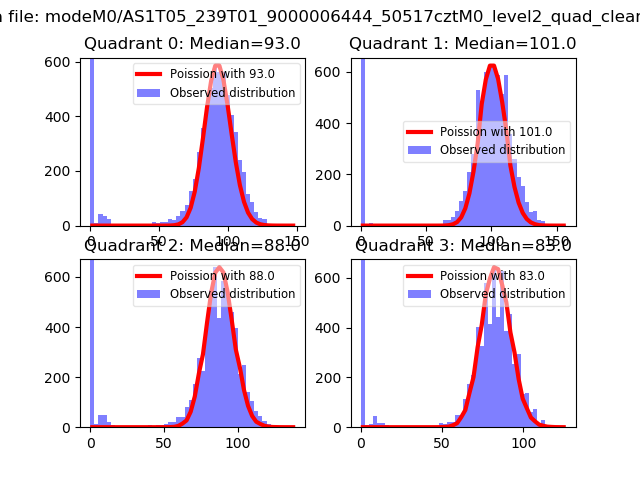 |
 |
| Quadrant-wise count rates Data is divided into 100 sec bins |
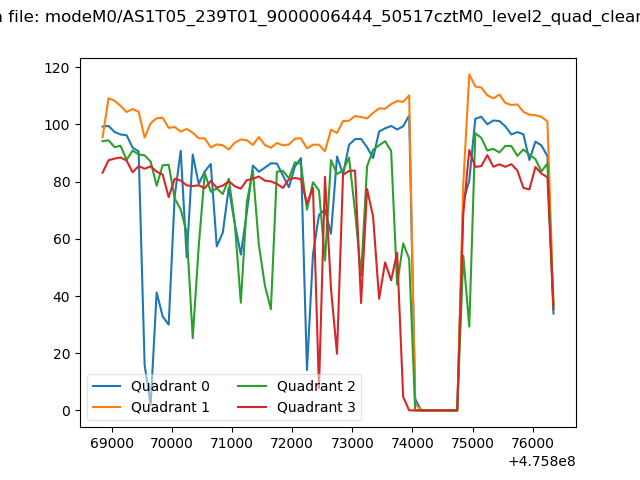 |
|
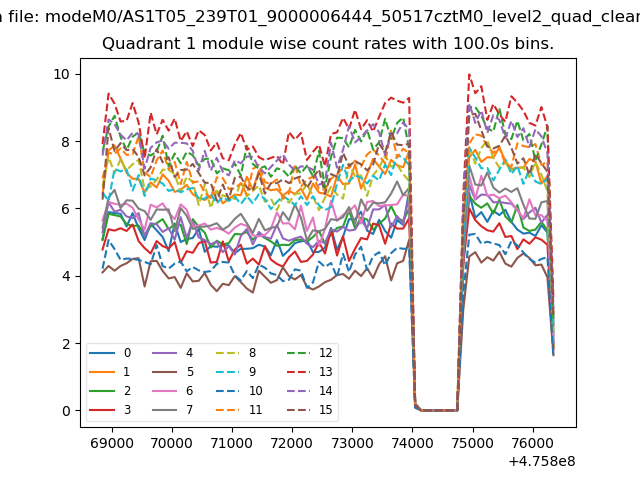
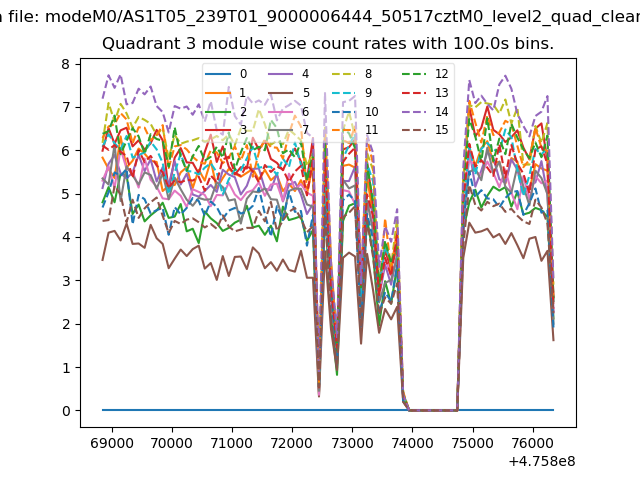
| Module-wise count rates for Quadrant A Data is divided into 100 sec bins |
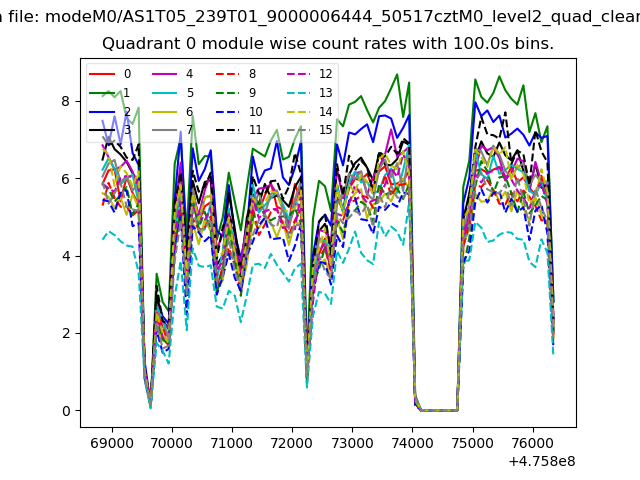 |
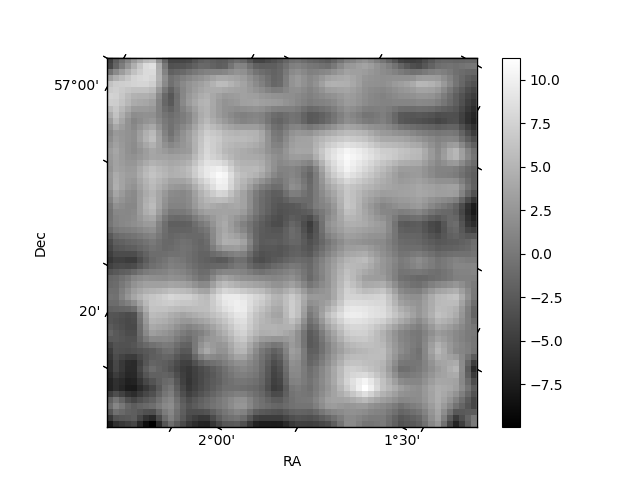 |
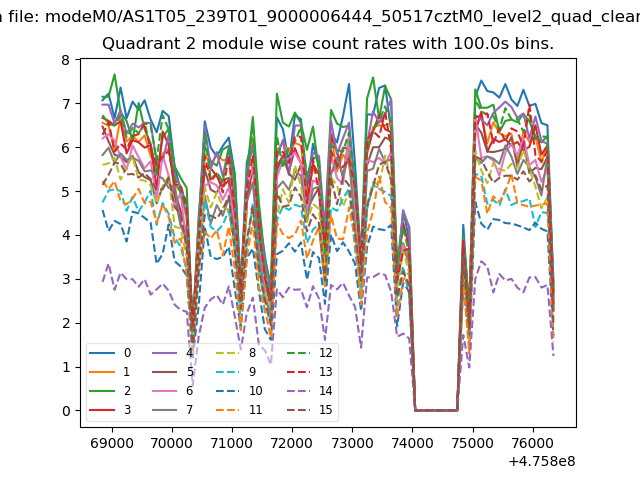
| Module-wise count rates for Quadrant B Data is divided into 100 sec bins |
 |
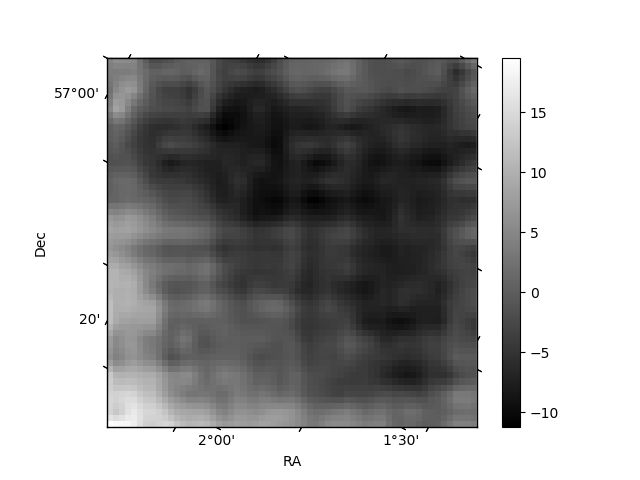 |
| Module-wise count rates for Quadrant C Data is divided into 100 sec bins |
 |
 |
| Module-wise count rates for Quadrant D Data is divided into 100 sec bins |
 |
 |
| Parameter | Plot |
|---|---|
| CZT HV Monitor | 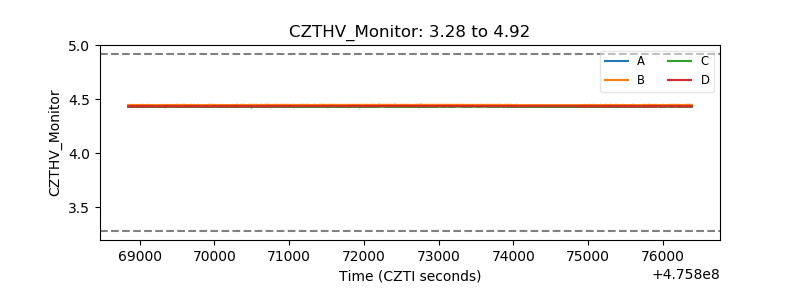 |
| D_VDD | 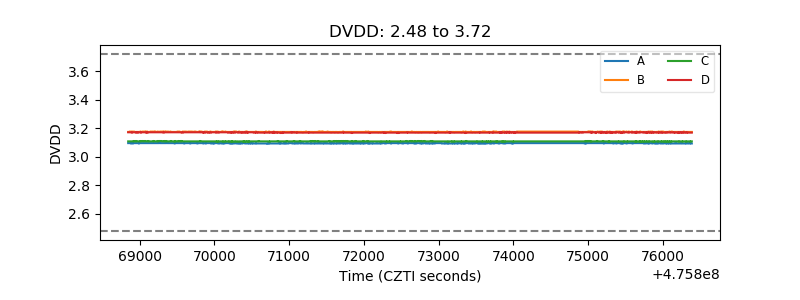 |
| Temperature 1 | 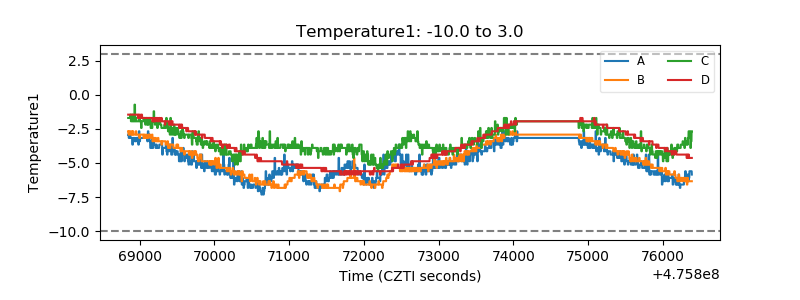 |
| Veto HV Monitor |  |
| Veto LLD | 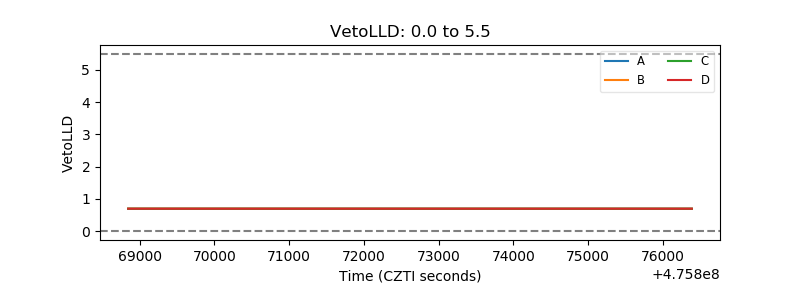 |
| Alpha Counter | 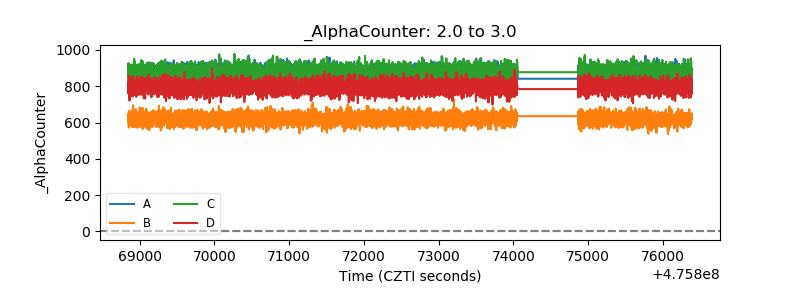 |
| _CPM_Rate | 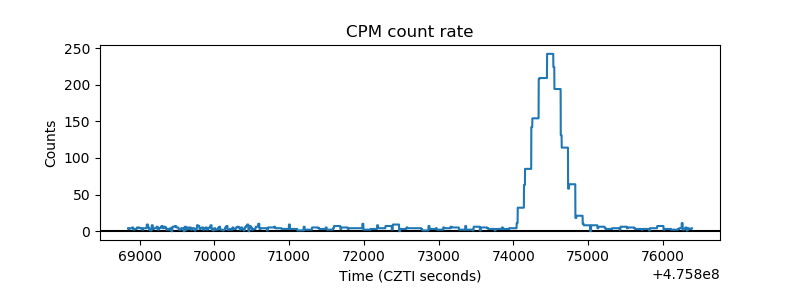 |
| CZT Counter | 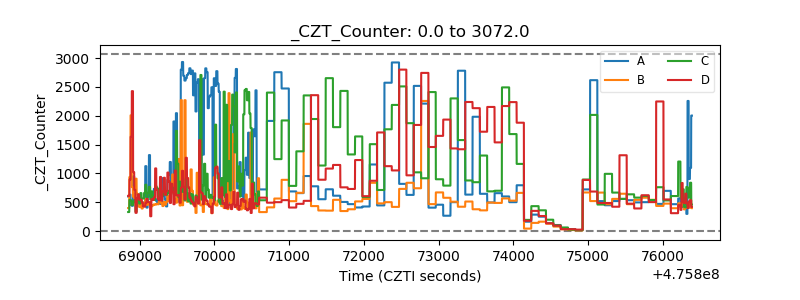 |
| +2.5 Volts monitor |  |
| +5 Volts monitor | 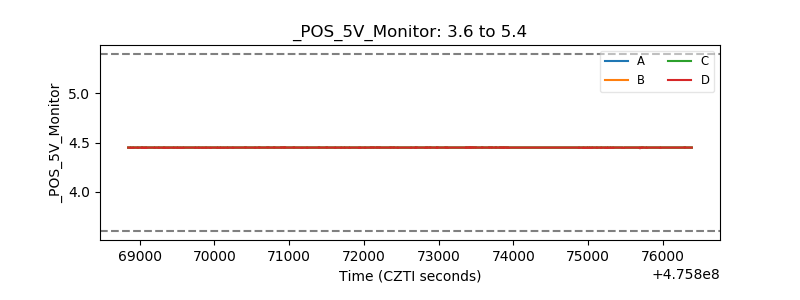 |
| _ROLL_ROT | 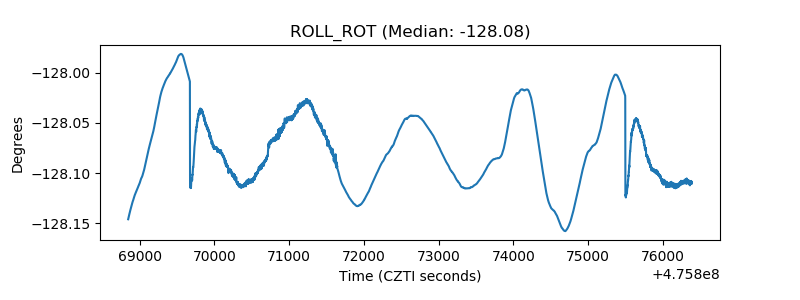 |
| _Roll_DEC | 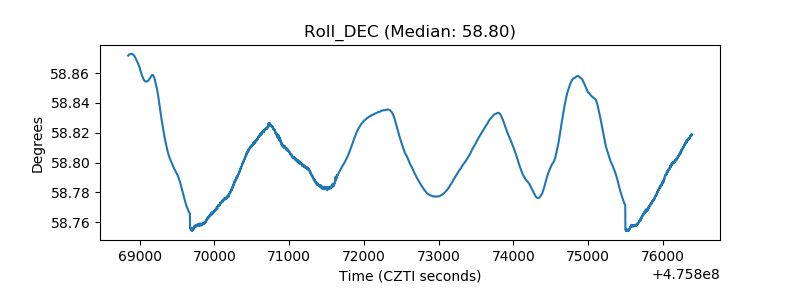 |
| _Roll_RA | 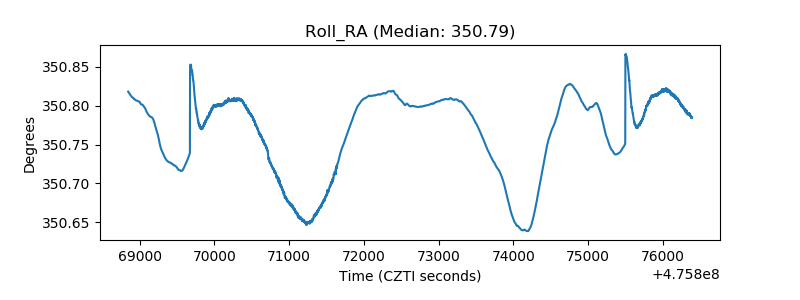 |
| Veto Counter | 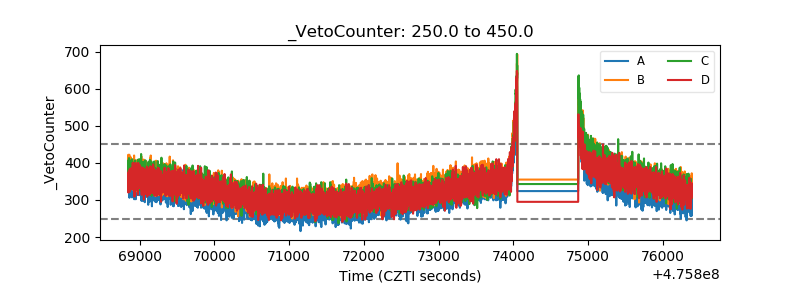 |