| Param | Original file | Final file |
|---|---|---|
| Filename | modeM0/AS1T05_239T01_9000006444_50518cztM0_level2.fits | modeM0/AS1T05_239T01_9000006444_50518cztM0_level2_quad_clean.evt |
| Size (bytes) | 567,054,720 | 95,918,400 |
| Size | 540.8 MB | 91.5 MB |
| Events in quadrant A | 5,549,835 | 601,527 |
| Events in quadrant B | 3,853,211 | 685,147 |
| Events in quadrant C | 5,782,270 | 584,174 |
| Events in quadrant D | 5,278,873 | 560,035 |
| Mode M0 | |||
|---|---|---|---|
| Quadrant | BADHDUFLAG | Total packets | Discarded packets |
| A | 0 | 20954 | 3 |
| B | 0 | 16153 | 2 |
| C | 0 | 21818 | 2 |
| D | 0 | 20402 | 2 |
| Mode M9 | |||
|---|---|---|---|
| Quadrant | BADHDUFLAG | Total packets | Discarded packets |
| A | 0 | 17 | 0 |
| B | 0 | 18 | 0 |
| C | 0 | 18 | 0 |
| D | 0 | 18 | 0 |
| Mode SS | |||
|---|---|---|---|
| Quadrant | BADHDUFLAG | Total packets | Discarded packets |
| A | 0 | 140 | 0 |
| B | 0 | 140 | 0 |
| C | 0 | 140 | 0 |
| D | 0 | 140 | 0 |
| Quadrant | Total seconds | Saturated seconds | Saturation percentage |
|---|---|---|---|
| A | 6790 | 611 | 8.998527% |
| B | 6790 | 222 | 3.269514% |
| C | 6790 | 526 | 7.746686% |
| D | 6790 | 378 | 5.567010% |
Noise dominated data is calculated using 1-second bins in cleaned event files. If a bin has >2000 counts, and if more than 50% of those come from <1% of pixels, then it is considered to be noise-dominated and hence unusable.
| Quadrant | # 1 sec bins | Bins with >0 counts | Bins with >2000 counts | High rate bins dominated by noise | Noise dominated (total time) | Noise dominated (detector-on time) | Marked lightcurve |
|---|---|---|---|---|---|---|---|
| A | 7790 | 6791 | 499 | 499 | 6.41% | 7.35% | 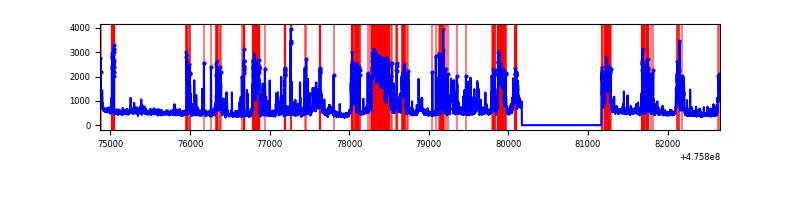 |
| B | 7790 | 6791 | 130 | 130 | 1.67% | 1.91% | 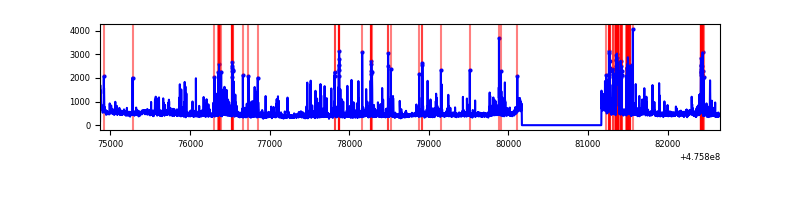 |
| C | 7790 | 6791 | 428 | 428 | 5.49% | 6.30% | 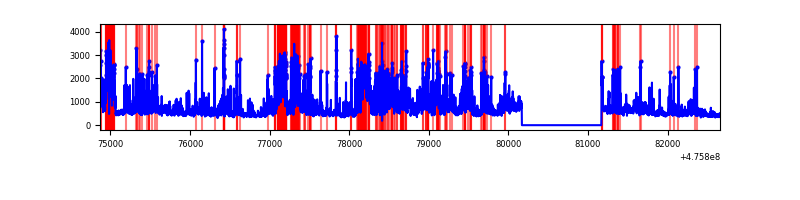 |
| D | 7790 | 6791 | 350 | 350 | 4.49% | 5.15% | 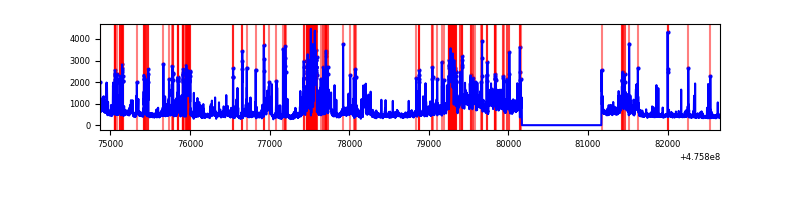 |
Top three noisy pixels from each quadrant. If the there are fewer than three noisy pixels in the level2.evt file, extra rows are filled as -1
| Pixel properties | Quadrant properties | ||||||
|---|---|---|---|---|---|---|---|
| Quadrant | DetID | PixID | Counts | Sigma | Mean | Median | Sigma |
| A | 12 | 250 | 1204402 | 6906.5 | 709 | 689 | 174.3 |
| A | 8 | 247 | 287929 | 1648.09 | 709 | 689 | 174.3 |
| A | 4 | 3 | 281270 | 1609.88 | 709 | 689 | 174.3 |
| B | 7 | 0 | 288548 | 1878.04 | 722 | 698 | 153.3 |
| B | 12 | 18 | 254423 | 1655.4 | 722 | 698 | 153.3 |
| B | 4 | 170 | 69712 | 450.27 | 722 | 698 | 153.3 |
| C | 13 | 3 | 540492 | 2764.85 | 703 | 695 | 195.2 |
| C | 12 | 249 | 371629 | 1899.93 | 703 | 695 | 195.2 |
| C | 15 | 235 | 247011 | 1261.64 | 703 | 695 | 195.2 |
| D | 6 | 42 | 721628 | 3696.19 | 698 | 673 | 195.1 |
| D | 7 | 61 | 583904 | 2990.11 | 698 | 673 | 195.1 |
| D | 1 | 7 | 280405 | 1434.13 | 698 | 673 | 195.1 |
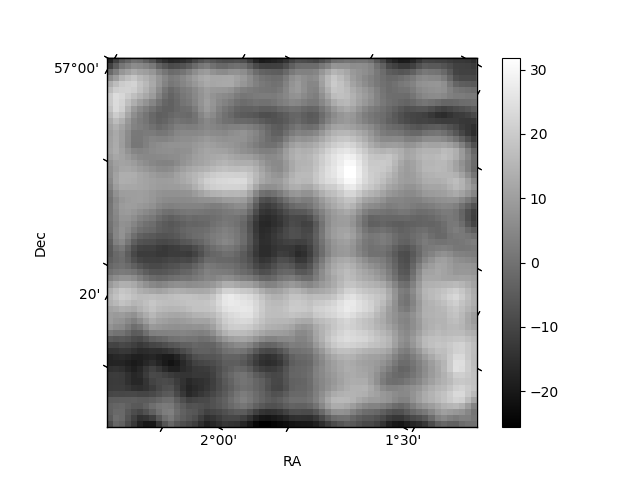
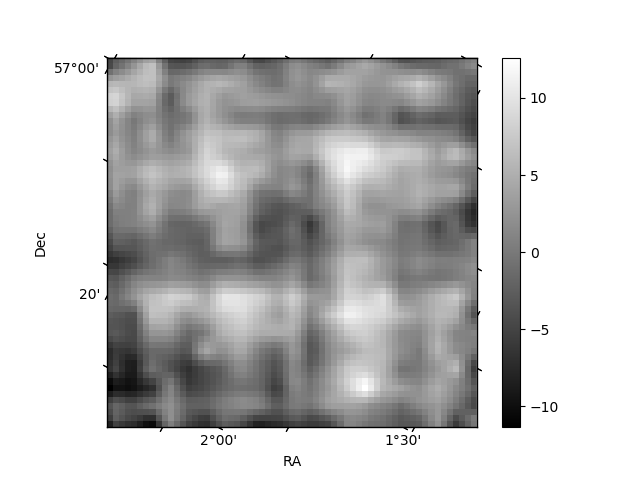
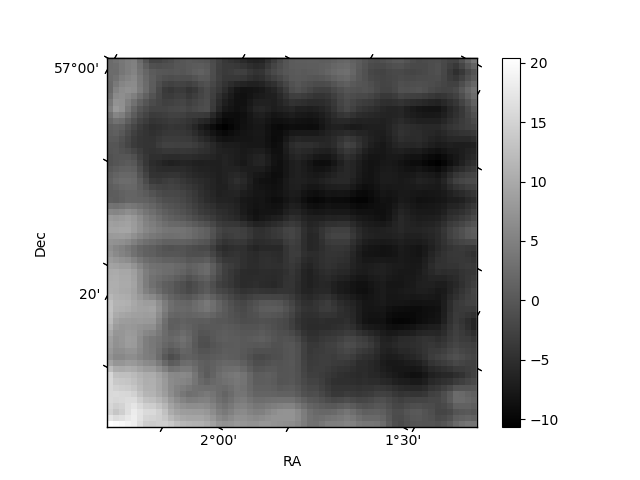
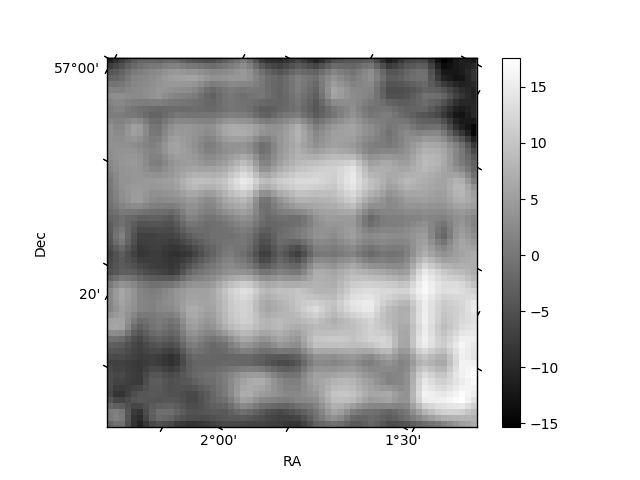
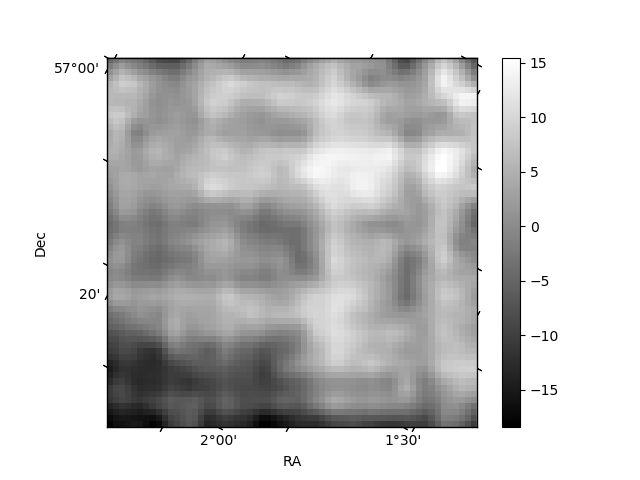
Histogram calculated using DETX and DETY for each event in the final _common_clean file
| Quadrant A | 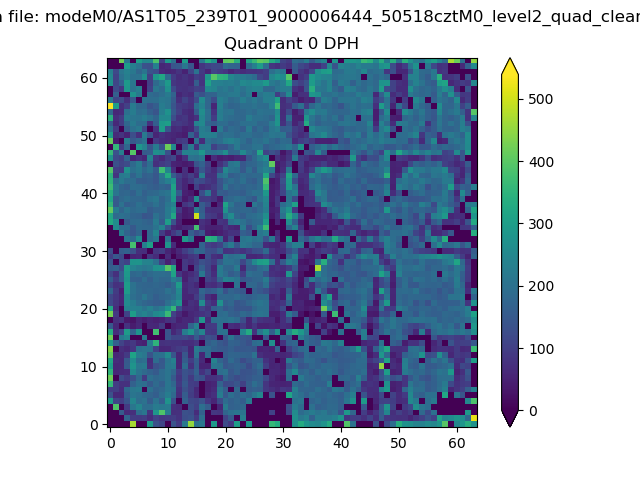 |
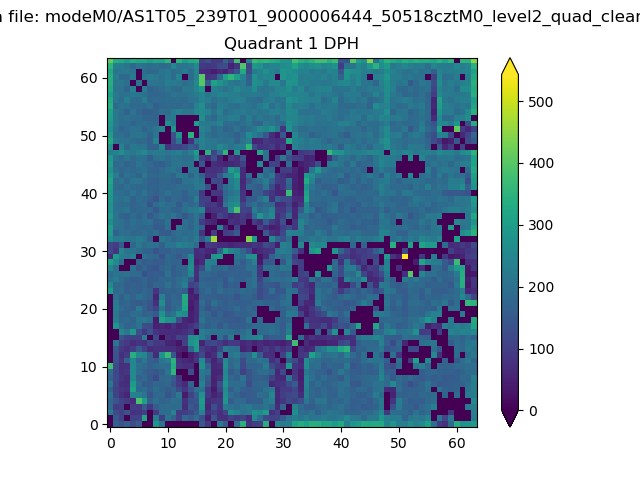 |
Quadrant B |
|---|---|---|---|
| Quadrant D | 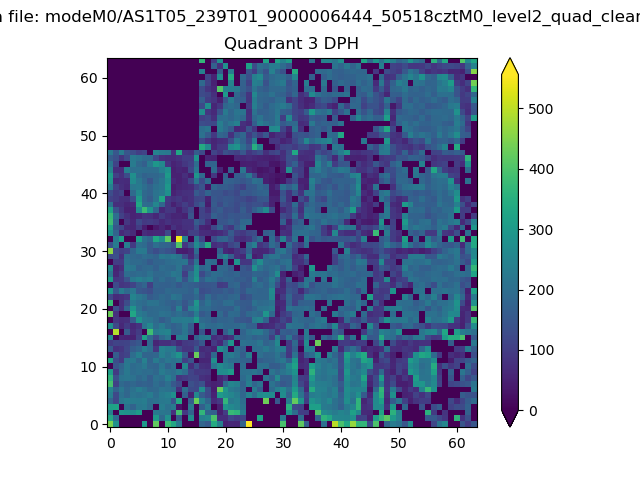 |
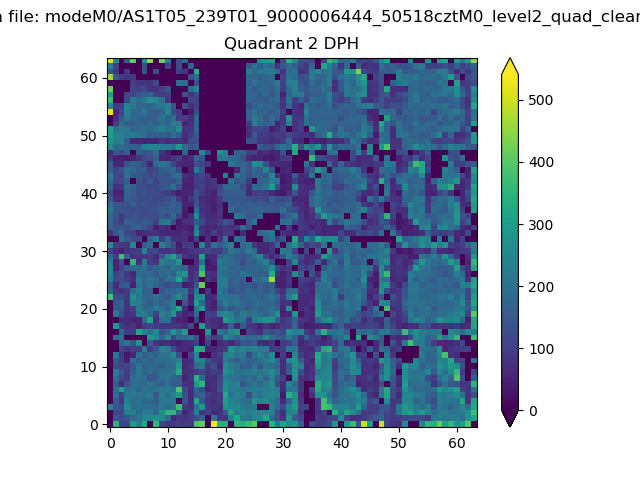 |
Quadrant C |
| Plot type | Count rate plots | Images |
|---|---|---|
| Comparison with Poisson distribution Blue bars denote a histogram of data divided into 1 sec bins. Red curve is a Poisson curve with rate = median count rate of data. |
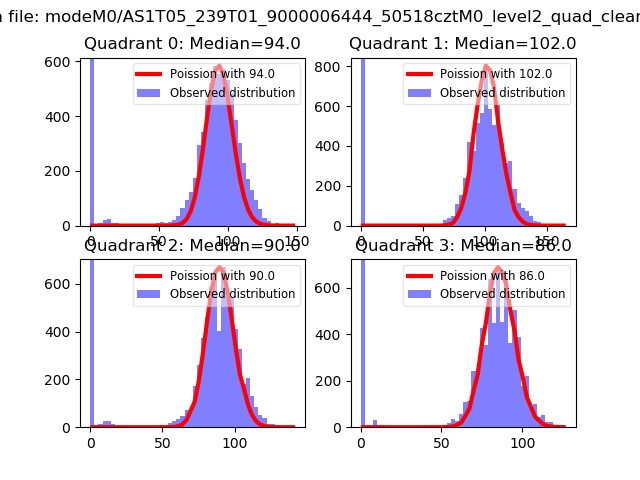 |
 |
| Quadrant-wise count rates Data is divided into 100 sec bins |
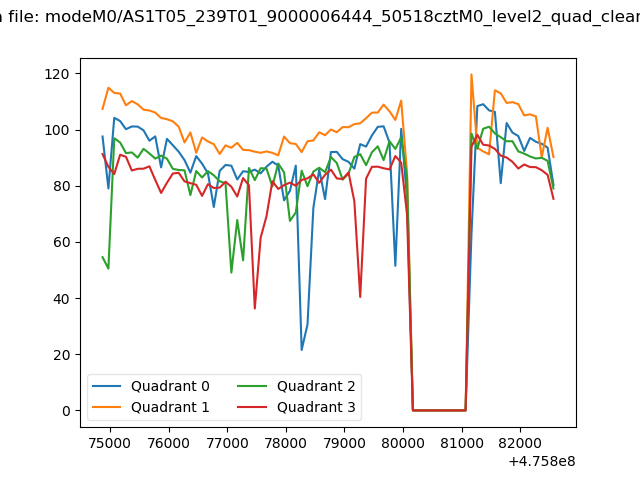 |
|
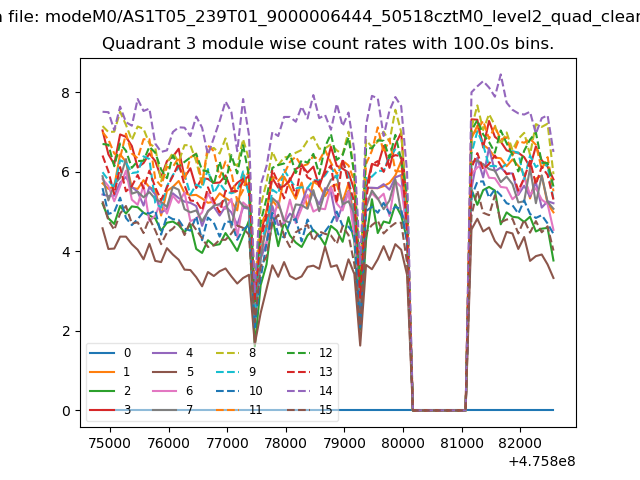
| Module-wise count rates for Quadrant A Data is divided into 100 sec bins |
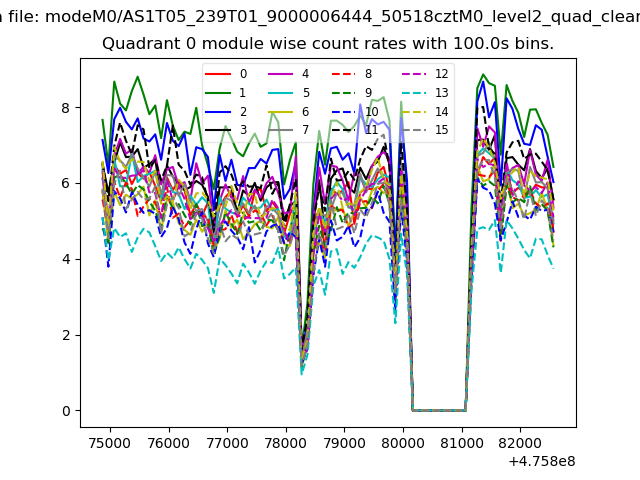 |
 |
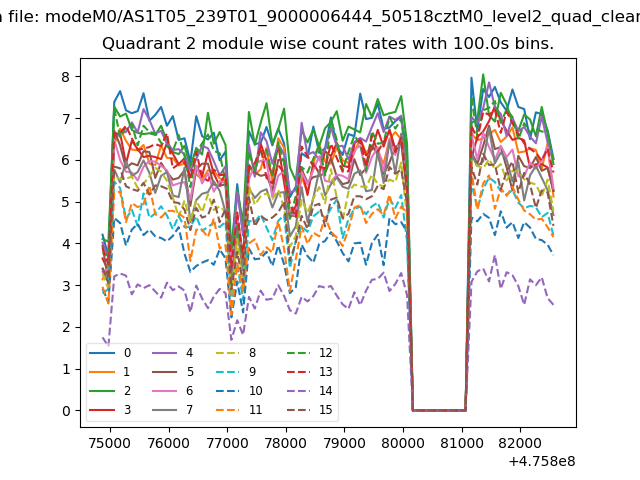
| Module-wise count rates for Quadrant B Data is divided into 100 sec bins |
 |
 |
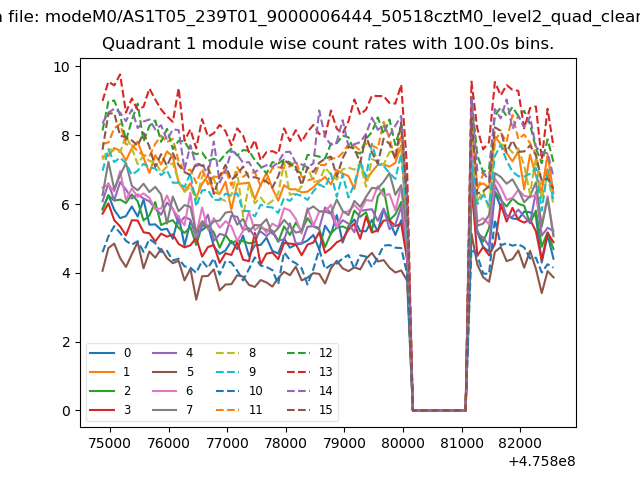
| Module-wise count rates for Quadrant C Data is divided into 100 sec bins |
 |
 |
| Module-wise count rates for Quadrant D Data is divided into 100 sec bins |
 |
 |
| Parameter | Plot |
|---|---|
| CZT HV Monitor |  |
| D_VDD | 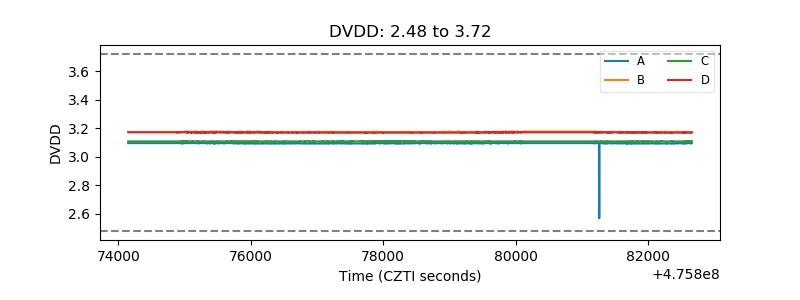 |
| Temperature 1 | 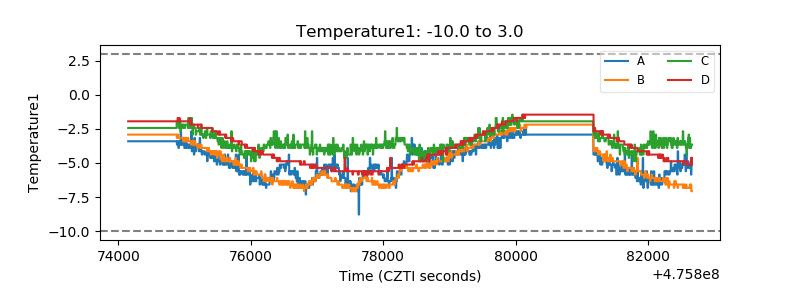 |
| Veto HV Monitor | 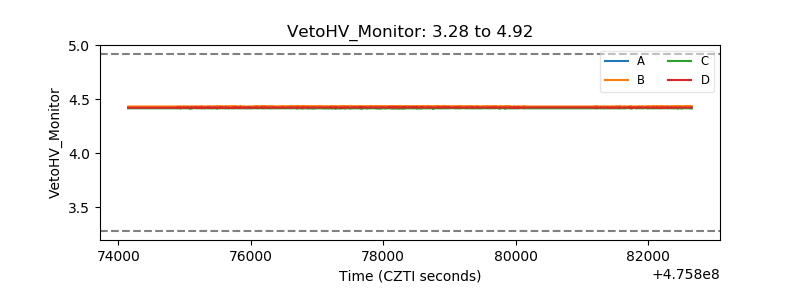 |
| Veto LLD | 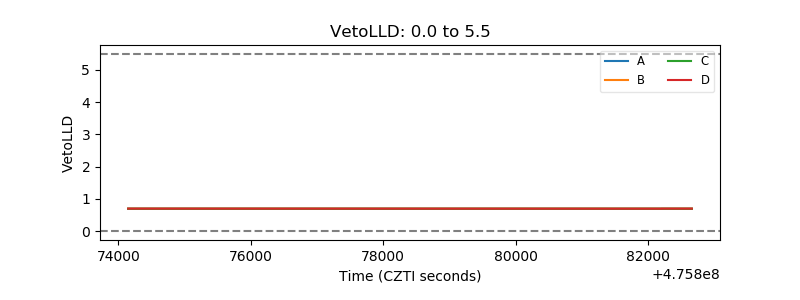 |
| Alpha Counter | 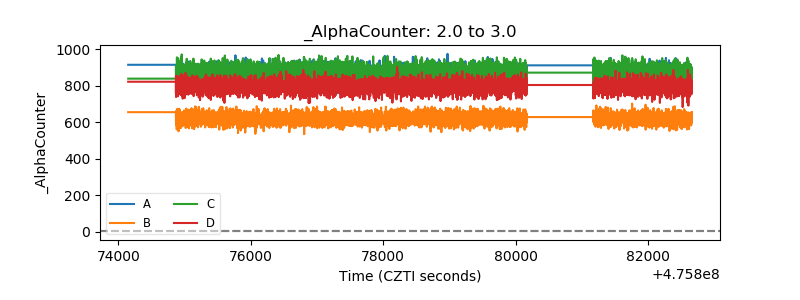 |
| _CPM_Rate | 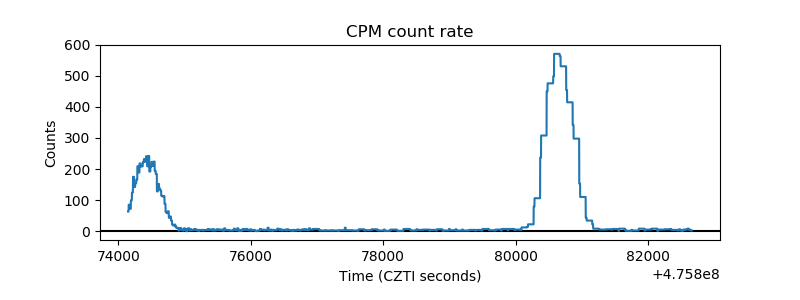 |
| CZT Counter | 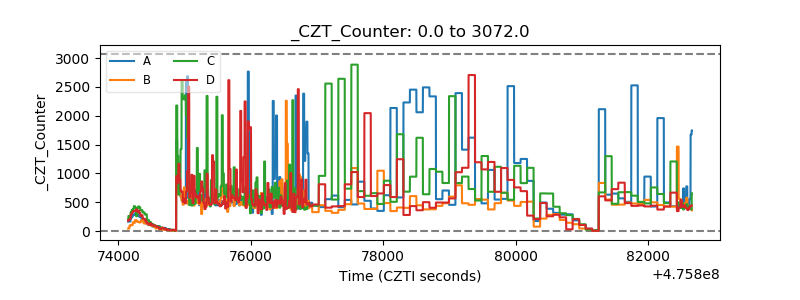 |
| +2.5 Volts monitor |  |
| +5 Volts monitor | 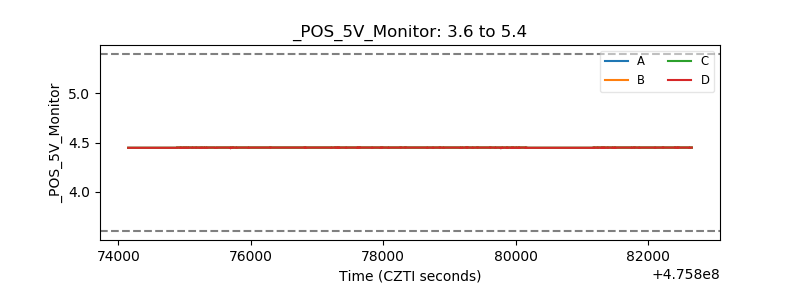 |
| _ROLL_ROT | 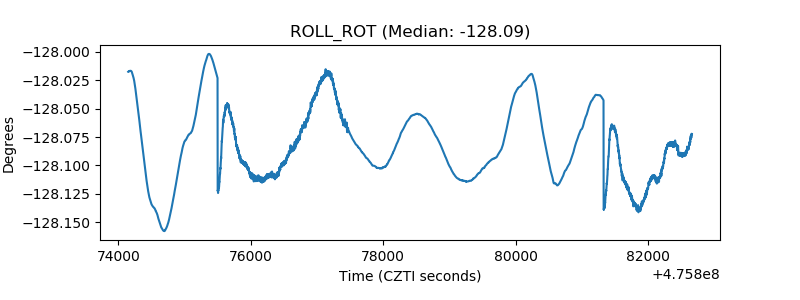 |
| _Roll_DEC | 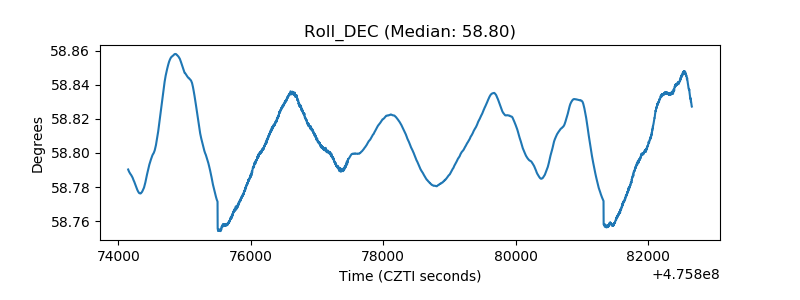 |
| _Roll_RA | 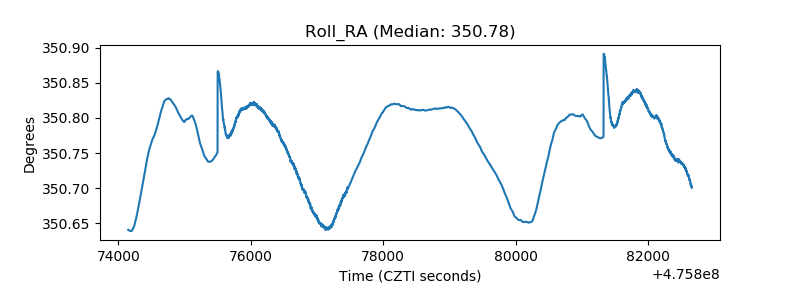 |
| Veto Counter | 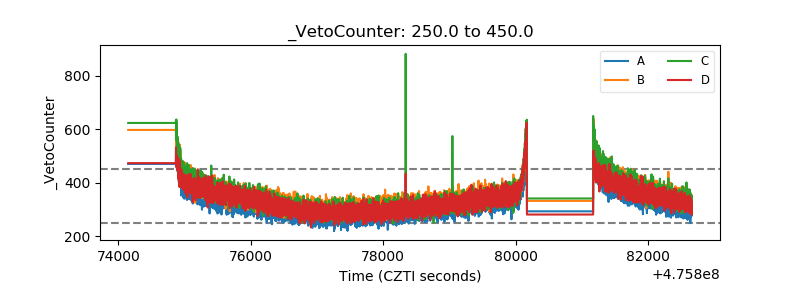 |