| Param | Original file | Final file |
|---|---|---|
| Filename | modeM0/AS1T05_239T01_9000006444_50520cztM0_level2.fits | modeM0/AS1T05_239T01_9000006444_50520cztM0_level2_quad_clean.evt |
| Size (bytes) | 539,956,800 | 94,728,960 |
| Size | 514.9 MB | 90.3 MB |
| Events in quadrant A | 5,038,665 | 601,874 |
| Events in quadrant B | 3,719,145 | 690,120 |
| Events in quadrant C | 5,059,474 | 597,653 |
| Events in quadrant D | 5,655,136 | 516,195 |
| Mode M0 | |||
|---|---|---|---|
| Quadrant | BADHDUFLAG | Total packets | Discarded packets |
| A | 0 | 19401 | 2 |
| B | 0 | 15622 | 2 |
| C | 0 | 19572 | 2 |
| D | 0 | 21544 | 2 |
| Mode M9 | |||
|---|---|---|---|
| Quadrant | BADHDUFLAG | Total packets | Discarded packets |
| A | 0 | 12 | 0 |
| B | 0 | 12 | 0 |
| C | 0 | 13 | 0 |
| D | 0 | 13 | 0 |
| Mode SS | |||
|---|---|---|---|
| Quadrant | BADHDUFLAG | Total packets | Discarded packets |
| A | 0 | 134 | 0 |
| B | 0 | 134 | 0 |
| C | 0 | 134 | 0 |
| D | 0 | 134 | 0 |
| Quadrant | Total seconds | Saturated seconds | Saturation percentage |
|---|---|---|---|
| A | 6635 | 481 | 7.249435% |
| B | 6635 | 180 | 2.712886% |
| C | 6635 | 361 | 5.440844% |
| D | 6635 | 842 | 12.690279% |
Noise dominated data is calculated using 1-second bins in cleaned event files. If a bin has >2000 counts, and if more than 50% of those come from <1% of pixels, then it is considered to be noise-dominated and hence unusable.
| Quadrant | # 1 sec bins | Bins with >0 counts | Bins with >2000 counts | High rate bins dominated by noise | Noise dominated (total time) | Noise dominated (detector-on time) | Marked lightcurve |
|---|---|---|---|---|---|---|---|
| A | 7760 | 6636 | 389 | 389 | 5.01% | 5.86% | 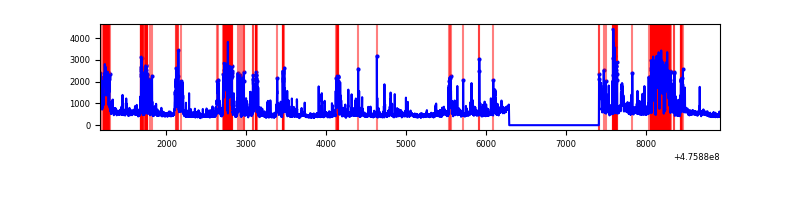 |
| B | 7760 | 6636 | 119 | 119 | 1.53% | 1.79% | 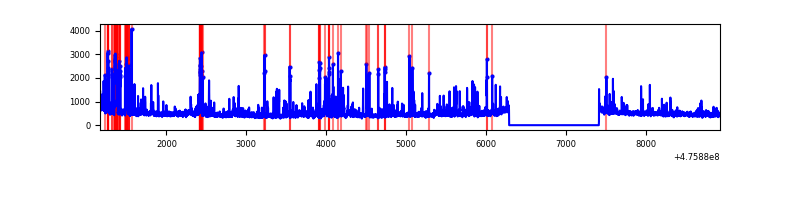 |
| C | 7760 | 6635 | 252 | 252 | 3.25% | 3.80% | 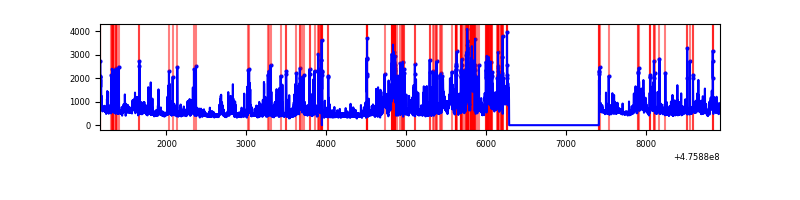 |
| D | 7760 | 6636 | 763 | 763 | 9.83% | 11.50% | 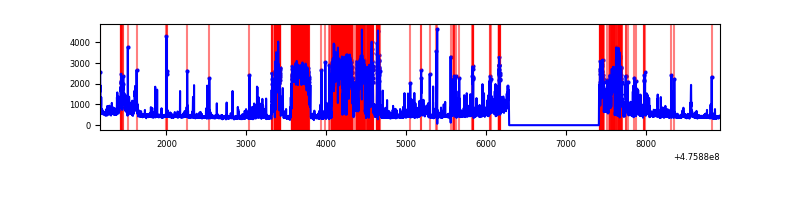 |
Top three noisy pixels from each quadrant. If the there are fewer than three noisy pixels in the level2.evt file, extra rows are filled as -1
| Pixel properties | Quadrant properties | ||||||
|---|---|---|---|---|---|---|---|
| Quadrant | DetID | PixID | Counts | Sigma | Mean | Median | Sigma |
| A | 4 | 249 | 684173 | 3971.71 | 700 | 683 | 172.1 |
| A | 12 | 250 | 517562 | 3003.55 | 700 | 683 | 172.1 |
| A | 4 | 3 | 194561 | 1126.61 | 700 | 683 | 172.1 |
| B | 7 | 0 | 299510 | 1969.86 | 713 | 688 | 151.7 |
| B | 12 | 18 | 186684 | 1226.1 | 713 | 688 | 151.7 |
| B | 10 | 246 | 53761 | 349.86 | 713 | 688 | 151.7 |
| C | 15 | 235 | 597376 | 3125.91 | 694 | 688 | 190.9 |
| C | 15 | 196 | 260806 | 1362.7 | 694 | 688 | 190.9 |
| C | 15 | 214 | 218011 | 1138.5 | 694 | 688 | 190.9 |
| D | 0 | 19 | 964806 | 5251.65 | 656 | 633 | 183.6 |
| D | 15 | 184 | 882364 | 4802.61 | 656 | 633 | 183.6 |
| D | 6 | 42 | 453388 | 2466.06 | 656 | 633 | 183.6 |
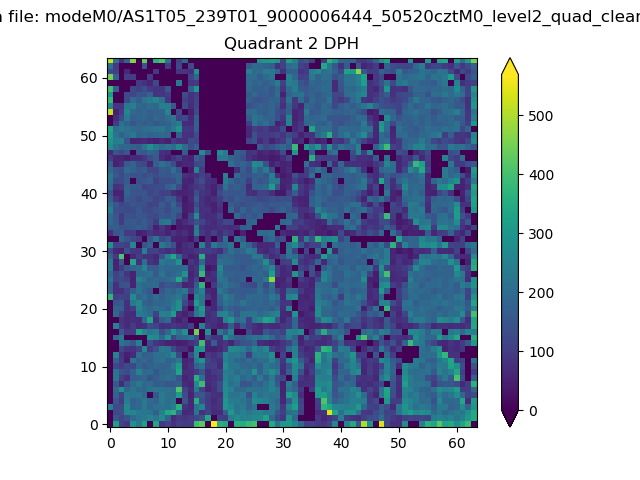
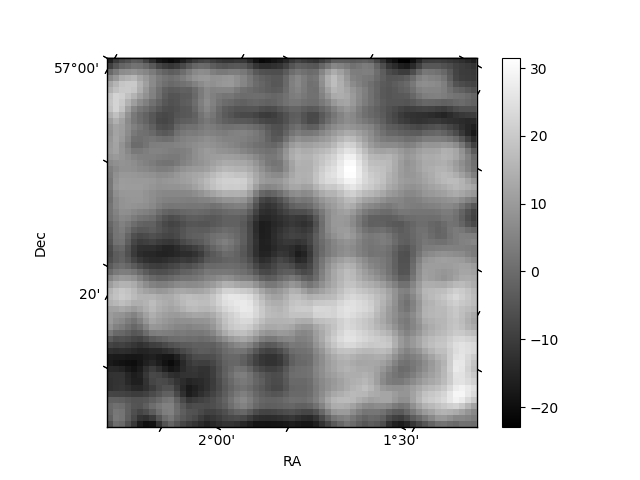
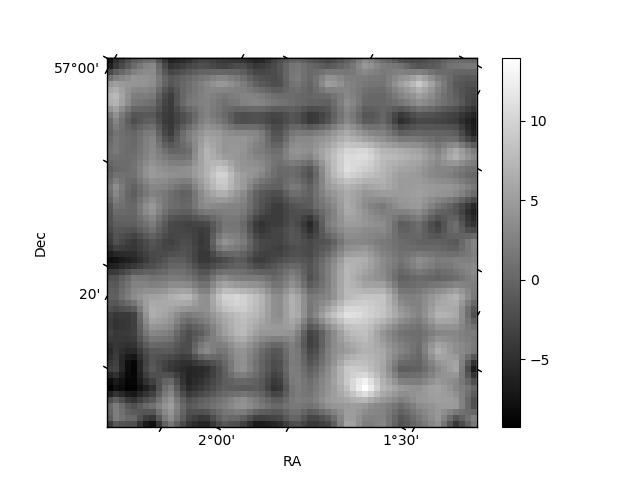
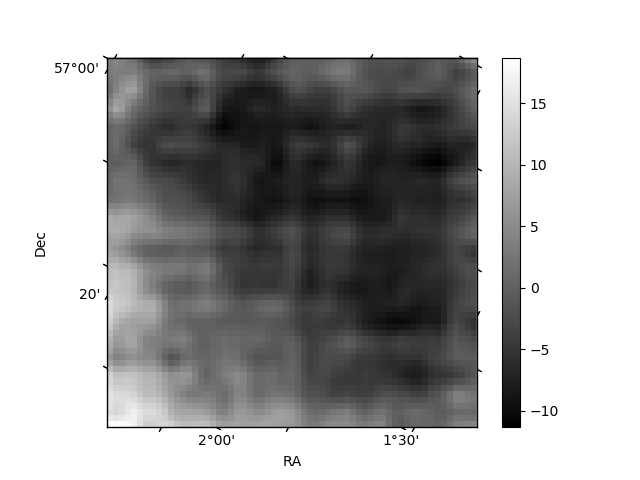
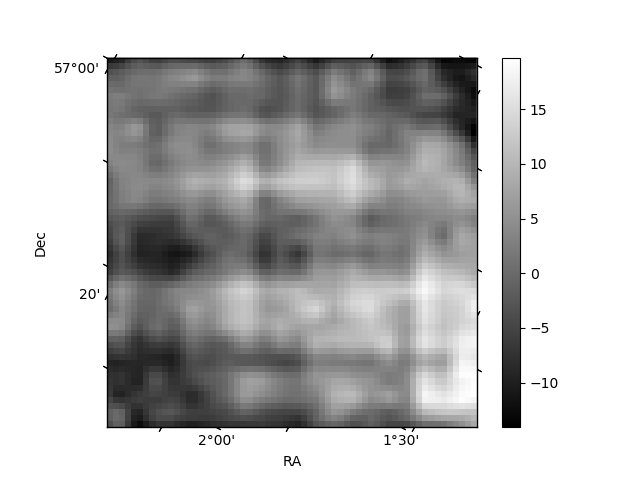
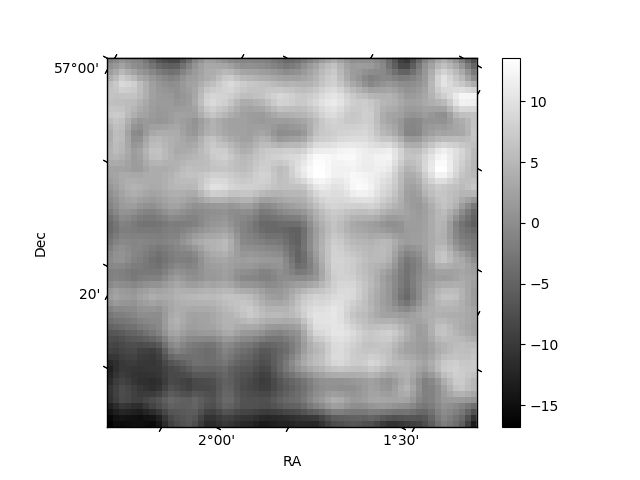
Histogram calculated using DETX and DETY for each event in the final _common_clean file
| Quadrant A | 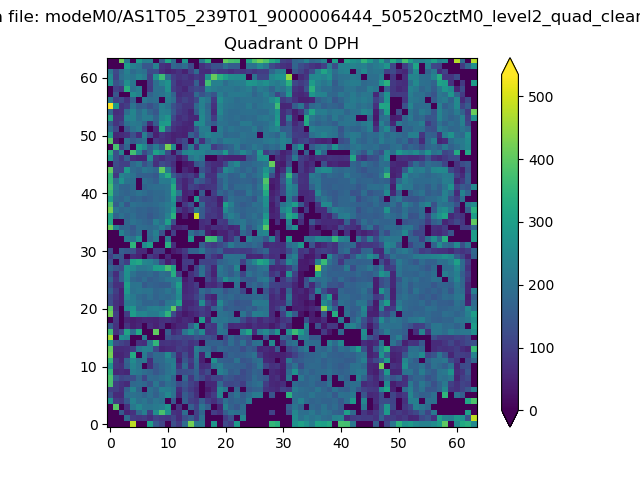 |
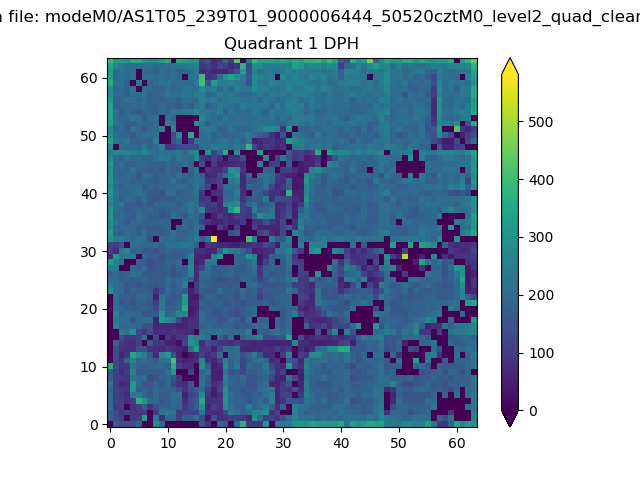 |
Quadrant B |
|---|---|---|---|
| Quadrant D | 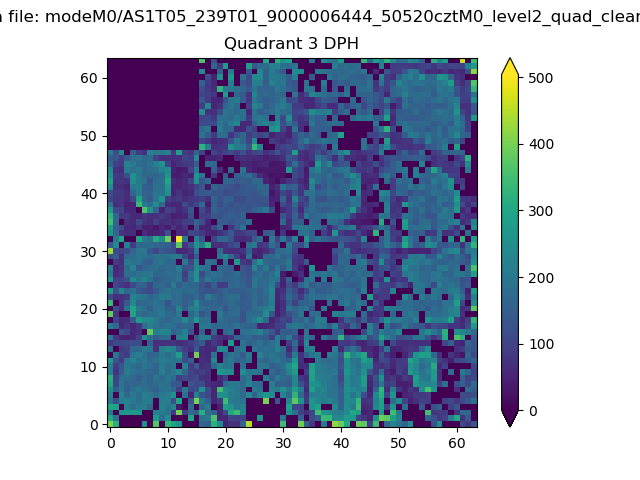 |
 |
Quadrant C |
| Plot type | Count rate plots | Images |
|---|---|---|
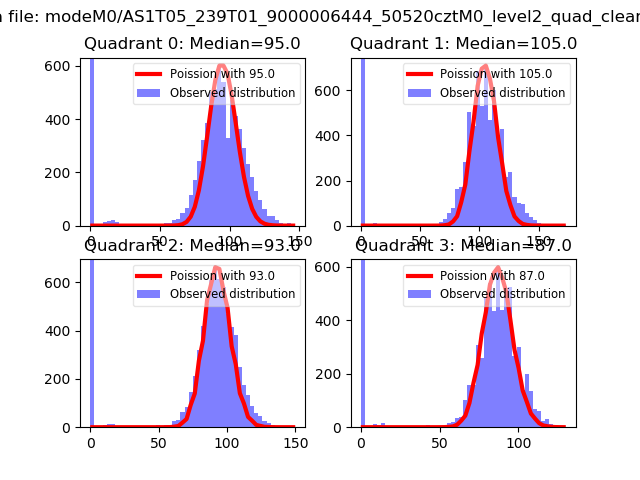
| Comparison with Poisson distribution Blue bars denote a histogram of data divided into 1 sec bins. Red curve is a Poisson curve with rate = median count rate of data. |
 |
 |
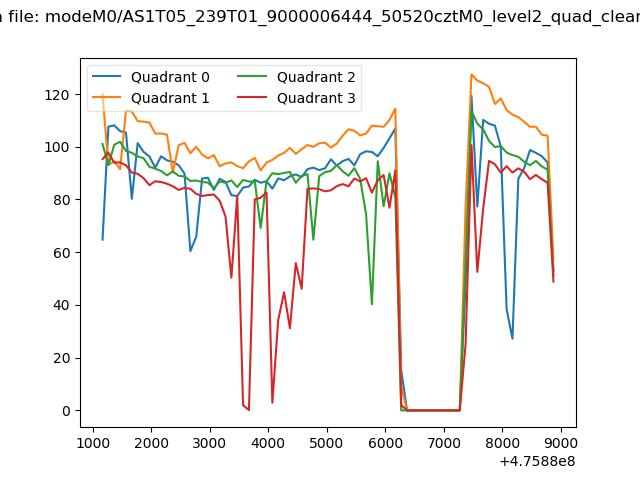
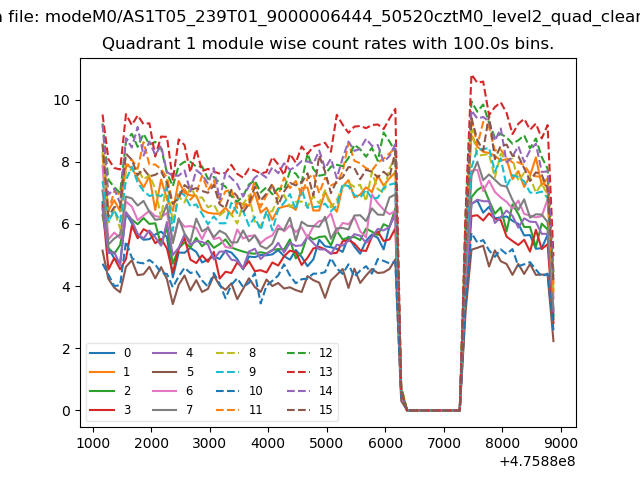
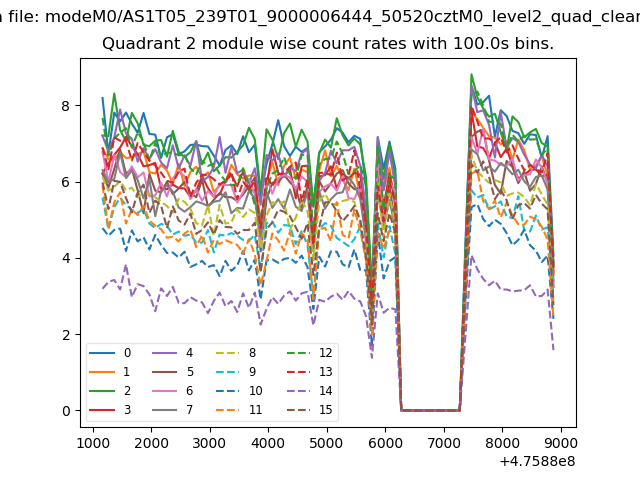
| Quadrant-wise count rates Data is divided into 100 sec bins |
 |
|
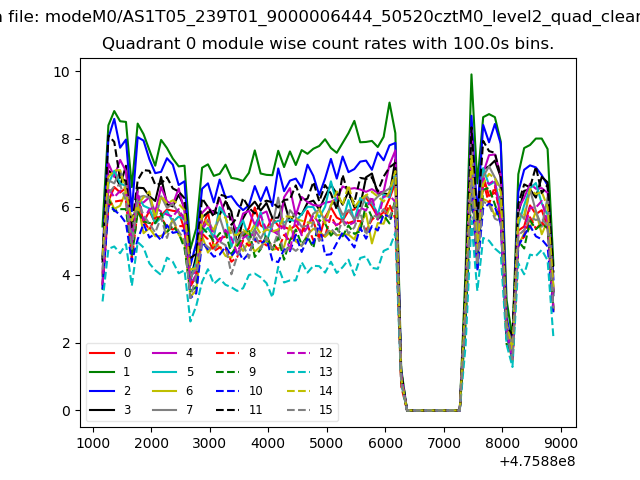
| Module-wise count rates for Quadrant A Data is divided into 100 sec bins |
 |
 |
| Module-wise count rates for Quadrant B Data is divided into 100 sec bins |
 |
 |
| Module-wise count rates for Quadrant C Data is divided into 100 sec bins |
 |
 |
| Module-wise count rates for Quadrant D Data is divided into 100 sec bins |
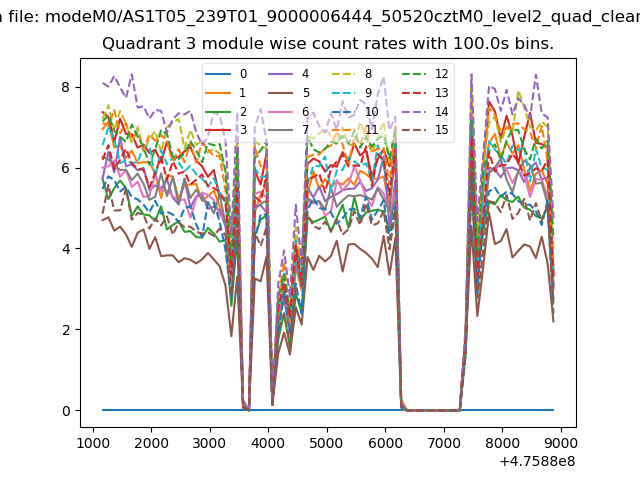 |
 |
| Parameter | Plot |
|---|---|
| CZT HV Monitor | 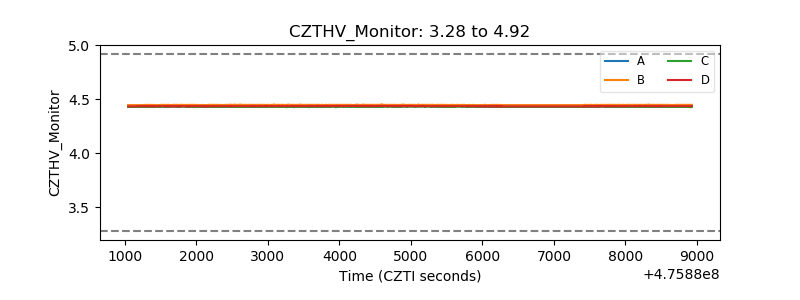 |
| D_VDD | 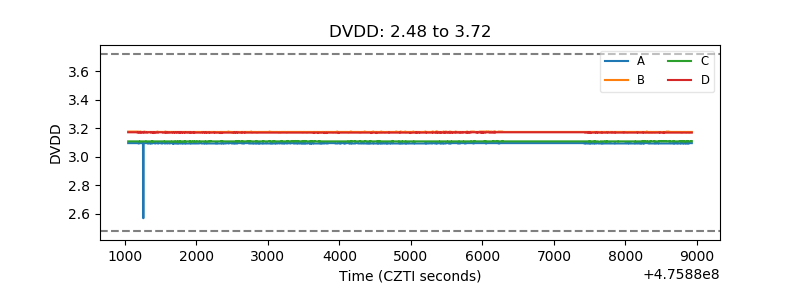 |
| Temperature 1 | 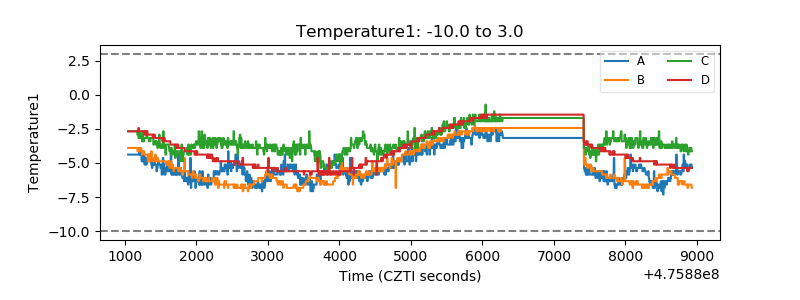 |
| Veto HV Monitor | 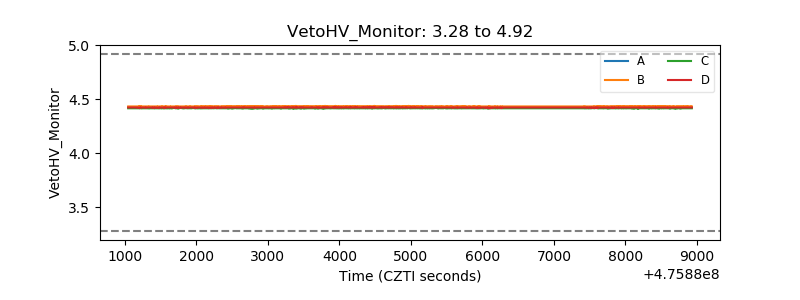 |
| Veto LLD | 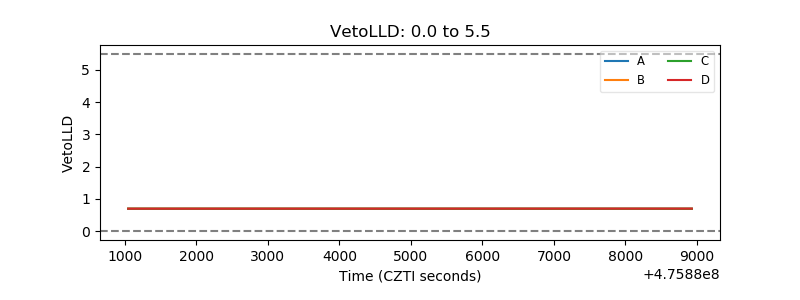 |
| Alpha Counter | 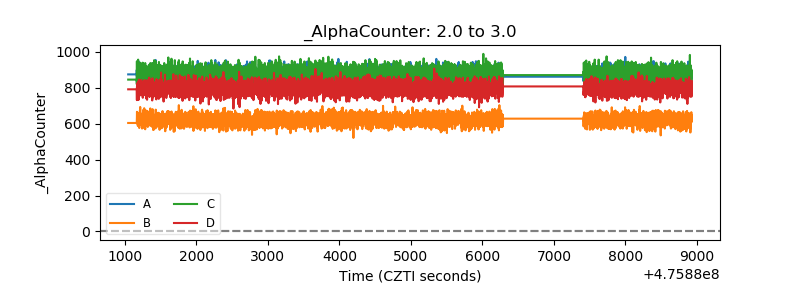 |
| _CPM_Rate | 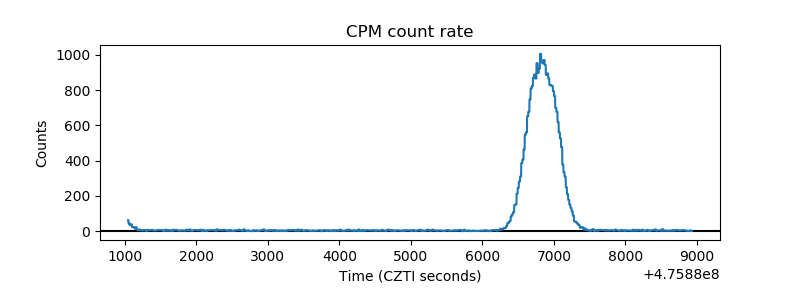 |
| CZT Counter | 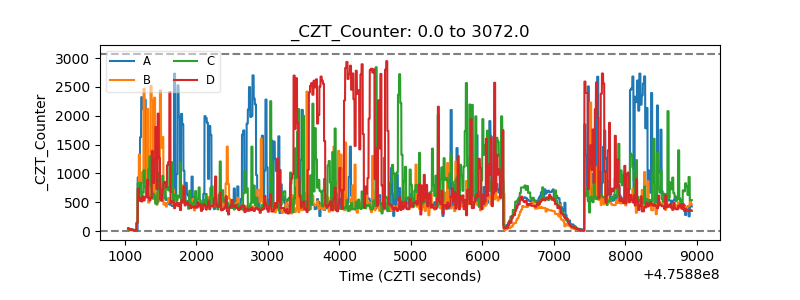 |
| +2.5 Volts monitor |  |
| +5 Volts monitor |  |
| _ROLL_ROT | 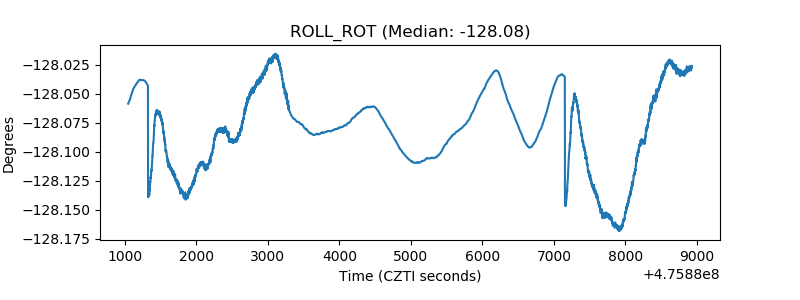 |
| _Roll_DEC | 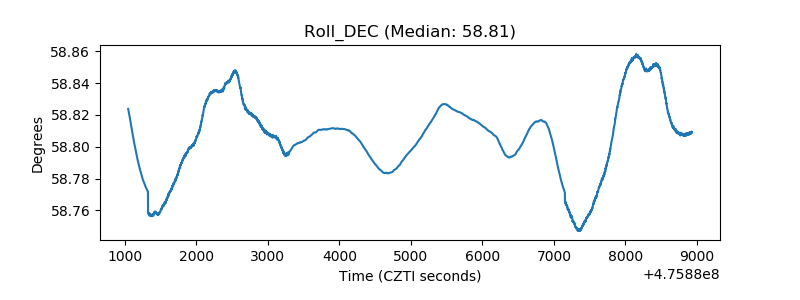 |
| _Roll_RA | 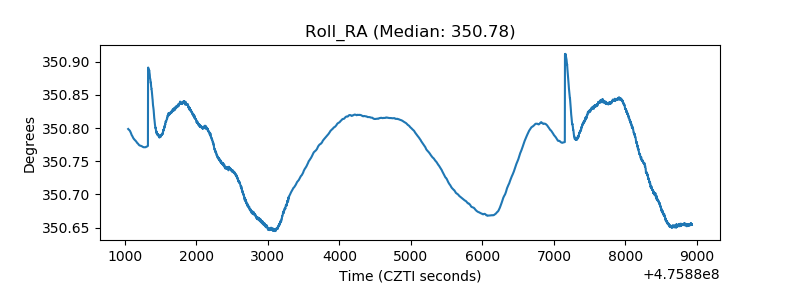 |
| Veto Counter | 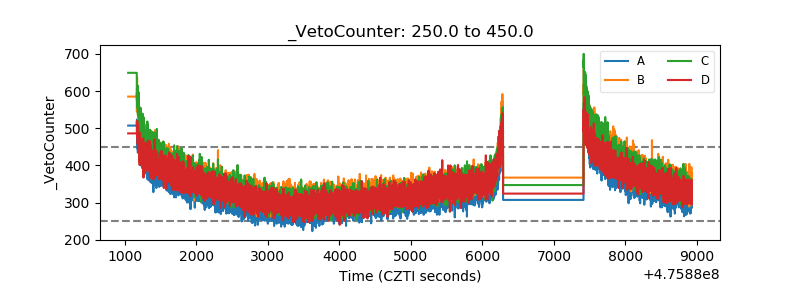 |