| Param | Original file | Final file |
|---|---|---|
| Filename | modeM0/AS1T05_239T01_9000006444_50521cztM0_level2.fits | modeM0/AS1T05_239T01_9000006444_50521cztM0_level2_quad_clean.evt |
| Size (bytes) | 630,515,520 | 92,776,320 |
| Size | 601.3 MB | 88.5 MB |
| Events in quadrant A | 4,959,772 | 623,244 |
| Events in quadrant B | 3,590,133 | 713,447 |
| Events in quadrant C | 9,243,342 | 447,669 |
| Events in quadrant D | 5,031,955 | 562,180 |
| Mode M0 | |||
|---|---|---|---|
| Quadrant | BADHDUFLAG | Total packets | Discarded packets |
| A | 0 | 19107 | 2 |
| B | 0 | 15235 | 2 |
| C | 0 | 31988 | 2 |
| D | 0 | 19614 | 2 |
| Mode M9 | |||
|---|---|---|---|
| Quadrant | BADHDUFLAG | Total packets | Discarded packets |
| A | 0 | 14 | 0 |
| B | 0 | 15 | 0 |
| C | 0 | 15 | 0 |
| D | 0 | 15 | 0 |
| Mode SS | |||
|---|---|---|---|
| Quadrant | BADHDUFLAG | Total packets | Discarded packets |
| A | 0 | 136 | 0 |
| B | 0 | 136 | 0 |
| C | 0 | 136 | 0 |
| D | 0 | 136 | 0 |
| Quadrant | Total seconds | Saturated seconds | Saturation percentage |
|---|---|---|---|
| A | 6632 | 435 | 6.559107% |
| B | 6632 | 135 | 2.035585% |
| C | 6632 | 2163 | 32.614596% |
| D | 6632 | 496 | 7.478890% |
Noise dominated data is calculated using 1-second bins in cleaned event files. If a bin has >2000 counts, and if more than 50% of those come from <1% of pixels, then it is considered to be noise-dominated and hence unusable.
| Quadrant | # 1 sec bins | Bins with >0 counts | Bins with >2000 counts | High rate bins dominated by noise | Noise dominated (total time) | Noise dominated (detector-on time) | Marked lightcurve |
|---|---|---|---|---|---|---|---|
| A | 7827 | 6633 | 334 | 334 | 4.27% | 5.04% | 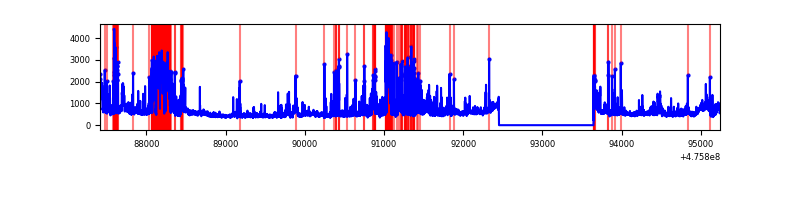 |
| B | 7827 | 6633 | 66 | 66 | 0.84% | 1.00% | 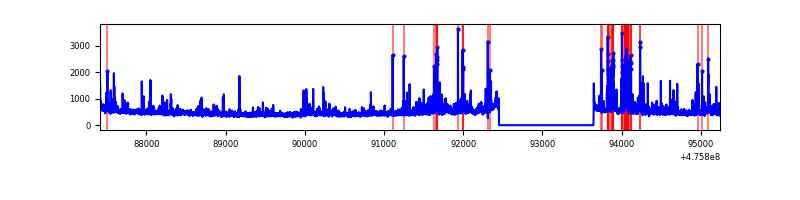 |
| C | 7827 | 6633 | 1798 | 1798 | 22.97% | 27.11% | 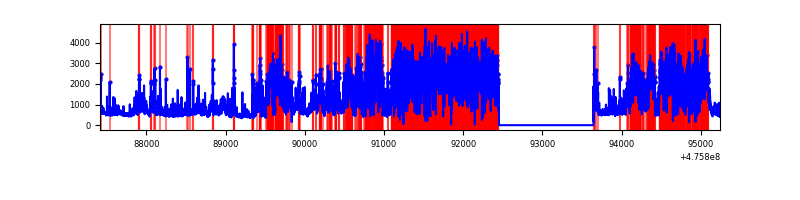 |
| D | 7827 | 6633 | 418 | 418 | 5.34% | 6.30% | 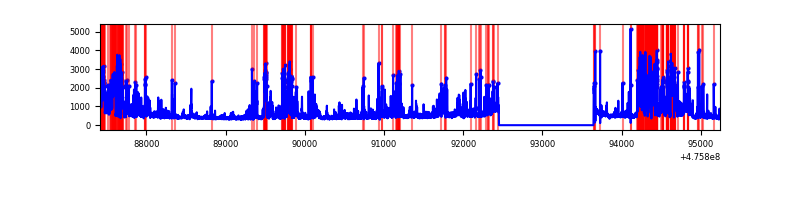 |
Top three noisy pixels from each quadrant. If the there are fewer than three noisy pixels in the level2.evt file, extra rows are filled as -1
| Pixel properties | Quadrant properties | ||||||
|---|---|---|---|---|---|---|---|
| Quadrant | DetID | PixID | Counts | Sigma | Mean | Median | Sigma |
| A | 4 | 249 | 687176 | 3847.26 | 714 | 698 | 178.4 |
| A | 3 | 130 | 540178 | 3023.43 | 714 | 698 | 178.4 |
| A | 4 | 3 | 249623 | 1395.06 | 714 | 698 | 178.4 |
| B | 7 | 0 | 214945 | 1374.0 | 727 | 702 | 155.9 |
| B | 4 | 170 | 92609 | 589.43 | 727 | 702 | 155.9 |
| B | 10 | 246 | 61581 | 390.43 | 727 | 702 | 155.9 |
| C | 15 | 235 | 3754574 | 22929.2 | 589 | 585 | 163.7 |
| C | 12 | 249 | 1246252 | 7608.48 | 589 | 585 | 163.7 |
| C | 15 | 196 | 504044 | 3075.11 | 589 | 585 | 163.7 |
| D | 6 | 42 | 1406304 | 7271.52 | 685 | 660 | 193.3 |
| D | 2 | 249 | 210665 | 1086.37 | 685 | 660 | 193.3 |
| D | 0 | 19 | 125872 | 647.73 | 685 | 660 | 193.3 |
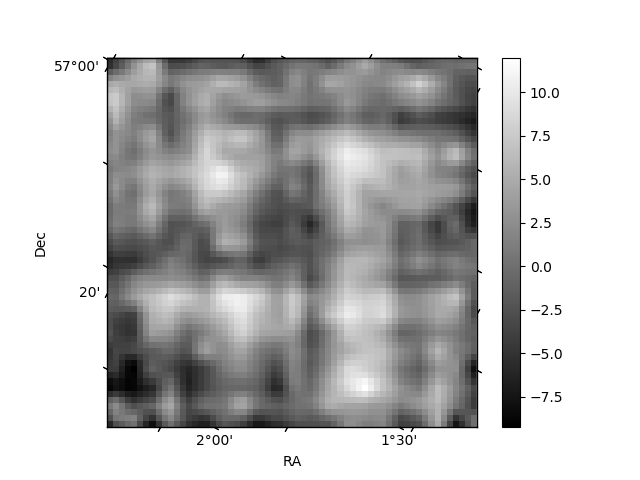
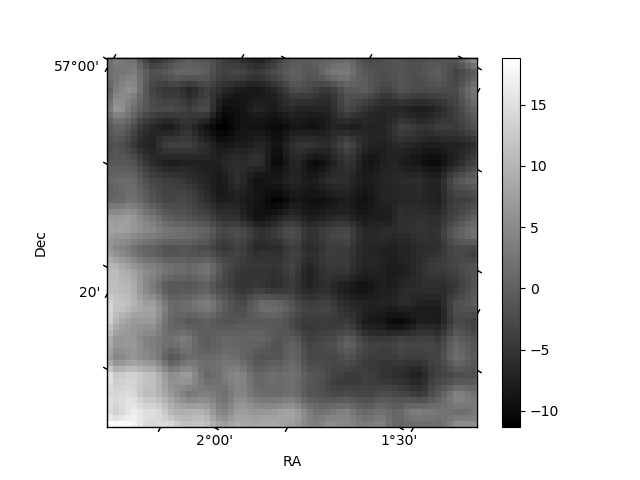
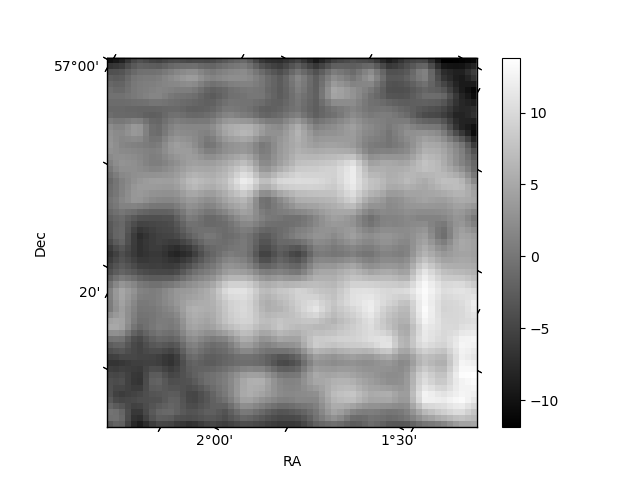
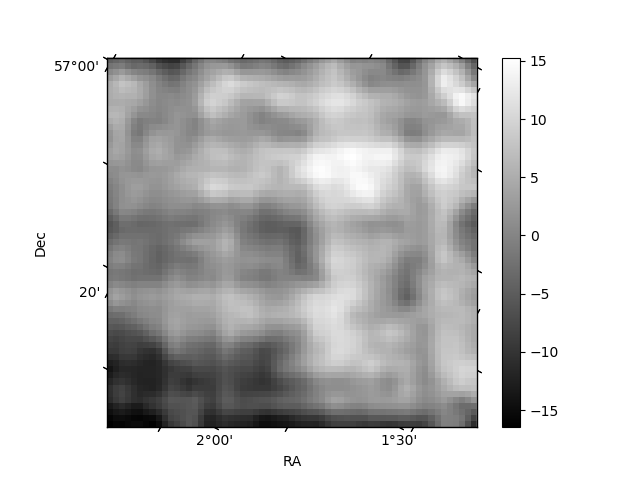
Histogram calculated using DETX and DETY for each event in the final _common_clean file
| Quadrant A | 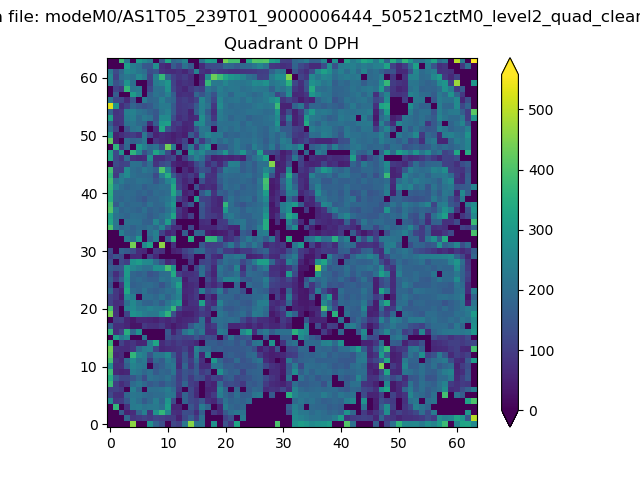 |
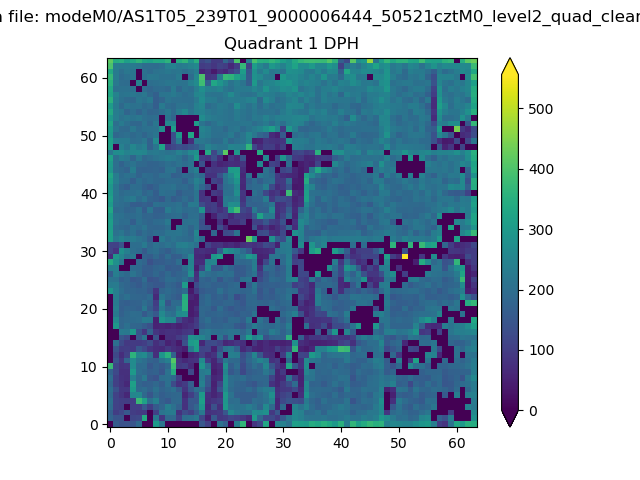 |
Quadrant B |
|---|---|---|---|
| Quadrant D | 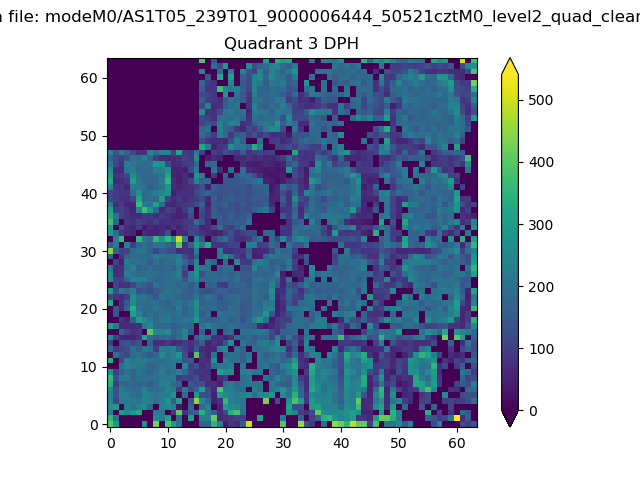 |
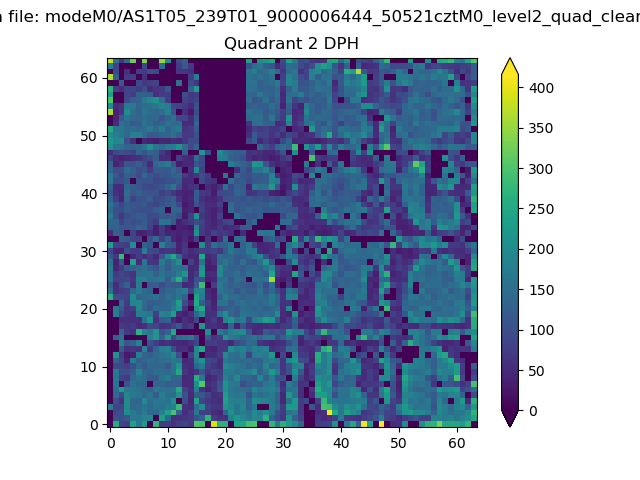 |
Quadrant C |
| Plot type | Count rate plots | Images |
|---|---|---|
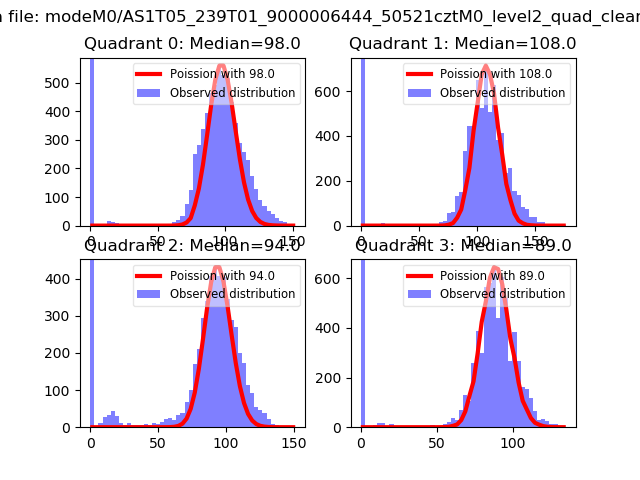
| Comparison with Poisson distribution Blue bars denote a histogram of data divided into 1 sec bins. Red curve is a Poisson curve with rate = median count rate of data. |
 |
 |
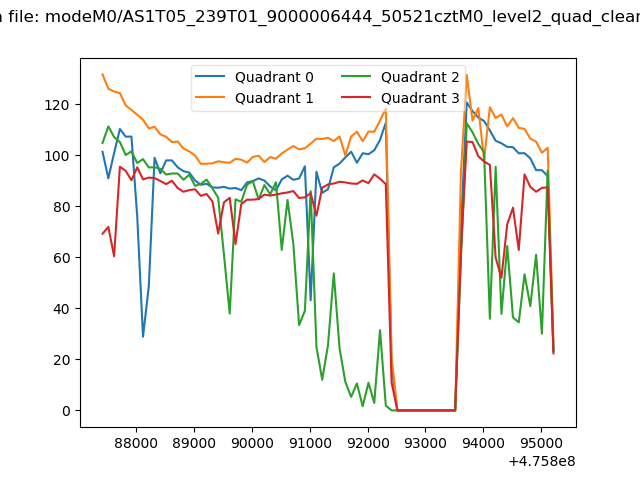
| Quadrant-wise count rates Data is divided into 100 sec bins |
 |
|
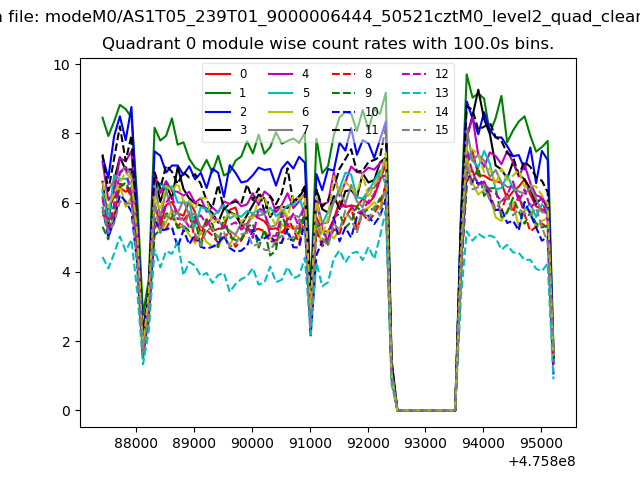
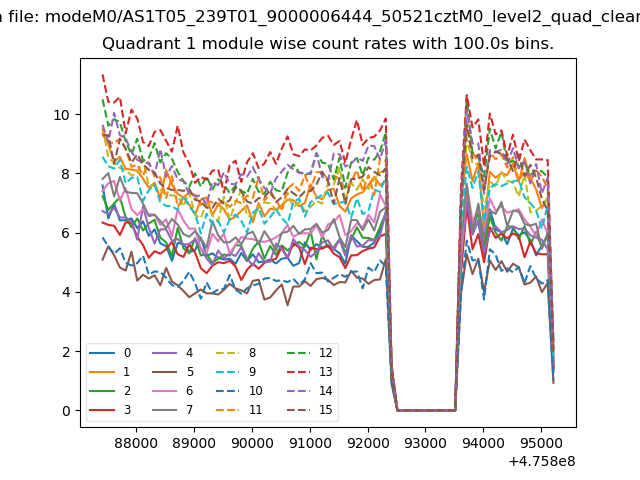
| Module-wise count rates for Quadrant A Data is divided into 100 sec bins |
 |
 |
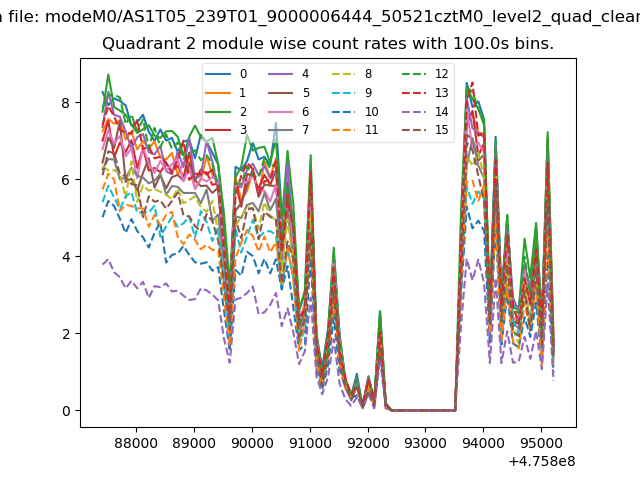
| Module-wise count rates for Quadrant B Data is divided into 100 sec bins |
 |
 |
| Module-wise count rates for Quadrant C Data is divided into 100 sec bins |
 |
 |
| Module-wise count rates for Quadrant D Data is divided into 100 sec bins |
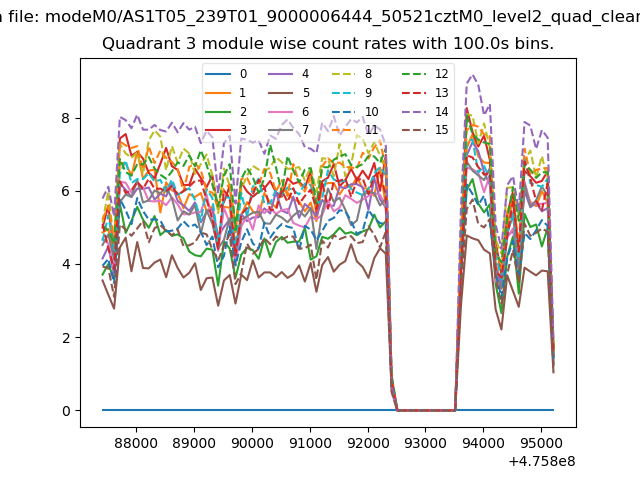 |
 |
| Parameter | Plot |
|---|---|
| CZT HV Monitor | 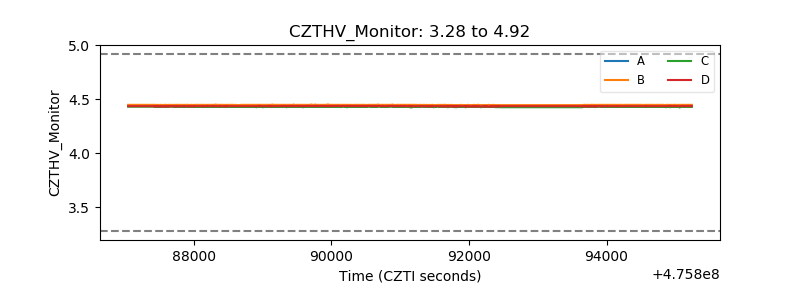 |
| D_VDD | 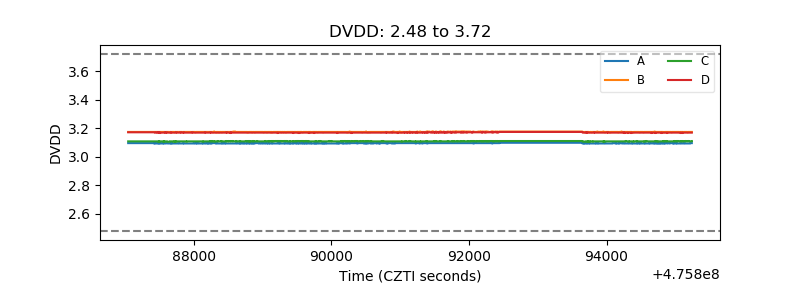 |
| Temperature 1 |  |
| Veto HV Monitor | 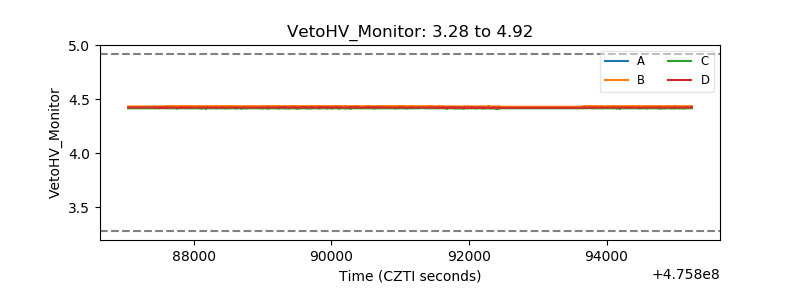 |
| Veto LLD | 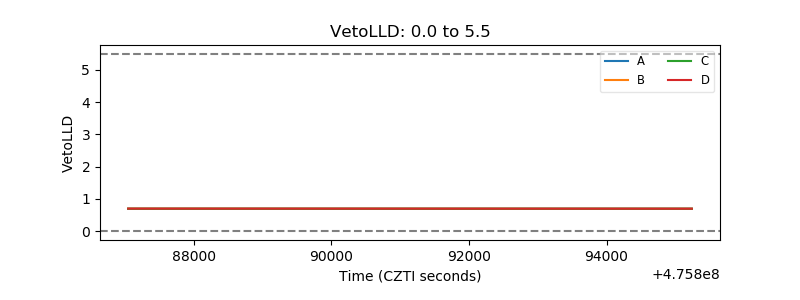 |
| Alpha Counter | 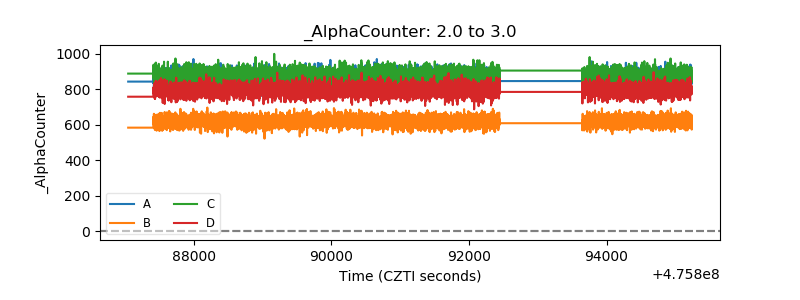 |
| _CPM_Rate | 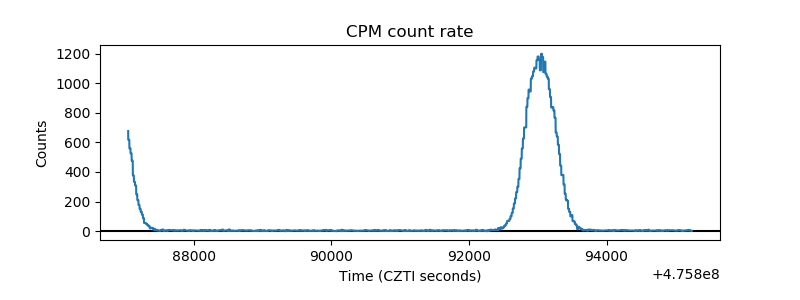 |
| CZT Counter | 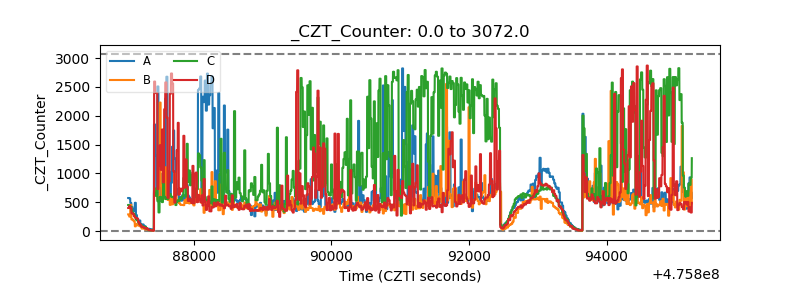 |
| +2.5 Volts monitor |  |
| +5 Volts monitor | 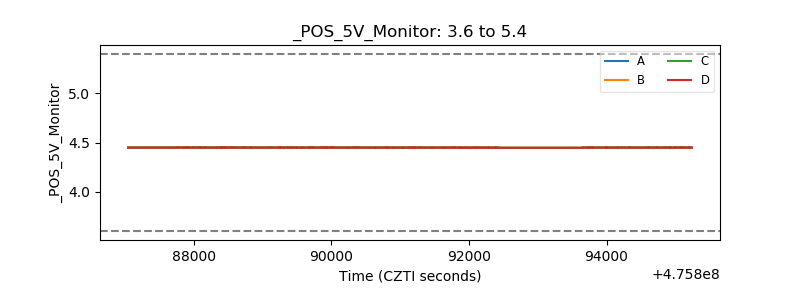 |
| _ROLL_ROT | 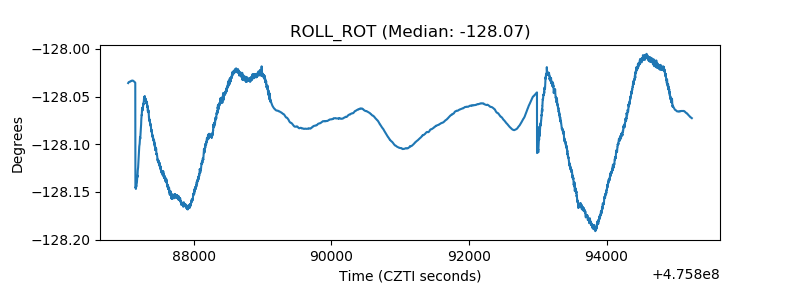 |
| _Roll_DEC | 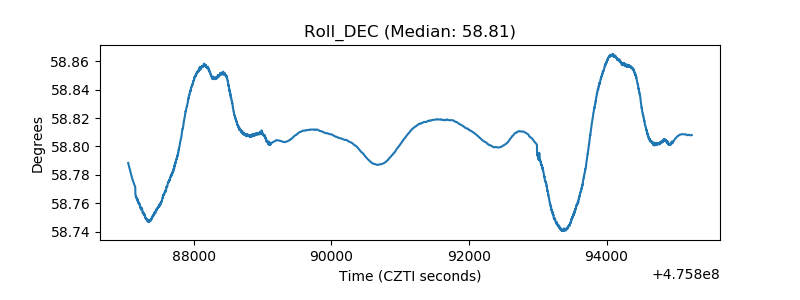 |
| _Roll_RA | 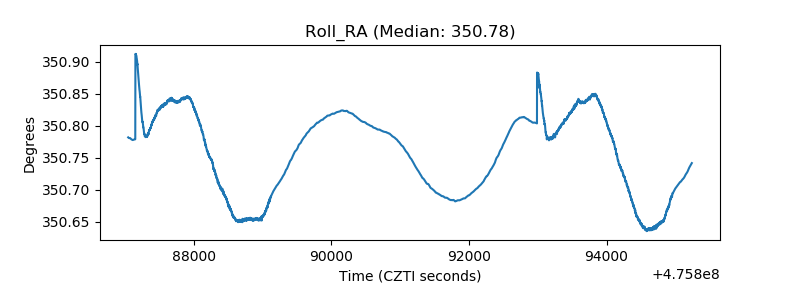 |
| Veto Counter | 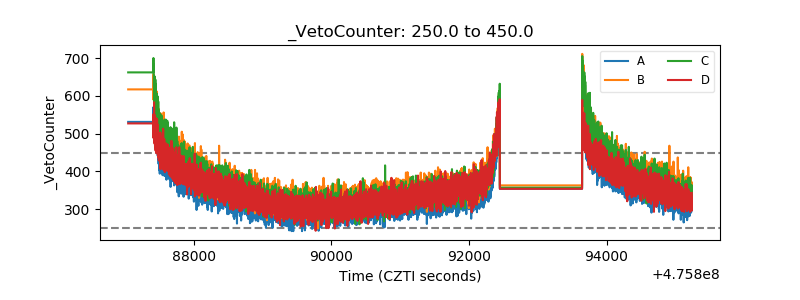 |