| Param | Original file | Final file |
|---|---|---|
| Filename | modeM0/AS1T05_239T01_9000006444_50522cztM0_level2.fits | modeM0/AS1T05_239T01_9000006444_50522cztM0_level2_quad_clean.evt |
| Size (bytes) | 643,020,480 | 93,055,680 |
| Size | 613.2 MB | 88.7 MB |
| Events in quadrant A | 4,422,642 | 648,149 |
| Events in quadrant B | 3,687,458 | 707,449 |
| Events in quadrant C | 8,819,912 | 492,359 |
| Events in quadrant D | 6,364,385 | 512,420 |
| Mode M0 | |||
|---|---|---|---|
| Quadrant | BADHDUFLAG | Total packets | Discarded packets |
| A | 0 | 17389 | 4 |
| B | 0 | 15479 | 2 |
| C | 0 | 30687 | 2 |
| D | 0 | 23554 | 2 |
| Mode M9 | |||
|---|---|---|---|
| Quadrant | BADHDUFLAG | Total packets | Discarded packets |
| A | 0 | 20 | 0 |
| B | 0 | 21 | 0 |
| C | 0 | 21 | 0 |
| D | 0 | 21 | 0 |
| Mode SS | |||
|---|---|---|---|
| Quadrant | BADHDUFLAG | Total packets | Discarded packets |
| A | 0 | 134 | 0 |
| B | 0 | 134 | 0 |
| C | 0 | 134 | 0 |
| D | 0 | 134 | 0 |
| Quadrant | Total seconds | Saturated seconds | Saturation percentage |
|---|---|---|---|
| A | 6556 | 136 | 2.074436% |
| B | 6556 | 208 | 3.172666% |
| C | 6556 | 1797 | 27.410006% |
| D | 6556 | 1038 | 15.832825% |
Noise dominated data is calculated using 1-second bins in cleaned event files. If a bin has >2000 counts, and if more than 50% of those come from <1% of pixels, then it is considered to be noise-dominated and hence unusable.
| Quadrant | # 1 sec bins | Bins with >0 counts | Bins with >2000 counts | High rate bins dominated by noise | Noise dominated (total time) | Noise dominated (detector-on time) | Marked lightcurve |
|---|---|---|---|---|---|---|---|
| A | 7771 | 6557 | 71 | 71 | 0.91% | 1.08% | 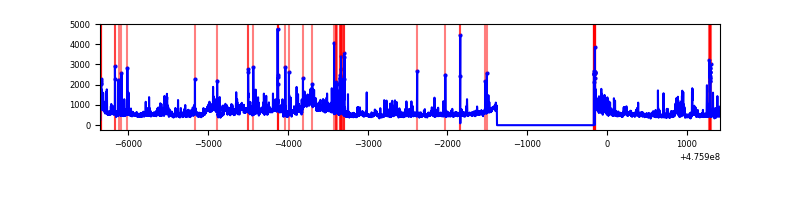 |
| B | 7771 | 6557 | 117 | 117 | 1.51% | 1.78% | 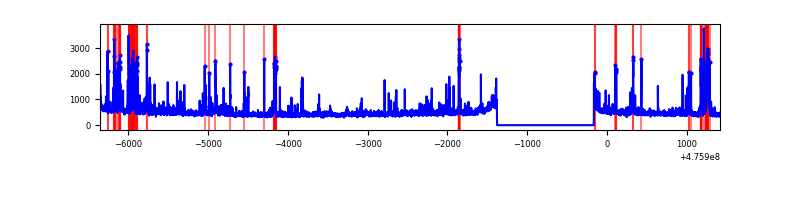 |
| C | 7771 | 6556 | 1578 | 1578 | 20.31% | 24.07% | 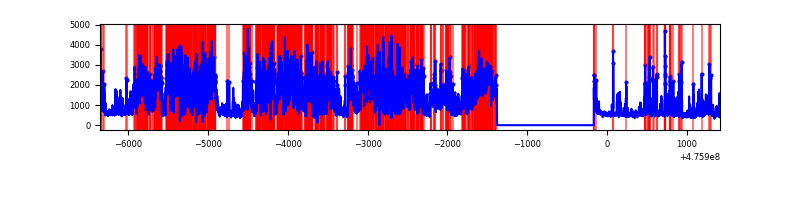 |
| D | 7771 | 6557 | 990 | 990 | 12.74% | 15.10% | 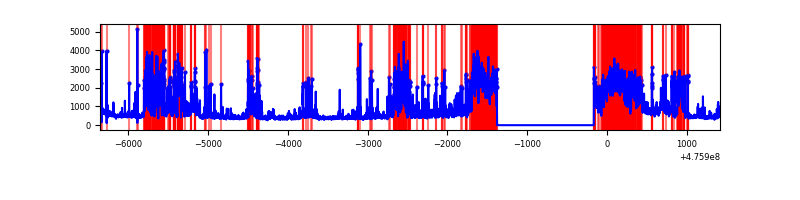 |
Top three noisy pixels from each quadrant. If the there are fewer than three noisy pixels in the level2.evt file, extra rows are filled as -1
| Pixel properties | Quadrant properties | ||||||
|---|---|---|---|---|---|---|---|
| Quadrant | DetID | PixID | Counts | Sigma | Mean | Median | Sigma |
| A | 3 | 45 | 441590 | 2453.43 | 722 | 705 | 179.7 |
| A | 4 | 3 | 222830 | 1236.08 | 722 | 705 | 179.7 |
| A | 4 | 249 | 129431 | 716.33 | 722 | 705 | 179.7 |
| B | 7 | 0 | 408366 | 2668.22 | 719 | 693 | 152.8 |
| B | 1 | 255 | 72474 | 469.81 | 719 | 693 | 152.8 |
| B | 8 | 128 | 54072 | 349.37 | 719 | 693 | 152.8 |
| C | 15 | 235 | 2626427 | 14647.88 | 633 | 626 | 179.3 |
| C | 12 | 249 | 1223971 | 6824.36 | 633 | 626 | 179.3 |
| C | 15 | 196 | 934819 | 5211.34 | 633 | 626 | 179.3 |
| D | 2 | 165 | 1633094 | 9083.06 | 647 | 622 | 179.7 |
| D | 6 | 42 | 1289038 | 7168.74 | 647 | 622 | 179.7 |
| D | 2 | 249 | 214203 | 1188.36 | 647 | 622 | 179.7 |
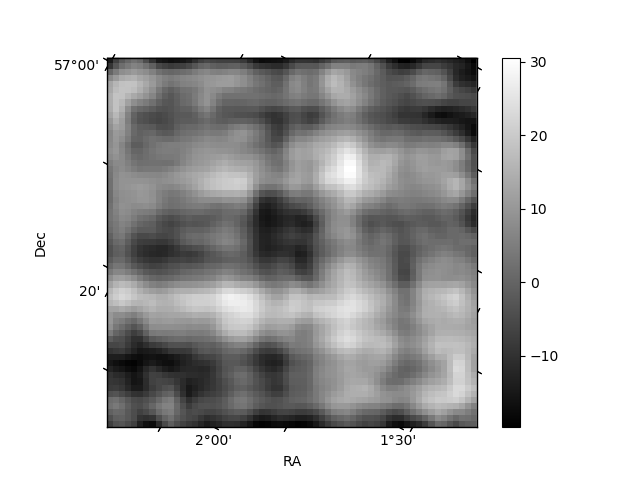
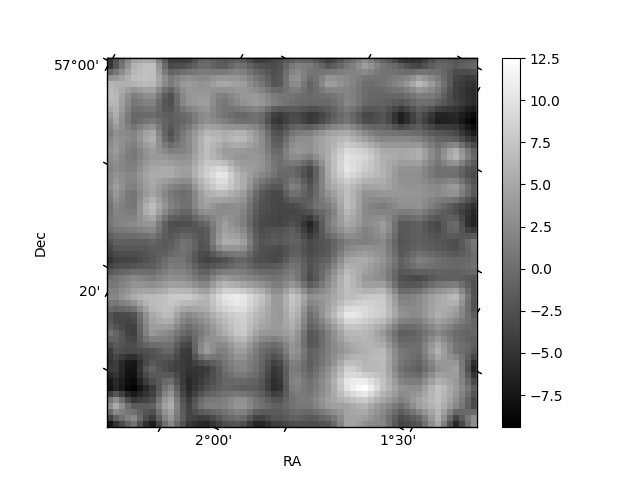
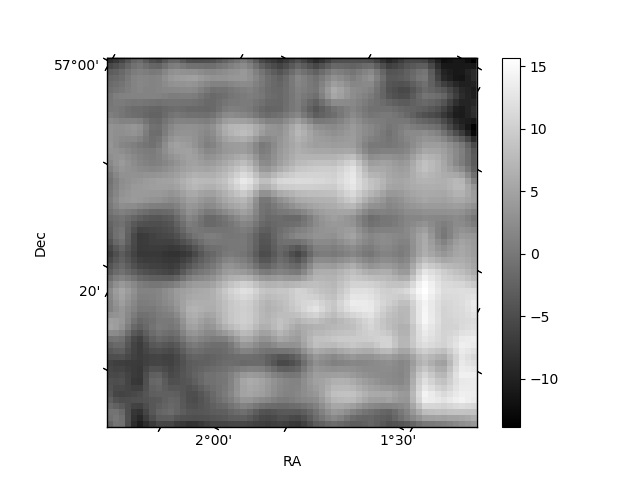
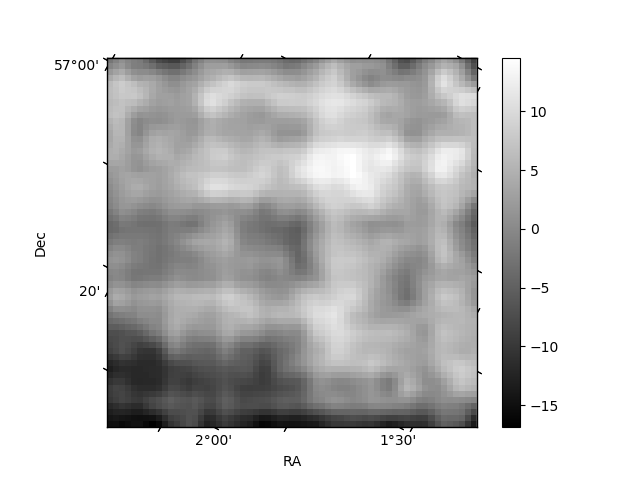
Histogram calculated using DETX and DETY for each event in the final _common_clean file
| Quadrant A | 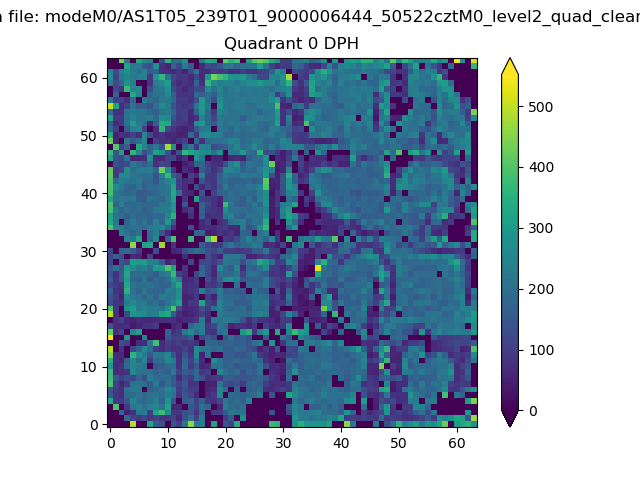 |
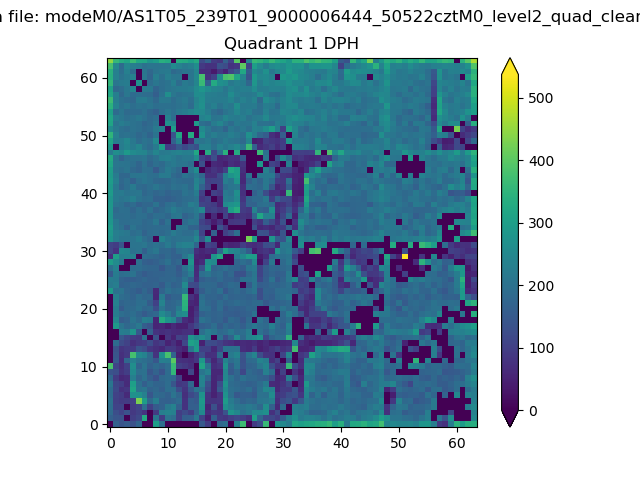 |
Quadrant B |
|---|---|---|---|
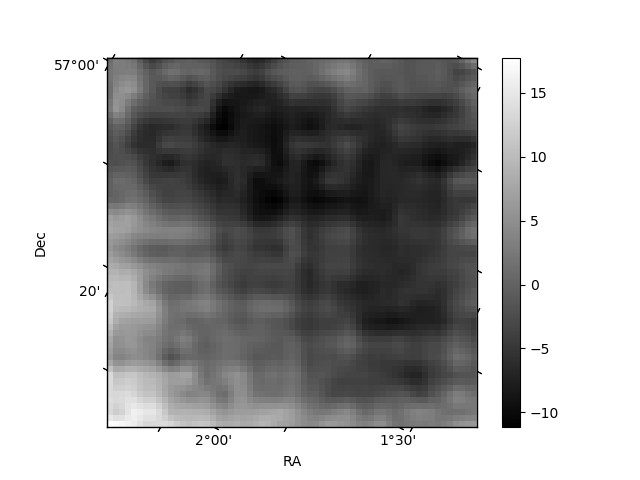
| Quadrant D | 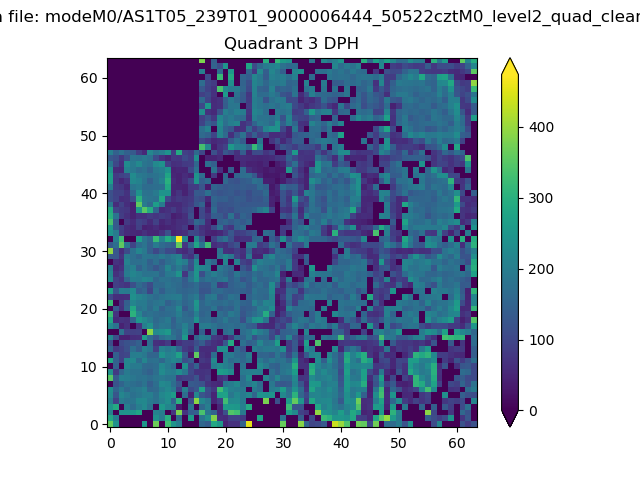 |
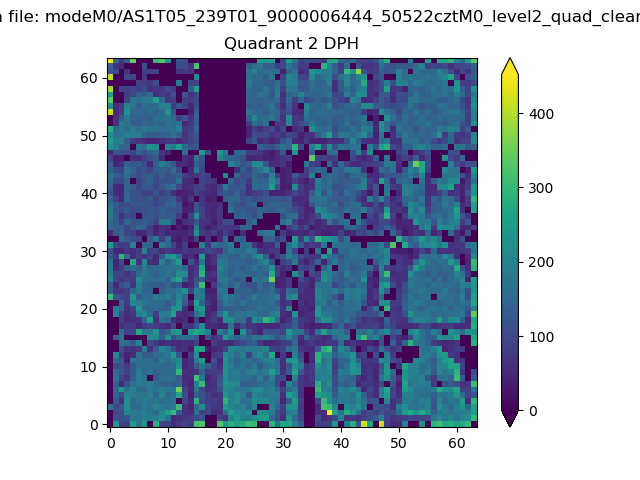 |
Quadrant C |
| Plot type | Count rate plots | Images |
|---|---|---|
| Comparison with Poisson distribution Blue bars denote a histogram of data divided into 1 sec bins. Red curve is a Poisson curve with rate = median count rate of data. |
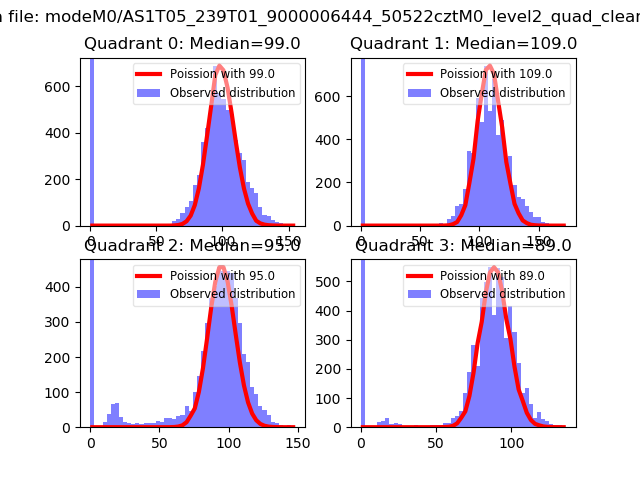 |
 |
| Quadrant-wise count rates Data is divided into 100 sec bins |
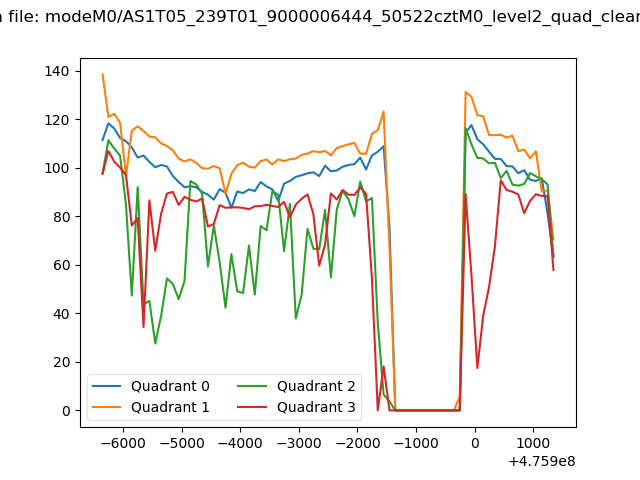 |
|
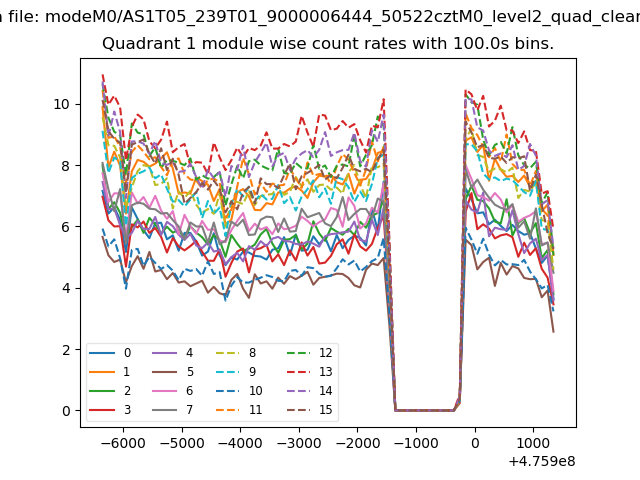
| Module-wise count rates for Quadrant A Data is divided into 100 sec bins |
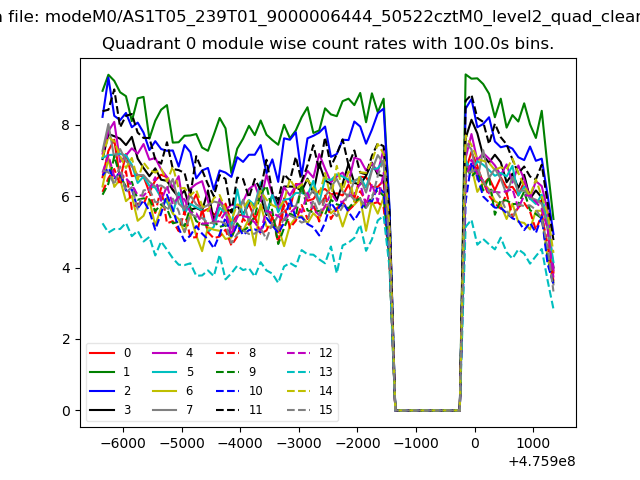 |
 |
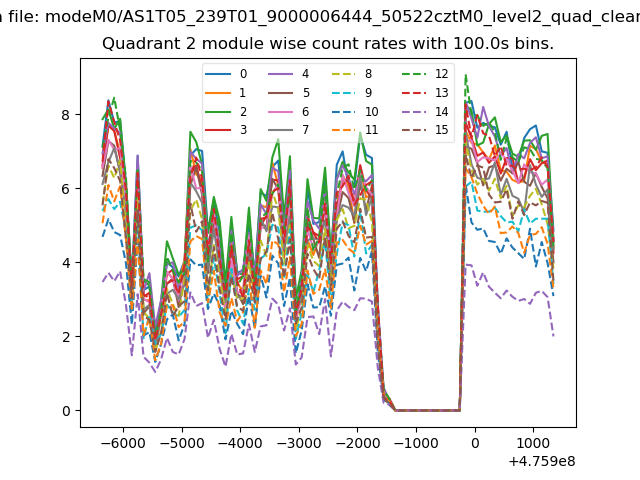
| Module-wise count rates for Quadrant B Data is divided into 100 sec bins |
 |
 |
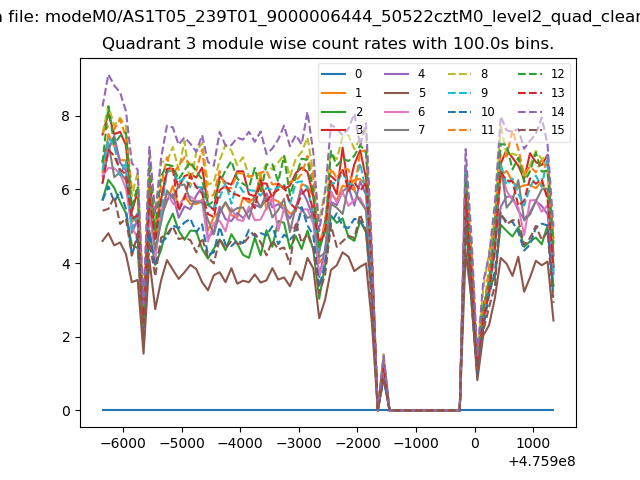
| Module-wise count rates for Quadrant C Data is divided into 100 sec bins |
 |
 |
| Module-wise count rates for Quadrant D Data is divided into 100 sec bins |
 |
 |
| Parameter | Plot |
|---|---|
| CZT HV Monitor | 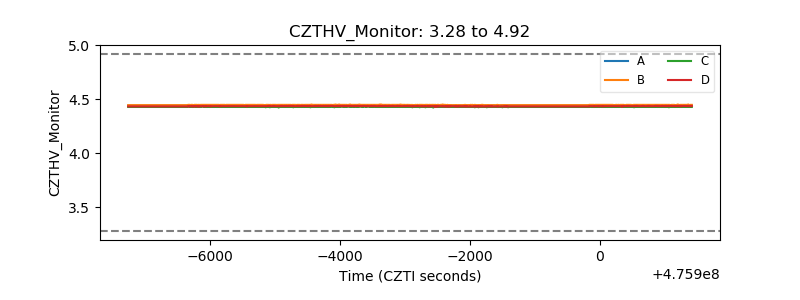 |
| D_VDD | 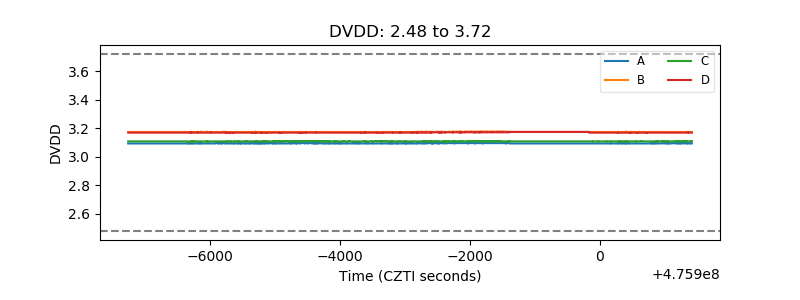 |
| Temperature 1 | 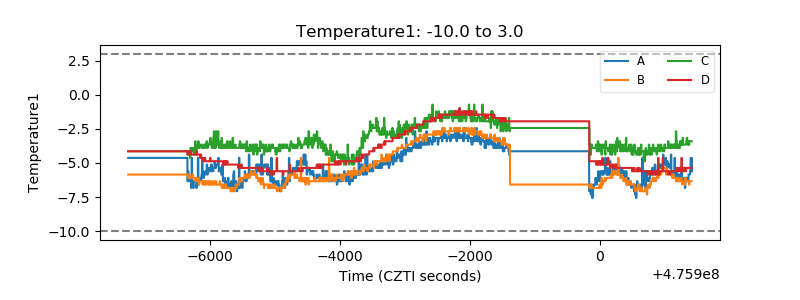 |
| Veto HV Monitor | 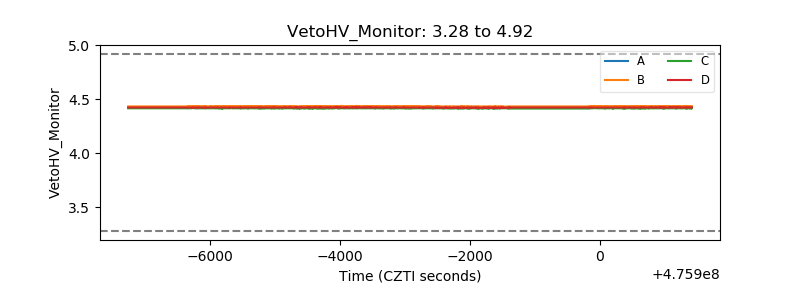 |
| Veto LLD | 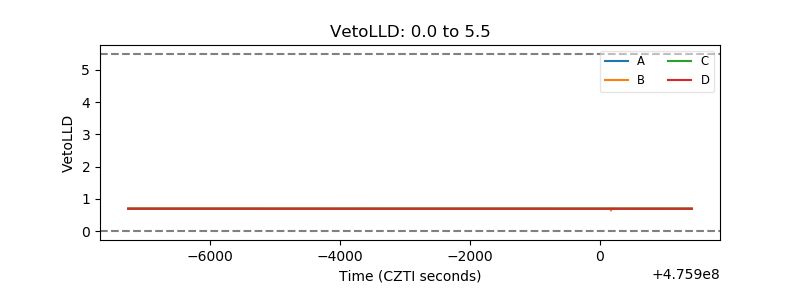 |
| Alpha Counter | 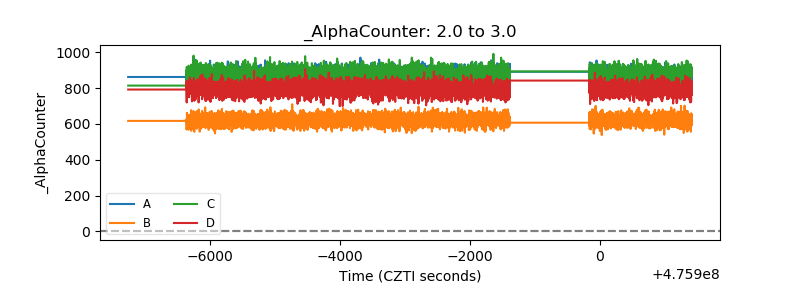 |
| _CPM_Rate | 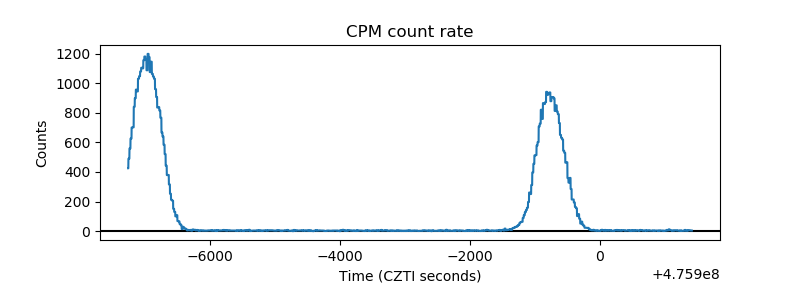 |
| CZT Counter | 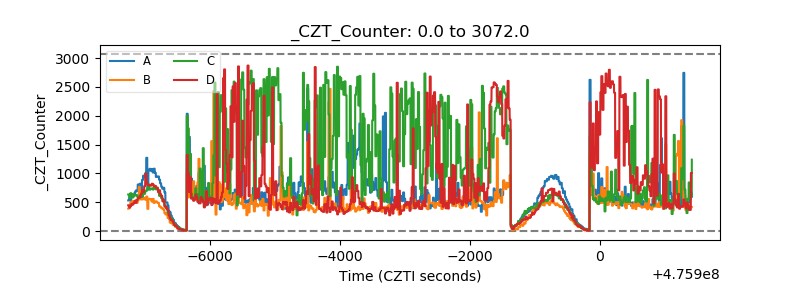 |
| +2.5 Volts monitor | 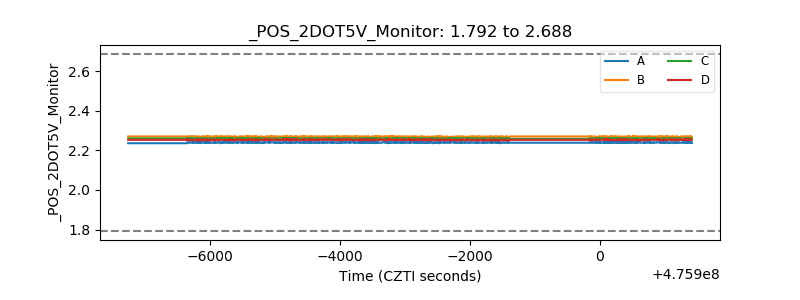 |
| +5 Volts monitor | 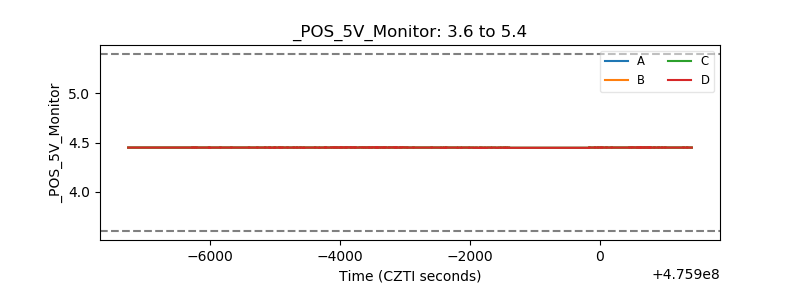 |
| _ROLL_ROT | 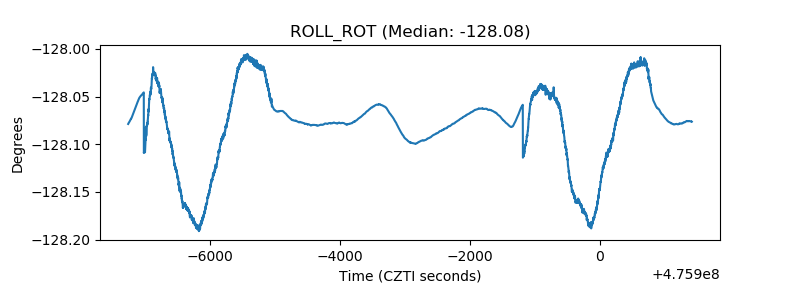 |
| _Roll_DEC | 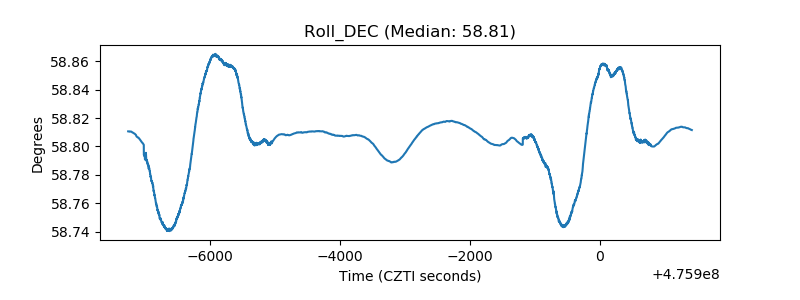 |
| _Roll_RA | 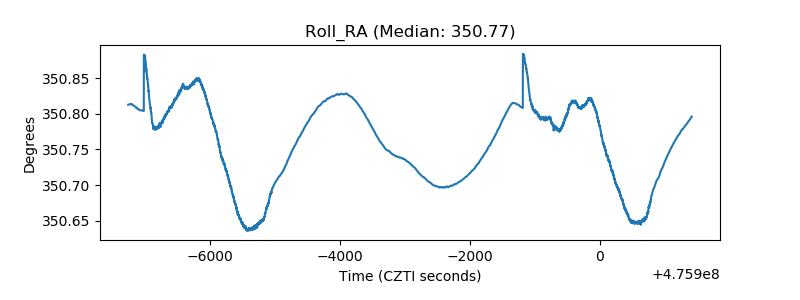 |
| Veto Counter | 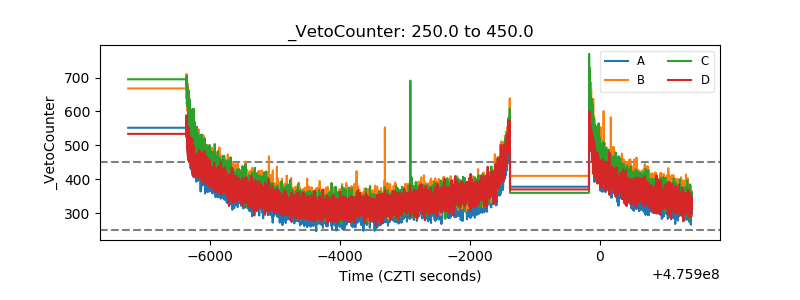 |