| Param | Original file | Final file |
|---|---|---|
| Filename | modeM0/AS1T05_239T01_9000006444_50523cztM0_level2.fits | modeM0/AS1T05_239T01_9000006444_50523cztM0_level2_quad_clean.evt |
| Size (bytes) | 553,011,840 | 94,487,040 |
| Size | 527.4 MB | 90.1 MB |
| Events in quadrant A | 4,398,626 | 612,767 |
| Events in quadrant B | 4,343,139 | 665,526 |
| Events in quadrant C | 5,928,362 | 583,725 |
| Events in quadrant D | 5,293,569 | 543,061 |
| Mode M0 | |||
|---|---|---|---|
| Quadrant | BADHDUFLAG | Total packets | Discarded packets |
| A | 0 | 17427 | 6 |
| B | 0 | 17513 | 2 |
| C | 0 | 22025 | 2 |
| D | 0 | 20149 | 2 |
| Mode M9 | |||
|---|---|---|---|
| Quadrant | BADHDUFLAG | Total packets | Discarded packets |
| A | 0 | 11 | 0 |
| B | 0 | 11 | 0 |
| C | 0 | 11 | 0 |
| D | 0 | 11 | 0 |
| Mode SS | |||
|---|---|---|---|
| Quadrant | BADHDUFLAG | Total packets | Discarded packets |
| A | 0 | 134 | 0 |
| B | 0 | 134 | 0 |
| C | 0 | 134 | 0 |
| D | 0 | 134 | 0 |
| Quadrant | Total seconds | Saturated seconds | Saturation percentage |
|---|---|---|---|
| A | 6533 | 371 | 5.678861% |
| B | 6533 | 522 | 7.990204% |
| C | 6534 | 636 | 9.733701% |
| D | 6534 | 573 | 8.769513% |
Noise dominated data is calculated using 1-second bins in cleaned event files. If a bin has >2000 counts, and if more than 50% of those come from <1% of pixels, then it is considered to be noise-dominated and hence unusable.
| Quadrant | # 1 sec bins | Bins with >0 counts | Bins with >2000 counts | High rate bins dominated by noise | Noise dominated (total time) | Noise dominated (detector-on time) | Marked lightcurve |
|---|---|---|---|---|---|---|---|
| A | 7688 | 6534 | 251 | 251 | 3.26% | 3.84% | 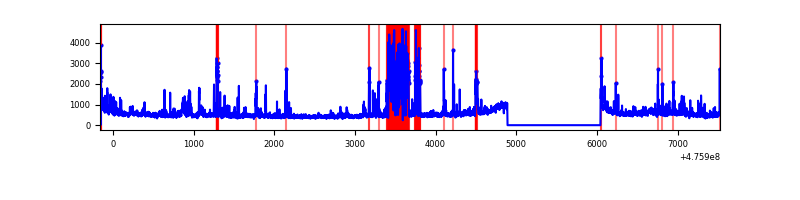 |
| B | 7688 | 6534 | 278 | 278 | 3.62% | 4.25% | 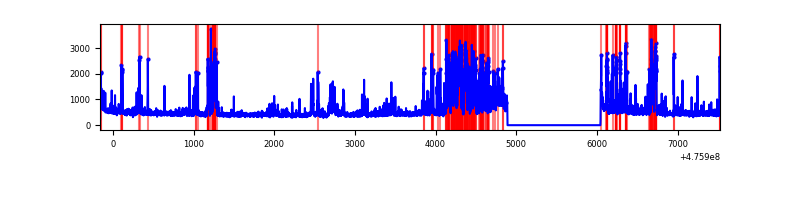 |
| C | 7689 | 6535 | 567 | 567 | 7.37% | 8.68% | 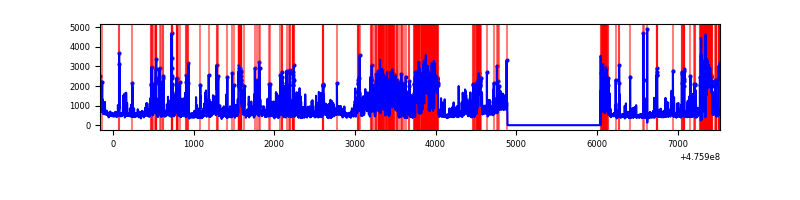 |
| D | 7689 | 6535 | 506 | 506 | 6.58% | 7.74% | 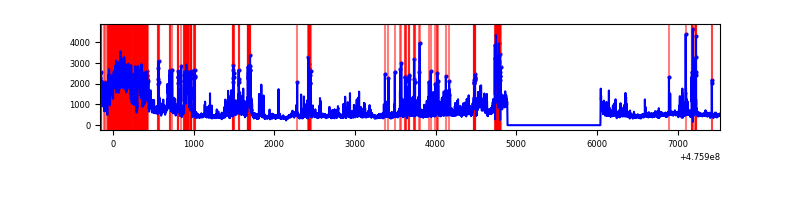 |
Top three noisy pixels from each quadrant. If the there are fewer than three noisy pixels in the level2.evt file, extra rows are filled as -1
| Pixel properties | Quadrant properties | ||||||
|---|---|---|---|---|---|---|---|
| Quadrant | DetID | PixID | Counts | Sigma | Mean | Median | Sigma |
| A | 4 | 249 | 753655 | 4286.63 | 706 | 684 | 175.7 |
| A | 4 | 3 | 181041 | 1026.76 | 706 | 684 | 175.7 |
| A | 6 | 161 | 97403 | 550.61 | 706 | 684 | 175.7 |
| B | 7 | 0 | 1121635 | 7513.16 | 703 | 679 | 149.2 |
| B | 6 | 51 | 59516 | 394.35 | 703 | 679 | 149.2 |
| B | 8 | 128 | 59375 | 393.41 | 703 | 679 | 149.2 |
| C | 4 | 5 | 727650 | 3913.91 | 678 | 674 | 185.7 |
| C | 15 | 196 | 713744 | 3839.04 | 678 | 674 | 185.7 |
| C | 12 | 249 | 342420 | 1839.9 | 678 | 674 | 185.7 |
| D | 2 | 165 | 1102030 | 5969.43 | 670 | 646 | 184.5 |
| D | 6 | 42 | 367908 | 1990.53 | 670 | 646 | 184.5 |
| D | 1 | 7 | 221384 | 1196.38 | 670 | 646 | 184.5 |
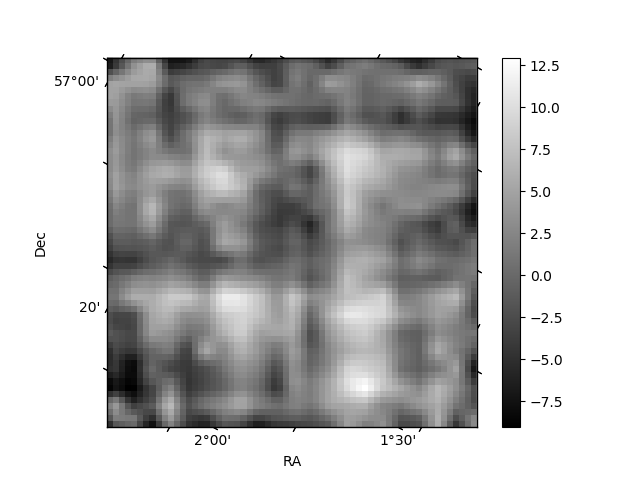
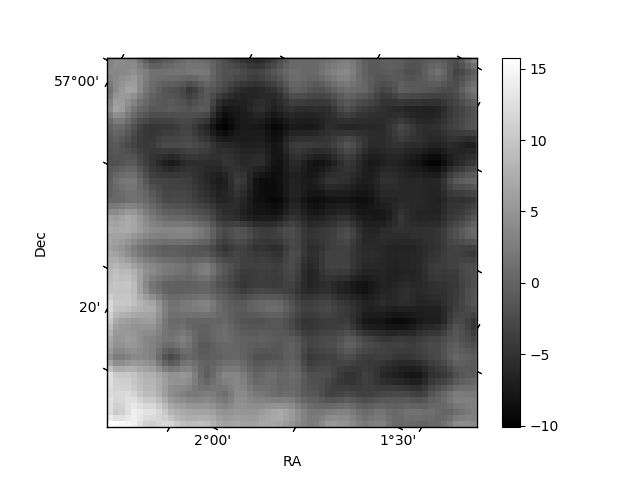
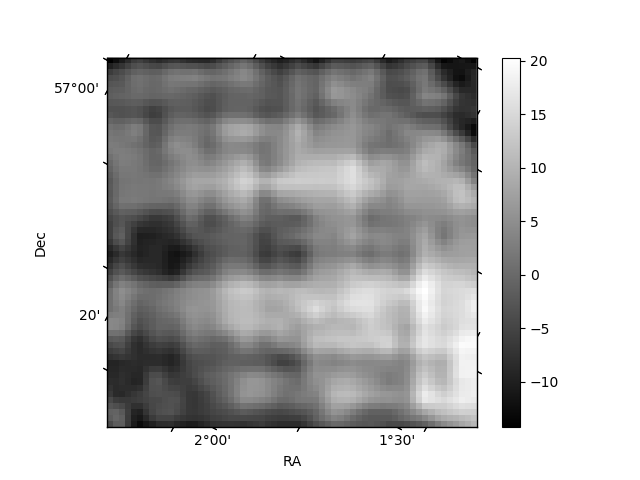
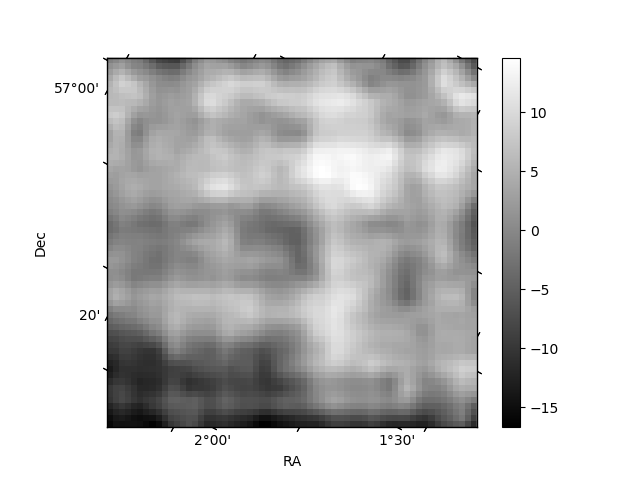
Histogram calculated using DETX and DETY for each event in the final _common_clean file
| Quadrant A | 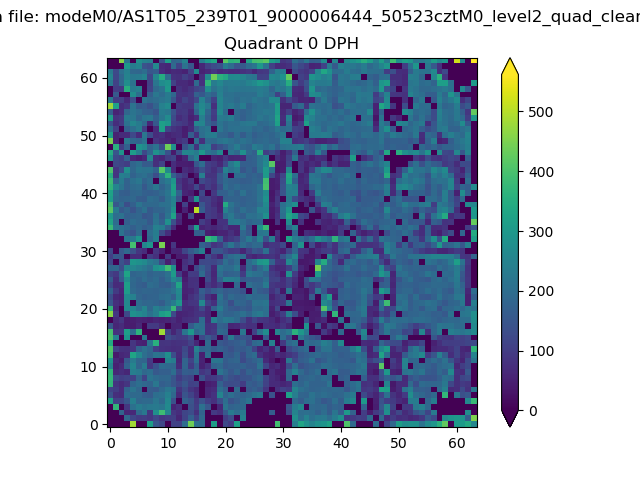 |
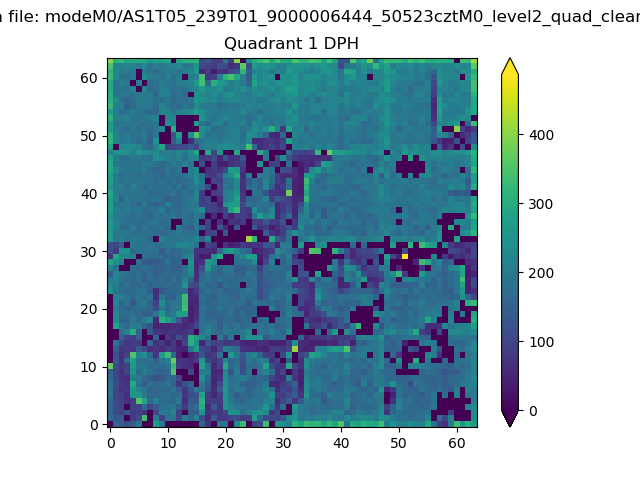 |
Quadrant B |
|---|---|---|---|
| Quadrant D | 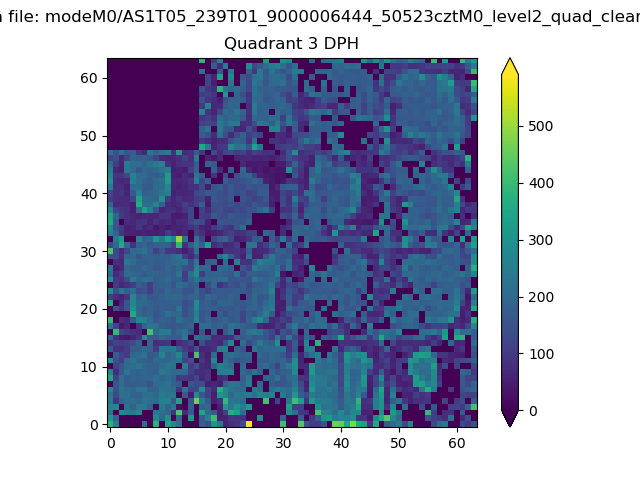 |
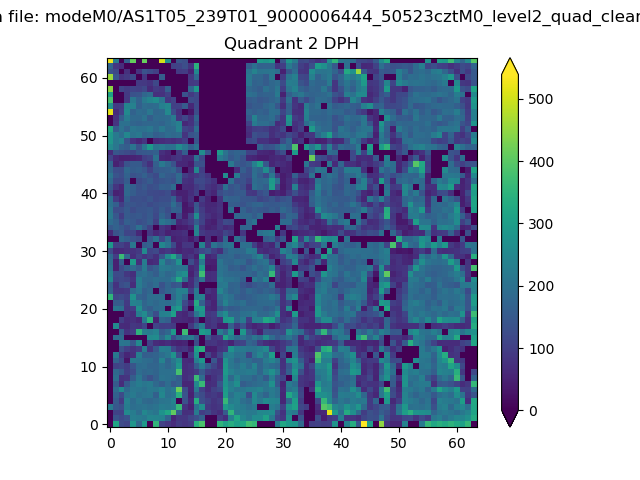 |
Quadrant C |
| Plot type | Count rate plots | Images |
|---|---|---|
| Comparison with Poisson distribution Blue bars denote a histogram of data divided into 1 sec bins. Red curve is a Poisson curve with rate = median count rate of data. |
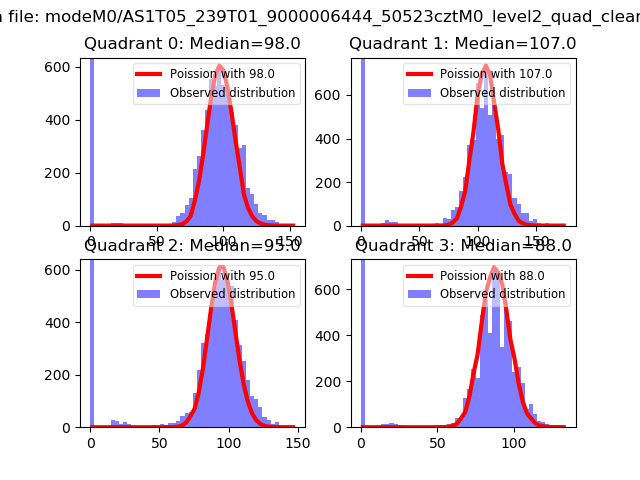 |
 |
| Quadrant-wise count rates Data is divided into 100 sec bins |
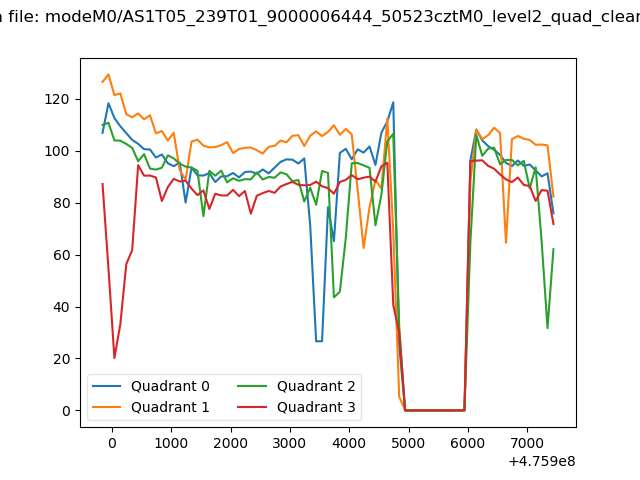 |
|
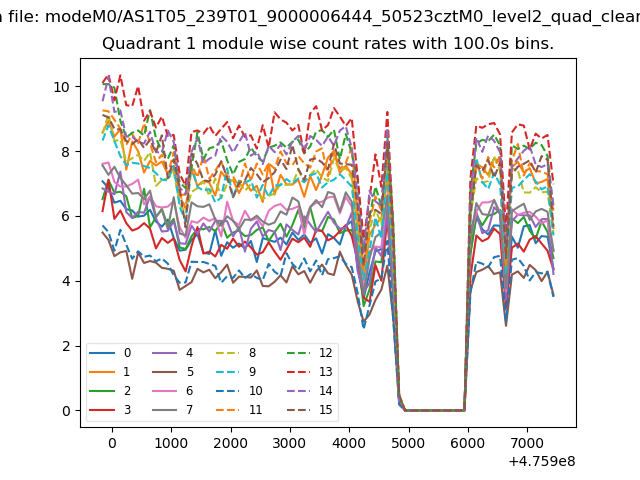
| Module-wise count rates for Quadrant A Data is divided into 100 sec bins |
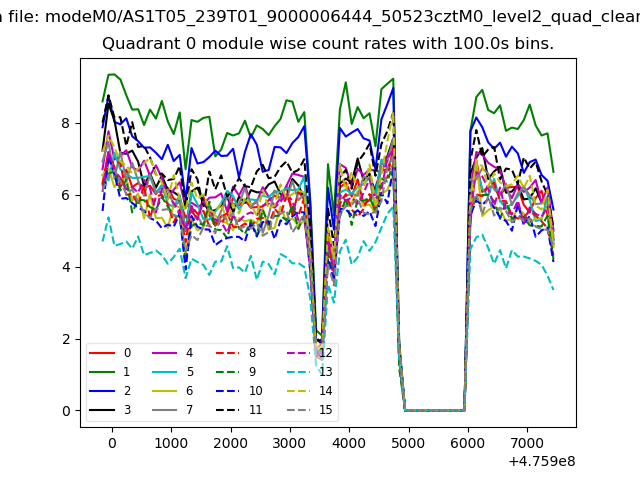 |
 |
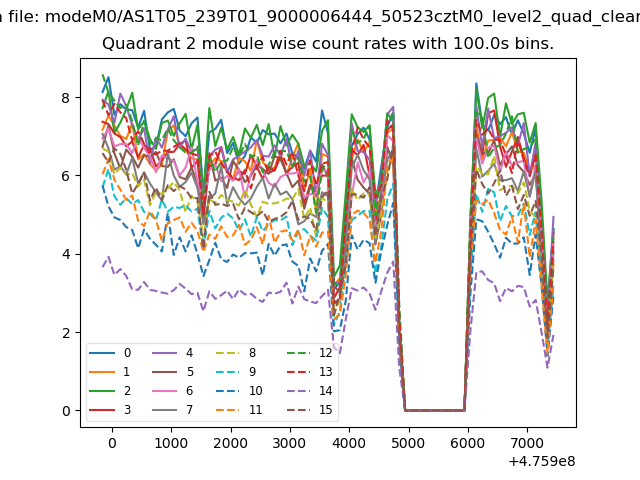
| Module-wise count rates for Quadrant B Data is divided into 100 sec bins |
 |
 |
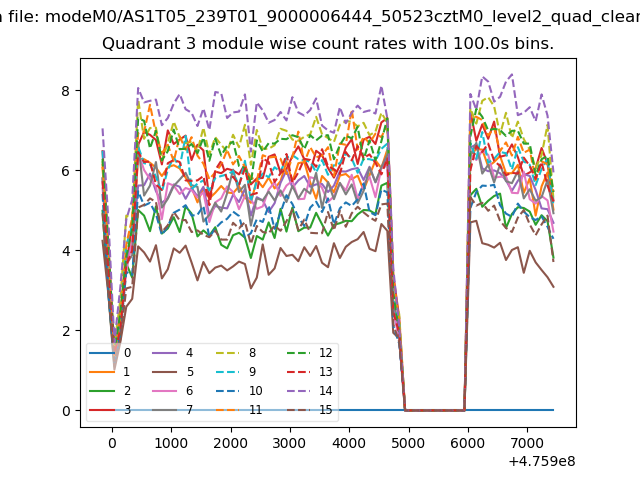
| Module-wise count rates for Quadrant C Data is divided into 100 sec bins |
 |
 |
| Module-wise count rates for Quadrant D Data is divided into 100 sec bins |
 |
 |
| Parameter | Plot |
|---|---|
| CZT HV Monitor | 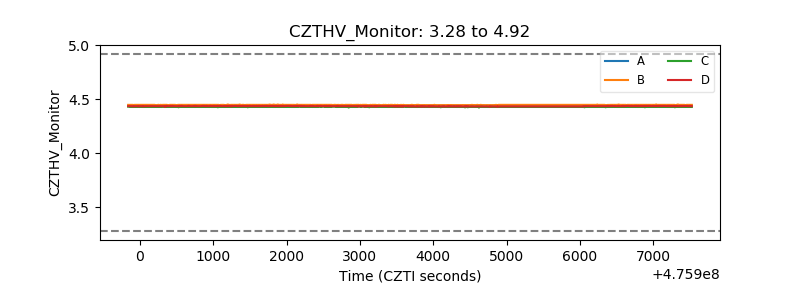 |
| D_VDD | 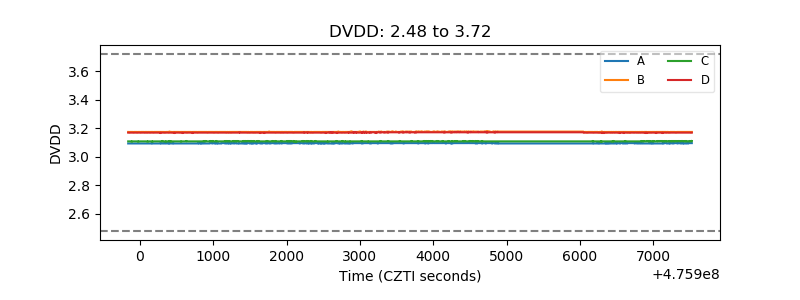 |
| Temperature 1 | 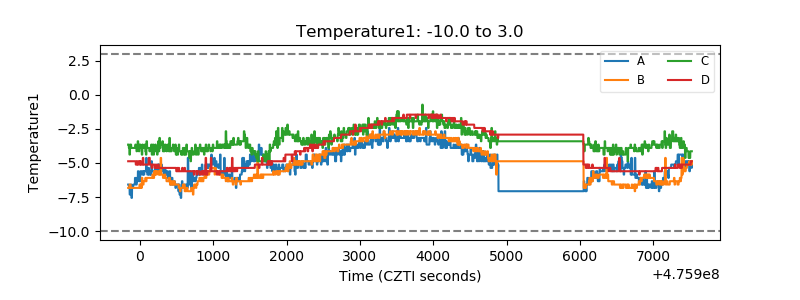 |
| Veto HV Monitor | 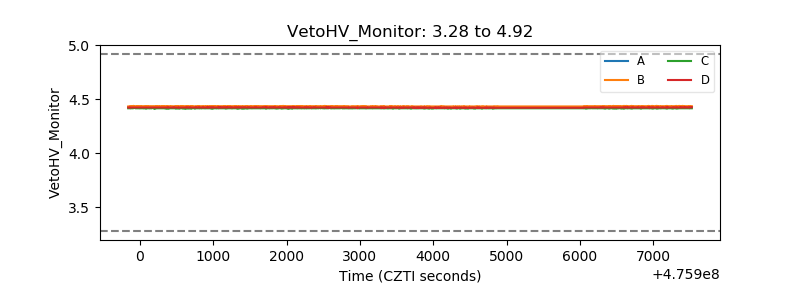 |
| Veto LLD | 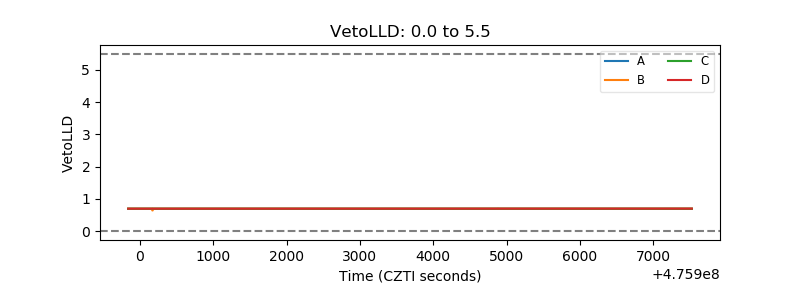 |
| Alpha Counter | 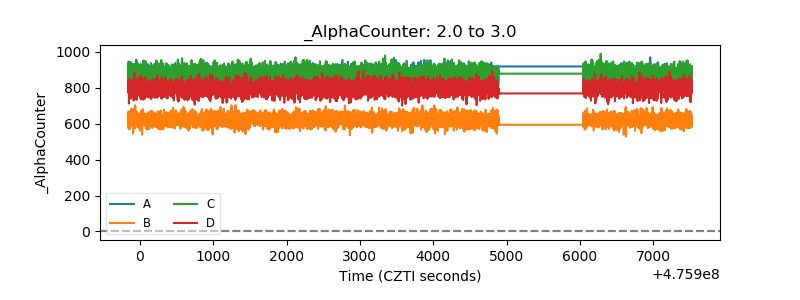 |
| _CPM_Rate | 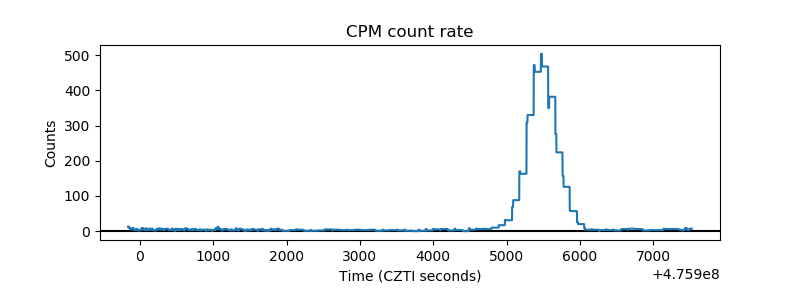 |
| CZT Counter | 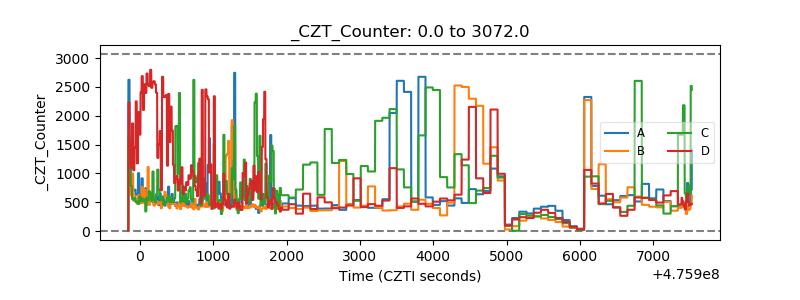 |
| +2.5 Volts monitor | 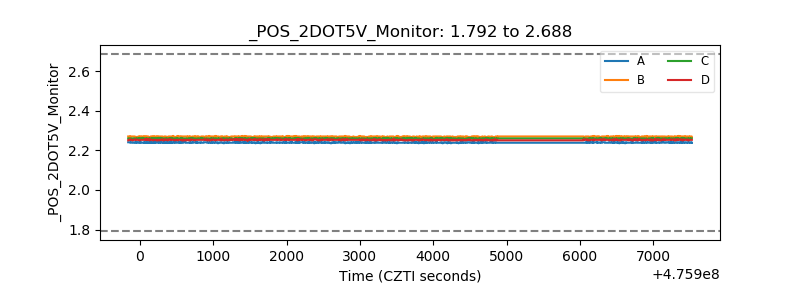 |
| +5 Volts monitor | 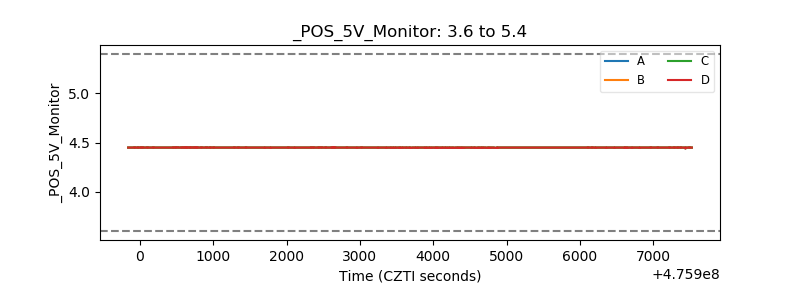 |
| _ROLL_ROT | 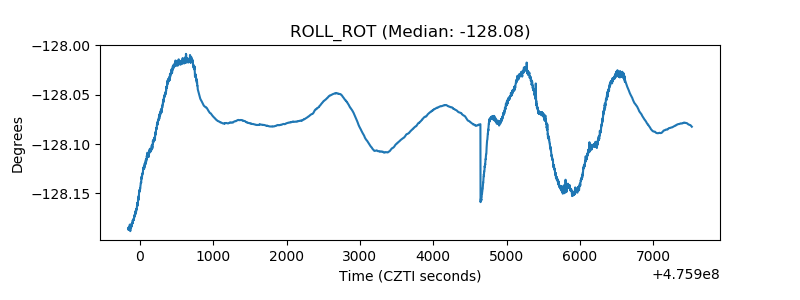 |
| _Roll_DEC | 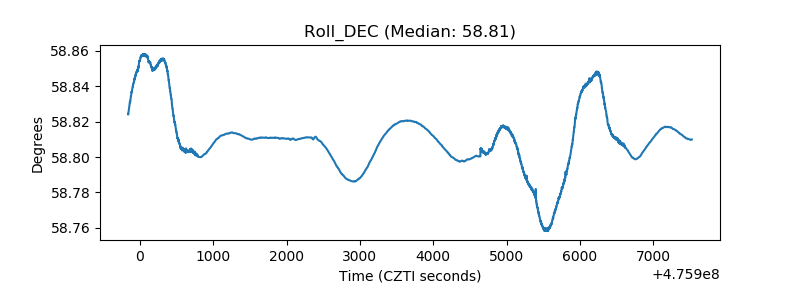 |
| _Roll_RA | 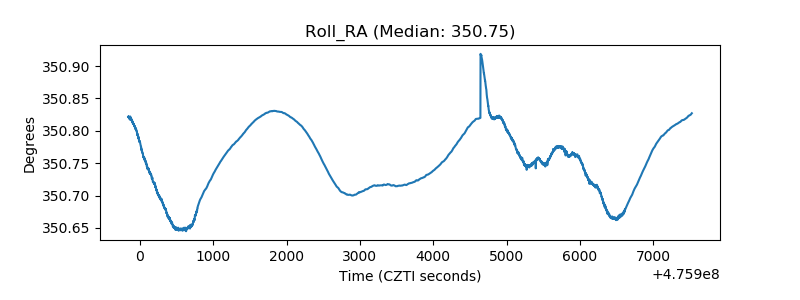 |
| Veto Counter | 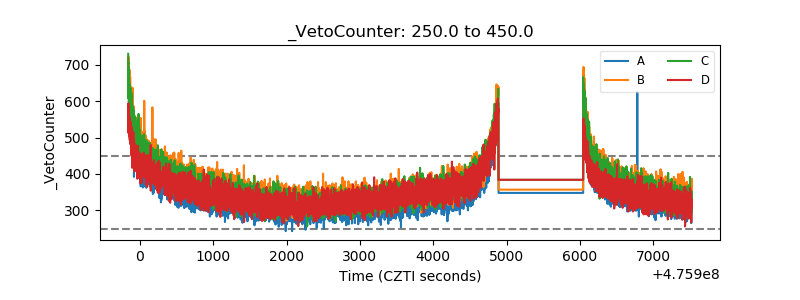 |