| Param | Original file | Final file |
|---|---|---|
| Filename | modeM0/AS1T05_239T01_9000006444_50525cztM0_level2.fits | modeM0/AS1T05_239T01_9000006444_50525cztM0_level2_quad_clean.evt |
| Size (bytes) | 704,171,520 | 87,638,400 |
| Size | 671.6 MB | 83.6 MB |
| Events in quadrant A | 6,253,024 | 565,565 |
| Events in quadrant B | 7,138,704 | 528,283 |
| Events in quadrant C | 5,708,446 | 588,778 |
| Events in quadrant D | 6,438,633 | 496,590 |
| Mode M0 | |||
|---|---|---|---|
| Quadrant | BADHDUFLAG | Total packets | Discarded packets |
| A | 0 | 23224 | 1 |
| B | 0 | 26049 | 1 |
| C | 0 | 21710 | 1 |
| D | 0 | 24033 | 7 |
| Mode M9 | |||
|---|---|---|---|
| Quadrant | BADHDUFLAG | Total packets | Discarded packets |
| A | 0 | 6 | 0 |
| B | 0 | 6 | 0 |
| C | 0 | 6 | 0 |
| D | 0 | 6 | 0 |
| Mode SS | |||
|---|---|---|---|
| Quadrant | BADHDUFLAG | Total packets | Discarded packets |
| A | 0 | 138 | 0 |
| B | 0 | 138 | 0 |
| C | 0 | 138 | 0 |
| D | 0 | 138 | 0 |
| Quadrant | Total seconds | Saturated seconds | Saturation percentage |
|---|---|---|---|
| A | 6803 | 883 | 12.979568% |
| B | 6804 | 1757 | 25.823045% |
| C | 6804 | 400 | 5.878895% |
| D | 6803 | 1048 | 15.404968% |
Noise dominated data is calculated using 1-second bins in cleaned event files. If a bin has >2000 counts, and if more than 50% of those come from <1% of pixels, then it is considered to be noise-dominated and hence unusable.
| Quadrant | # 1 sec bins | Bins with >0 counts | Bins with >2000 counts | High rate bins dominated by noise | Noise dominated (total time) | Noise dominated (detector-on time) | Marked lightcurve |
|---|---|---|---|---|---|---|---|
| A | 7353 | 6804 | 616 | 616 | 8.38% | 9.05% | 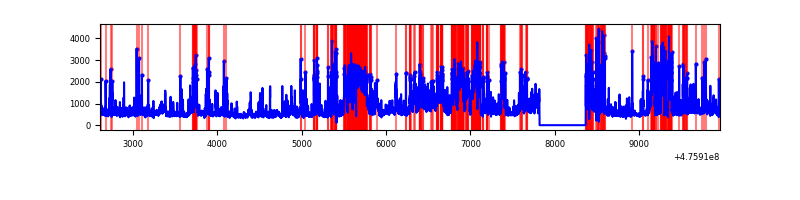 |
| B | 7354 | 6804 | 1435 | 1435 | 19.51% | 21.09% | 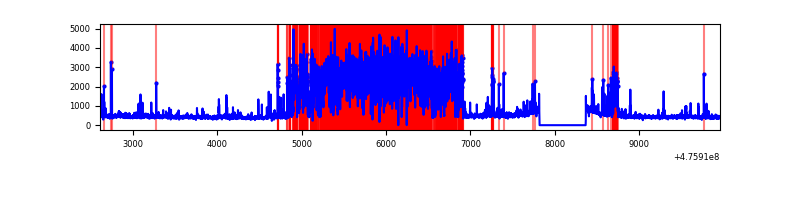 |
| C | 7354 | 6805 | 280 | 280 | 3.81% | 4.11% | 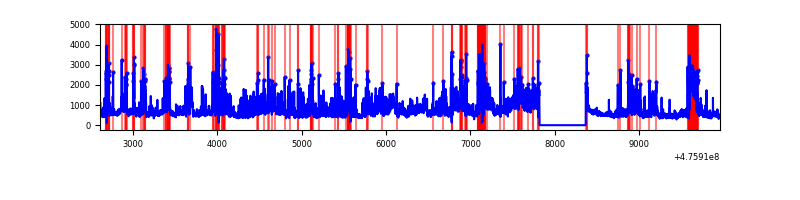 |
| D | 7353 | 6804 | 910 | 910 | 12.38% | 13.37% | 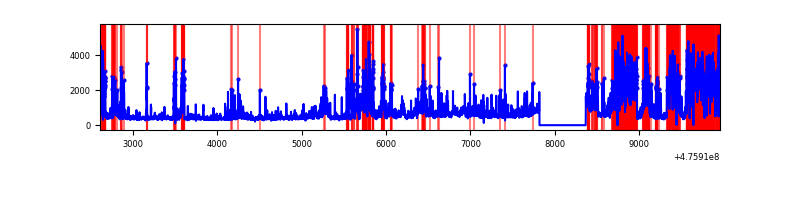 |
Top three noisy pixels from each quadrant. If the there are fewer than three noisy pixels in the level2.evt file, extra rows are filled as -1
| Pixel properties | Quadrant properties | ||||||
|---|---|---|---|---|---|---|---|
| Quadrant | DetID | PixID | Counts | Sigma | Mean | Median | Sigma |
| A | 12 | 250 | 1501171 | 8811.8 | 692 | 675 | 170.3 |
| A | 4 | 249 | 633203 | 3714.58 | 692 | 675 | 170.3 |
| A | 12 | 15 | 484863 | 2843.44 | 692 | 675 | 170.3 |
| B | 7 | 0 | 4176388 | 31013.52 | 624 | 603 | 134.6 |
| B | 4 | 170 | 131442 | 971.74 | 624 | 603 | 134.6 |
| B | 0 | 155 | 43959 | 322.0 | 624 | 603 | 134.6 |
| C | 15 | 196 | 706797 | 3759.78 | 685 | 679 | 187.8 |
| C | 12 | 247 | 429496 | 2283.27 | 685 | 679 | 187.8 |
| C | 15 | 232 | 285565 | 1516.9 | 685 | 679 | 187.8 |
| D | 6 | 42 | 2958089 | 16338.76 | 643 | 621 | 181.0 |
| D | 2 | 249 | 217044 | 1195.64 | 643 | 621 | 181.0 |
| D | 7 | 61 | 131637 | 723.81 | 643 | 621 | 181.0 |
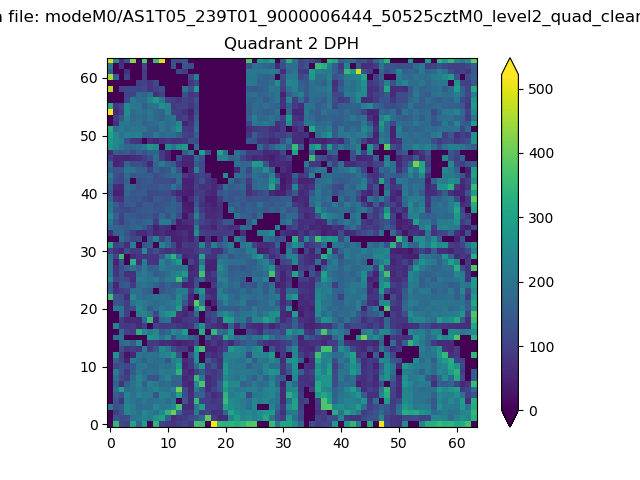
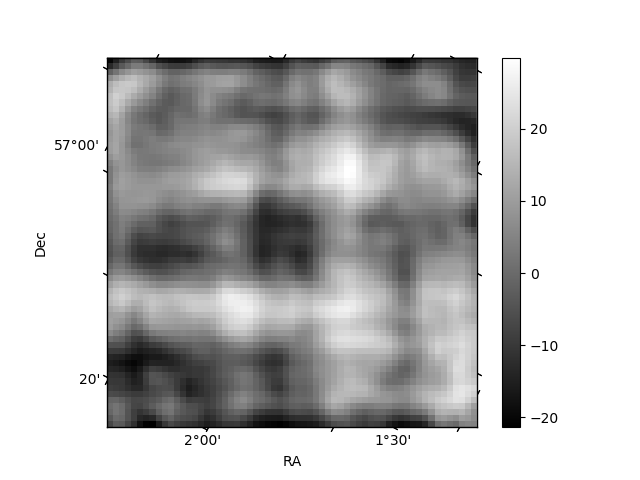
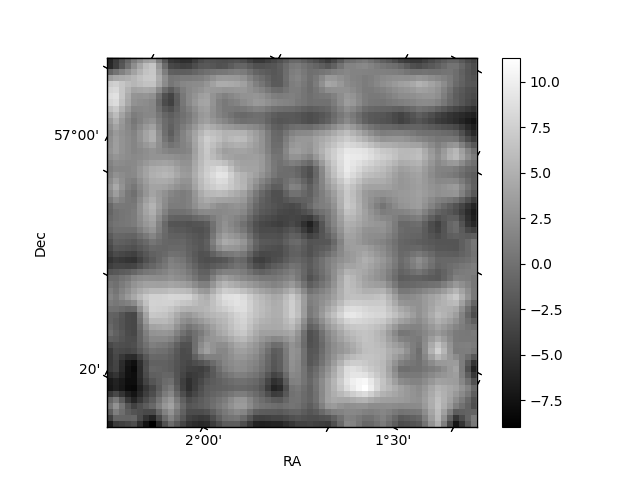
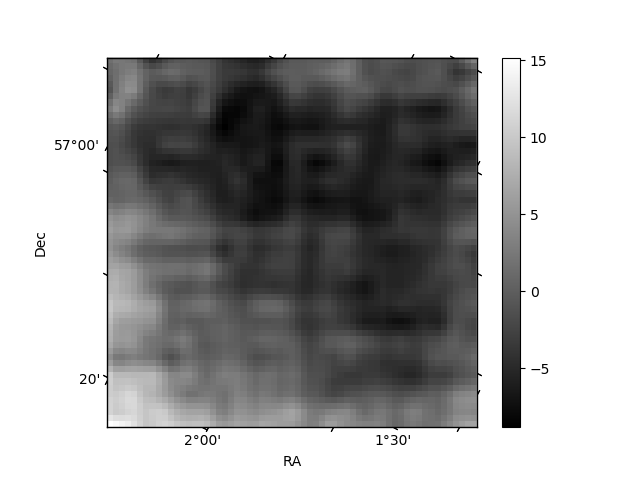
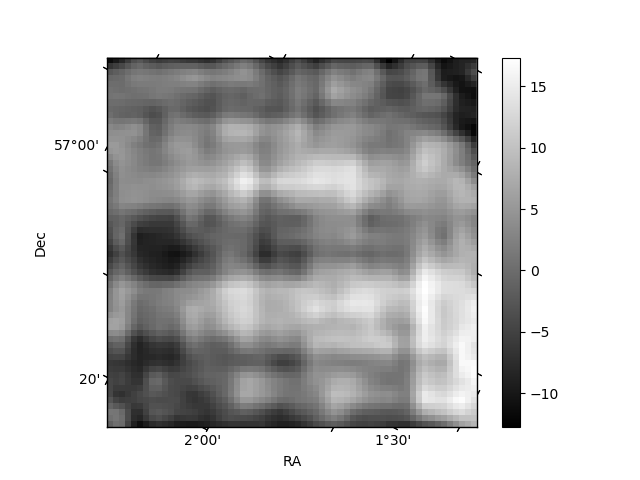
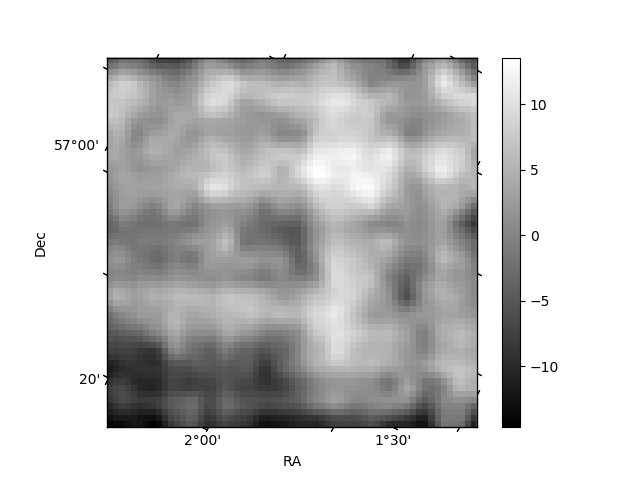
Histogram calculated using DETX and DETY for each event in the final _common_clean file
| Quadrant A | 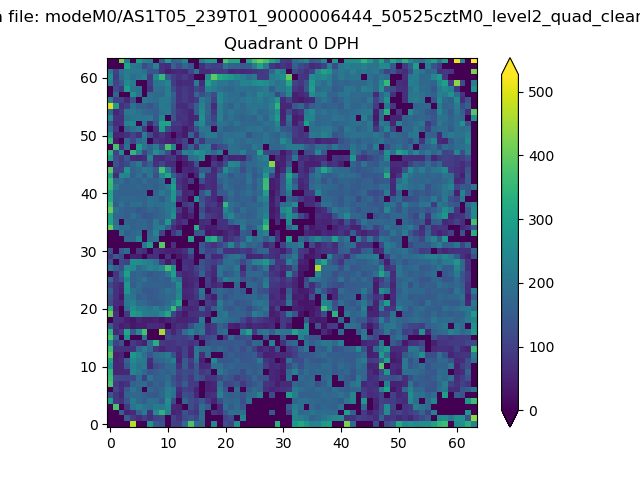 |
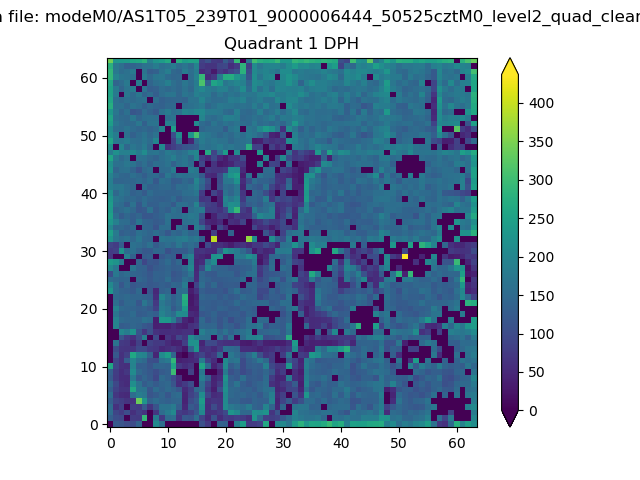 |
Quadrant B |
|---|---|---|---|
| Quadrant D | 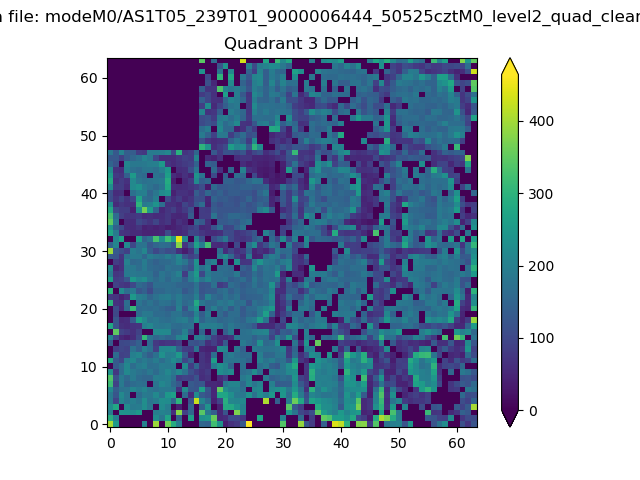 |
 |
Quadrant C |
| Plot type | Count rate plots | Images |
|---|---|---|
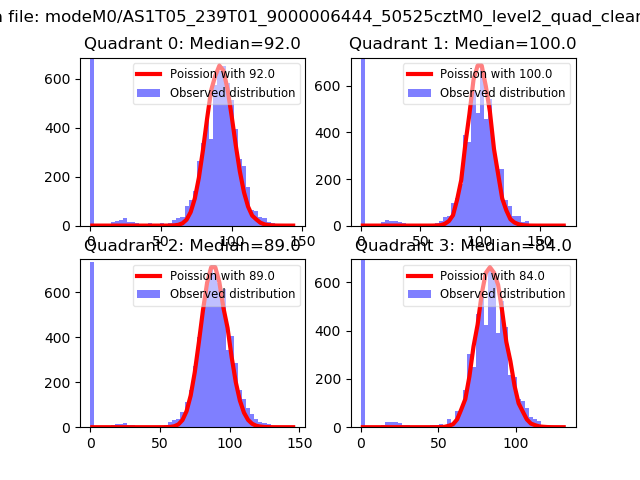
| Comparison with Poisson distribution Blue bars denote a histogram of data divided into 1 sec bins. Red curve is a Poisson curve with rate = median count rate of data. |
 |
 |
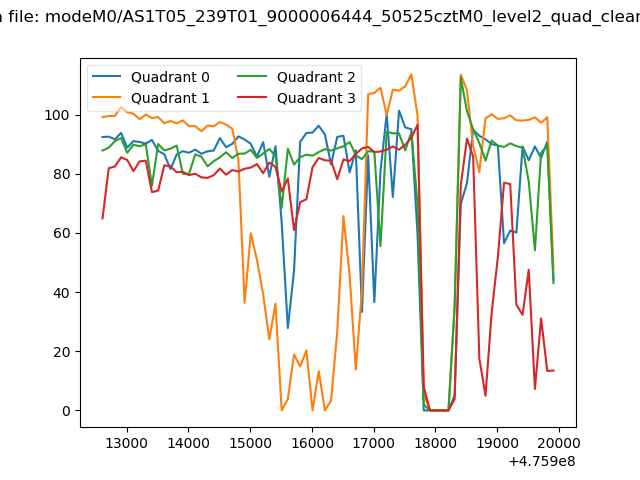
| Quadrant-wise count rates Data is divided into 100 sec bins |
 |
|
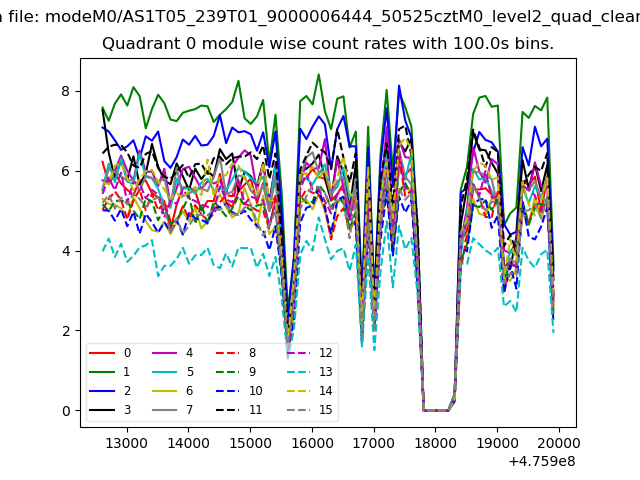
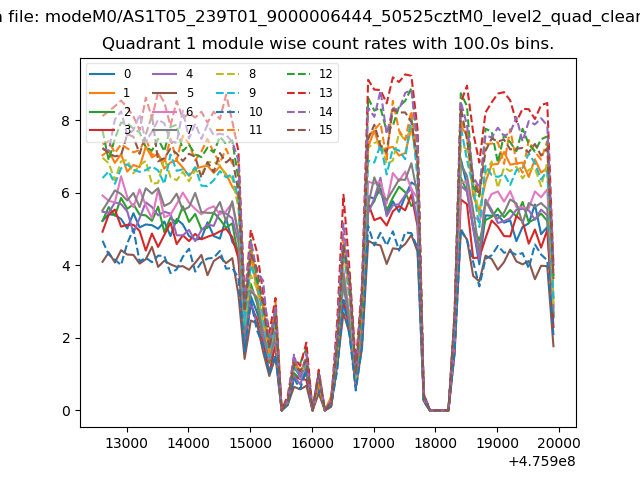
| Module-wise count rates for Quadrant A Data is divided into 100 sec bins |
 |
 |
| Module-wise count rates for Quadrant B Data is divided into 100 sec bins |
 |
 |
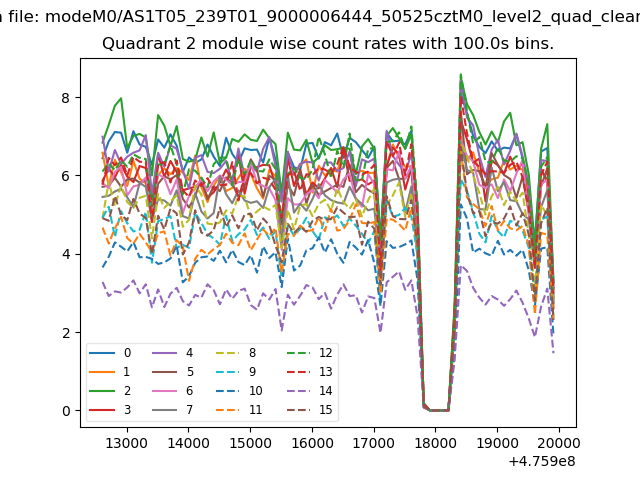
| Module-wise count rates for Quadrant C Data is divided into 100 sec bins |
 |
 |
| Module-wise count rates for Quadrant D Data is divided into 100 sec bins |
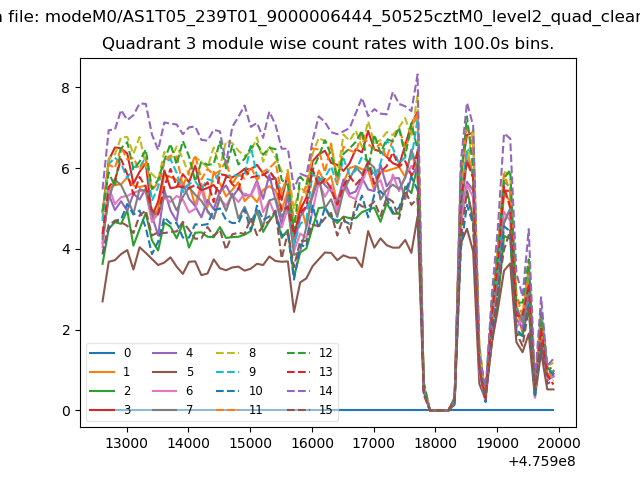 |
 |
| Parameter | Plot |
|---|---|
| CZT HV Monitor | 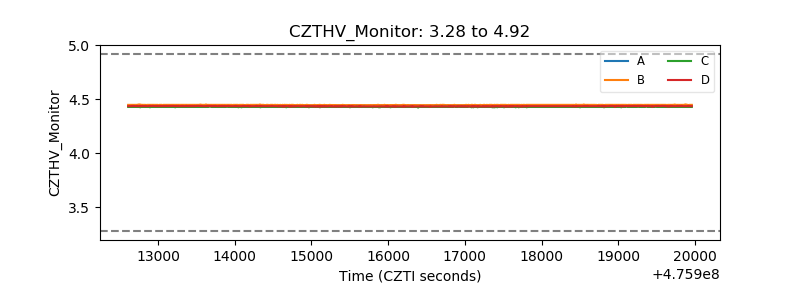 |
| D_VDD | 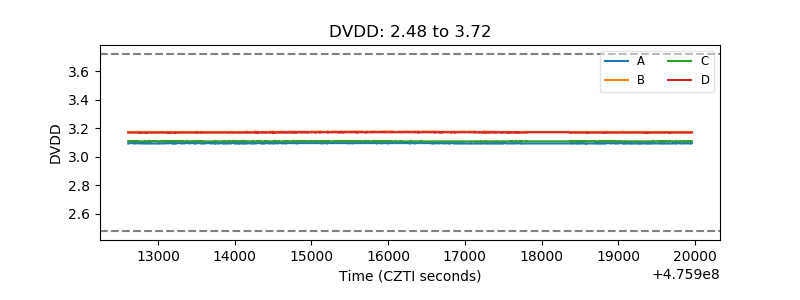 |
| Temperature 1 | 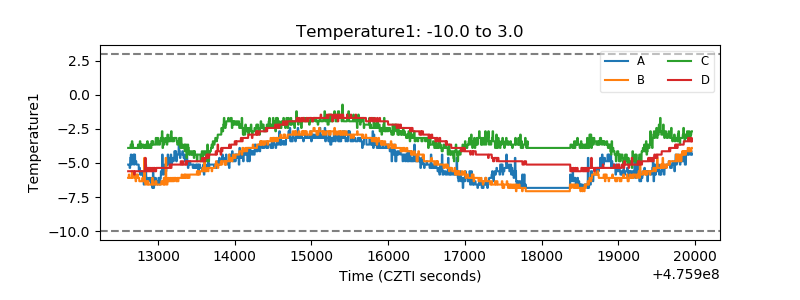 |
| Veto HV Monitor | 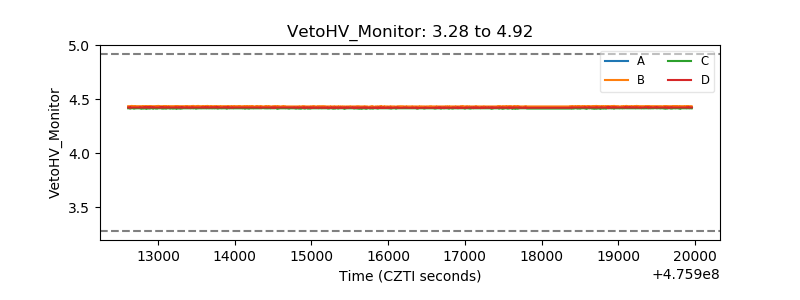 |
| Veto LLD | 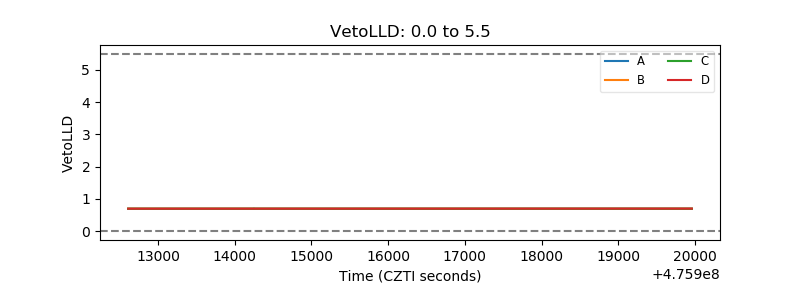 |
| Alpha Counter | 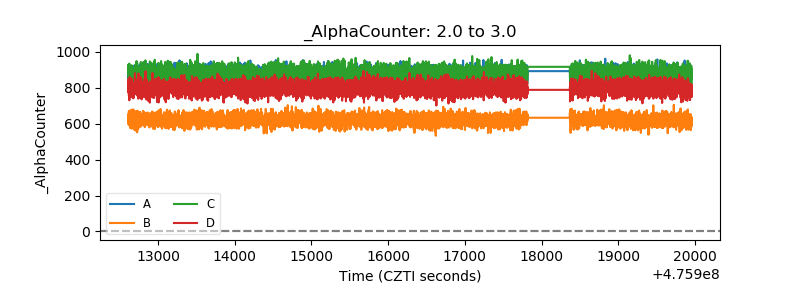 |
| _CPM_Rate | 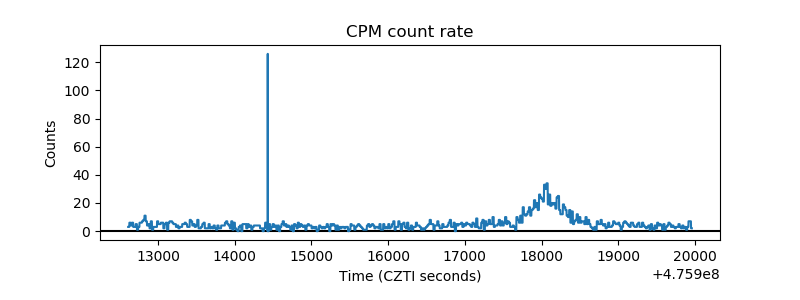 |
| CZT Counter | 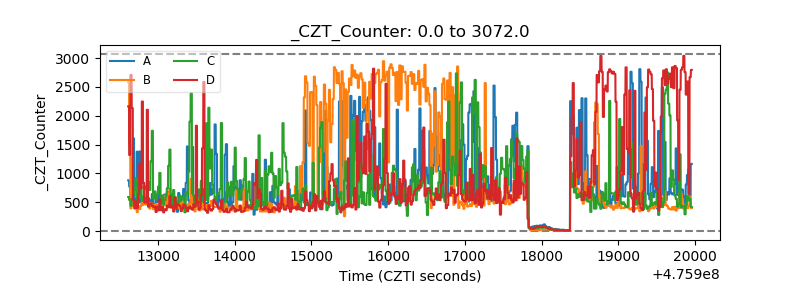 |
| +2.5 Volts monitor |  |
| +5 Volts monitor | 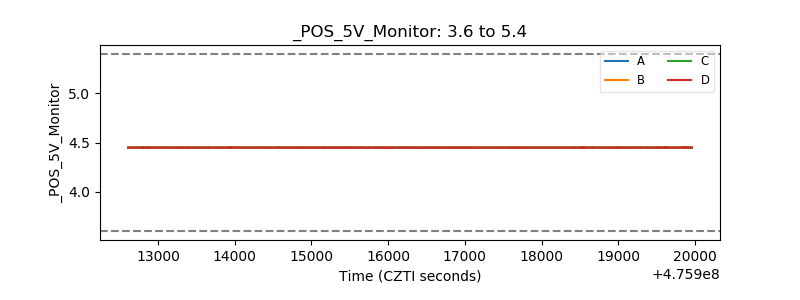 |
| _ROLL_ROT | 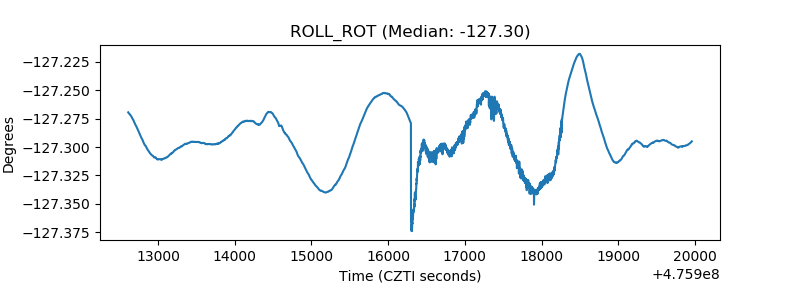 |
| _Roll_DEC | 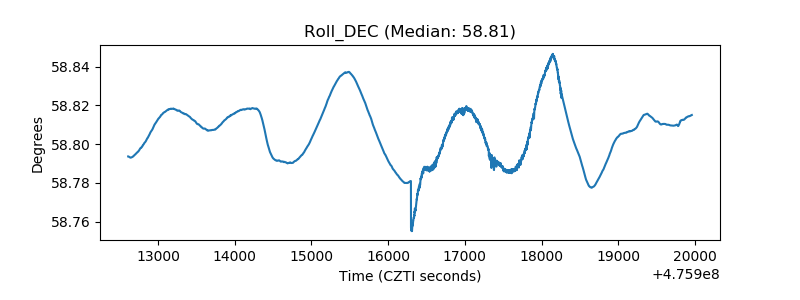 |
| _Roll_RA | 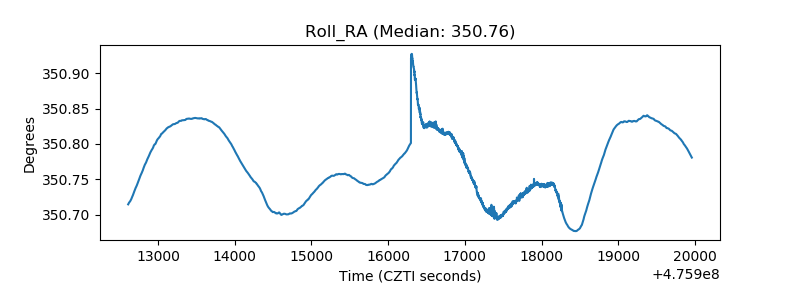 |
| Veto Counter | 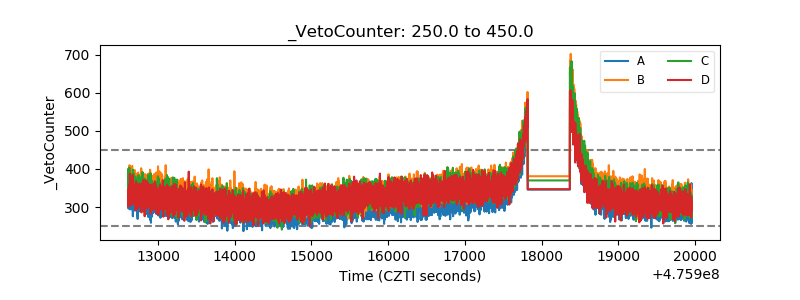 |