| Param | Original file | Final file |
|---|---|---|
| Filename | modeM0/AS1T05_239T01_9000006444_50531cztM0_level2.fits | modeM0/AS1T05_239T01_9000006444_50531cztM0_level2_quad_clean.evt |
| Size (bytes) | 2,389,331,520 | 203,587,200 |
| Size | 2.2 GB | 194.2 MB |
| Events in quadrant A | 14,967,605 | 1,511,346 |
| Events in quadrant B | 17,686,021 | 1,454,767 |
| Events in quadrant C | 23,687,515 | 1,136,605 |
| Events in quadrant D | 30,728,250 | 825,999 |
| Mode M0 | |||
|---|---|---|---|
| Quadrant | BADHDUFLAG | Total packets | Discarded packets |
| A | 0 | 56422 | 3 |
| B | 0 | 64709 | 5 |
| C | 0 | 82770 | 3 |
| D | 0 | 103697 | 3 |
| Mode M9 | |||
|---|---|---|---|
| Quadrant | BADHDUFLAG | Total packets | Discarded packets |
| A | 0 | 13 | 0 |
| B | 0 | 13 | 0 |
| C | 0 | 13 | 0 |
| D | 0 | 13 | 0 |
| Mode SS | |||
|---|---|---|---|
| Quadrant | BADHDUFLAG | Total packets | Discarded packets |
| A | 0 | 366 | 0 |
| B | 0 | 366 | 0 |
| C | 0 | 366 | 0 |
| D | 0 | 366 | 0 |
| Quadrant | Total seconds | Saturated seconds | Saturation percentage |
|---|---|---|---|
| A | 17894 | 1684 | 9.410976% |
| B | 17894 | 3228 | 18.039566% |
| C | 17894 | 5131 | 28.674416% |
| D | 17894 | 8170 | 45.657762% |
Noise dominated data is calculated using 1-second bins in cleaned event files. If a bin has >2000 counts, and if more than 50% of those come from <1% of pixels, then it is considered to be noise-dominated and hence unusable.
| Quadrant | # 1 sec bins | Bins with >0 counts | Bins with >2000 counts | High rate bins dominated by noise | Noise dominated (total time) | Noise dominated (detector-on time) | Marked lightcurve |
|---|---|---|---|---|---|---|---|
| A | 19284 | 17897 | 1163 | 1163 | 6.03% | 6.50% | 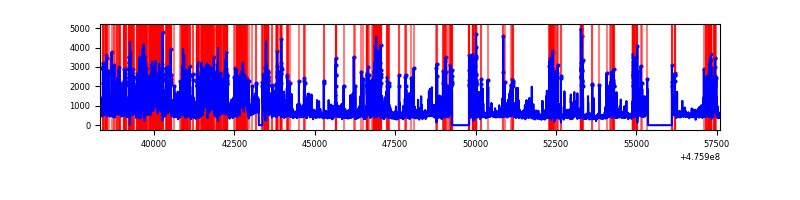 |
| B | 19284 | 17897 | 2314 | 2314 | 12.00% | 12.93% | 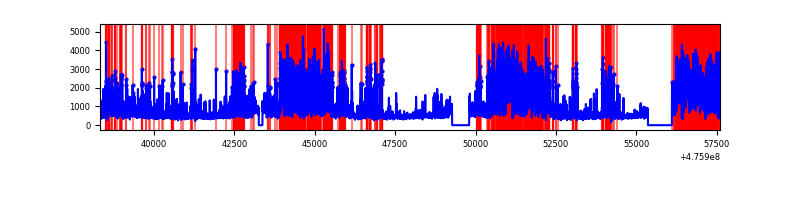 |
| C | 19284 | 17897 | 3529 | 3529 | 18.30% | 19.72% | 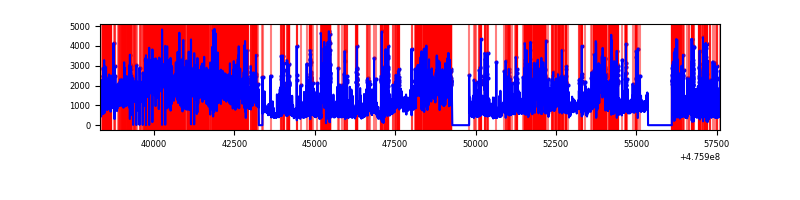 |
| D | 19284 | 17895 | 7409 | 7409 | 38.42% | 41.40% | 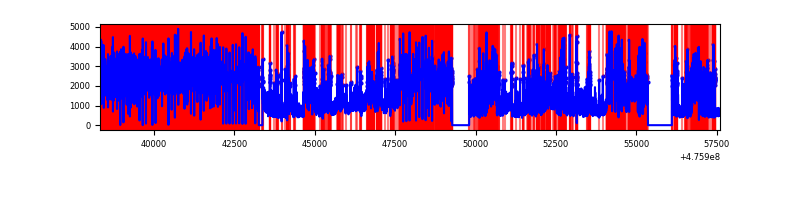 |
Top three noisy pixels from each quadrant. If the there are fewer than three noisy pixels in the level2.evt file, extra rows are filled as -1
| Pixel properties | Quadrant properties | ||||||
|---|---|---|---|---|---|---|---|
| Quadrant | DetID | PixID | Counts | Sigma | Mean | Median | Sigma |
| A | 12 | 250 | 1844489 | 3991.28 | 1862 | 1811 | 461.7 |
| A | 3 | 14 | 1480241 | 3202.31 | 1862 | 1811 | 461.7 |
| A | 3 | 130 | 782537 | 1691.07 | 1862 | 1811 | 461.7 |
| B | 7 | 0 | 6059172 | 16062.7 | 1783 | 1722 | 377.1 |
| B | 4 | 170 | 1634758 | 4330.36 | 1783 | 1722 | 377.1 |
| B | 1 | 255 | 1036112 | 2742.92 | 1783 | 1722 | 377.1 |
| C | 15 | 174 | 3004641 | 6766.07 | 1634 | 1625 | 443.8 |
| C | 15 | 232 | 2081427 | 4685.99 | 1634 | 1625 | 443.8 |
| C | 15 | 214 | 1717000 | 3864.9 | 1634 | 1625 | 443.8 |
| D | 7 | 61 | 9308543 | 23689.87 | 1396 | 1344 | 392.9 |
| D | 15 | 184 | 6025944 | 15334.58 | 1396 | 1344 | 392.9 |
| D | 7 | 60 | 1791711 | 4557.07 | 1396 | 1344 | 392.9 |
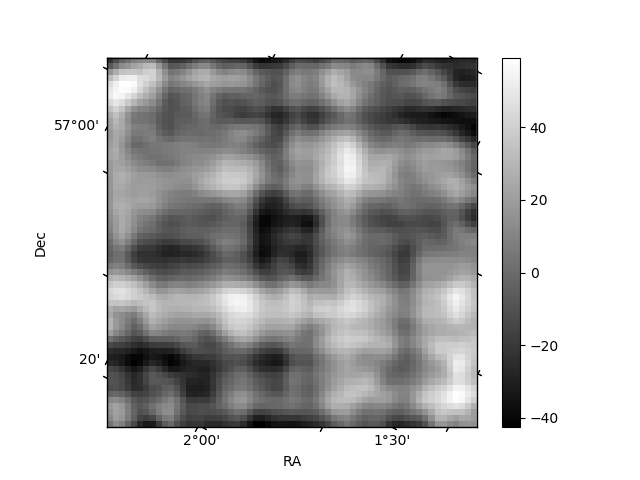
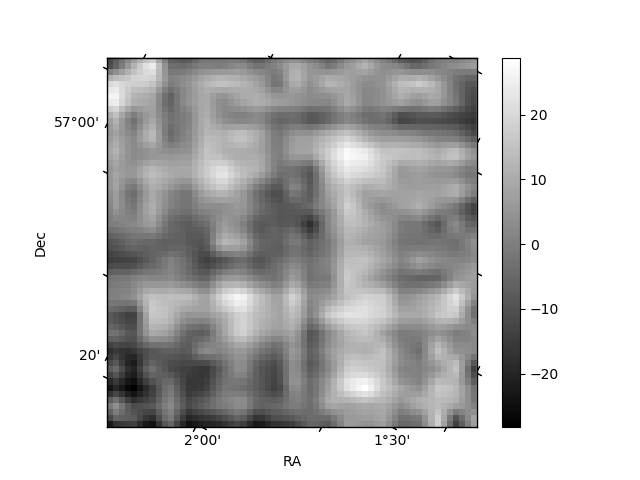
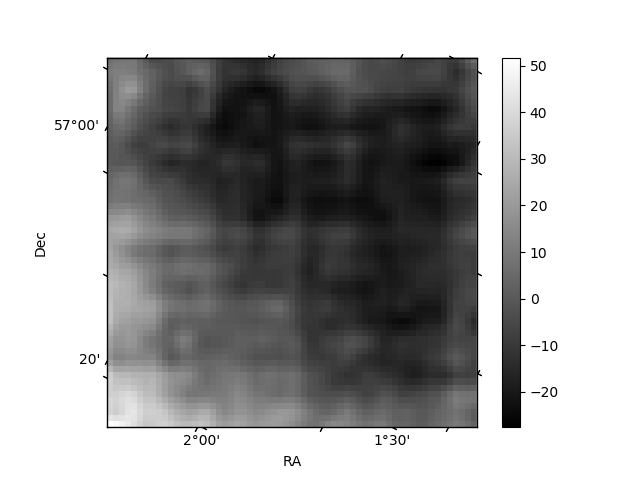
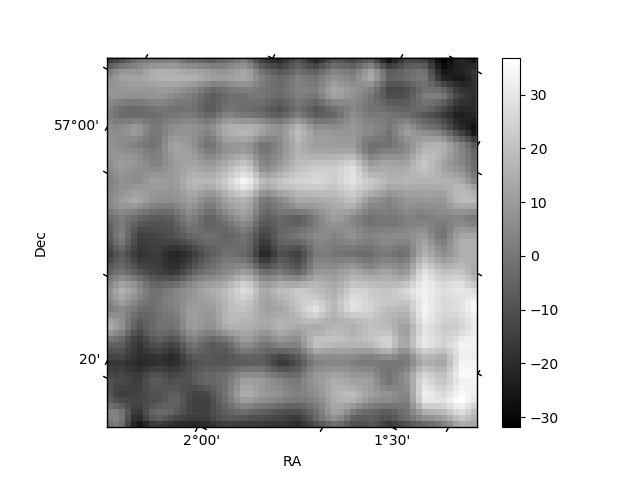
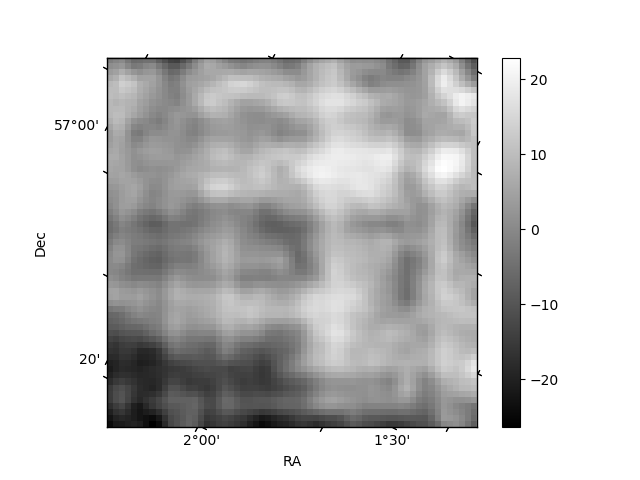
Histogram calculated using DETX and DETY for each event in the final _common_clean file
| Quadrant A | 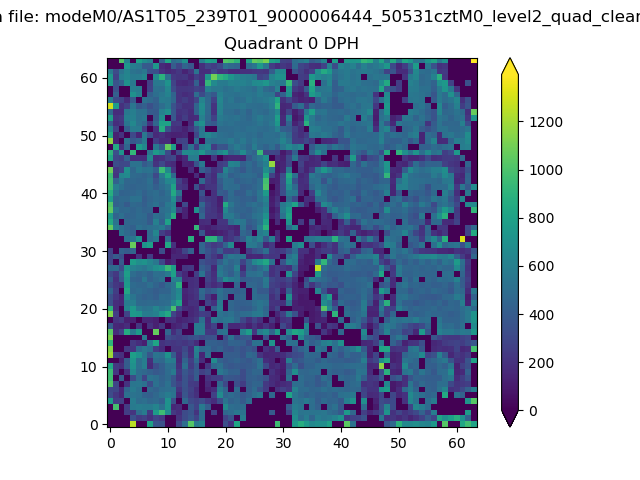 |
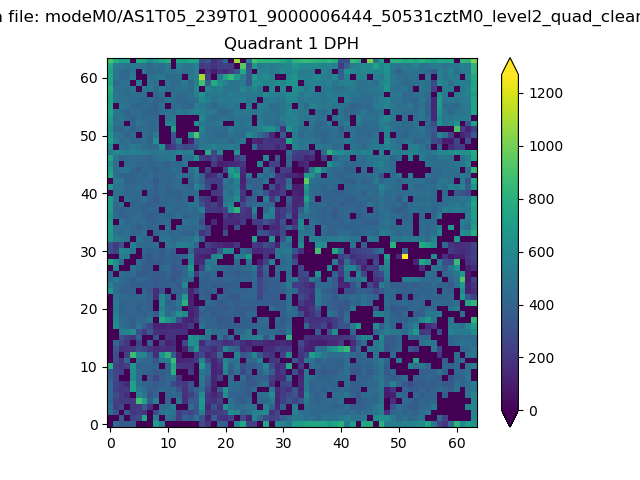 |
Quadrant B |
|---|---|---|---|
| Quadrant D | 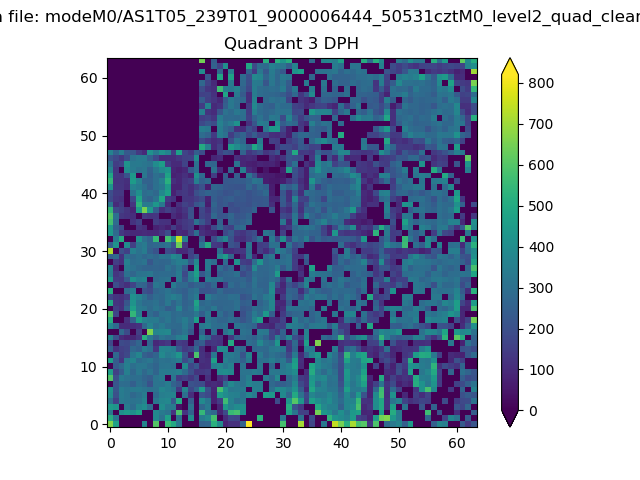 |
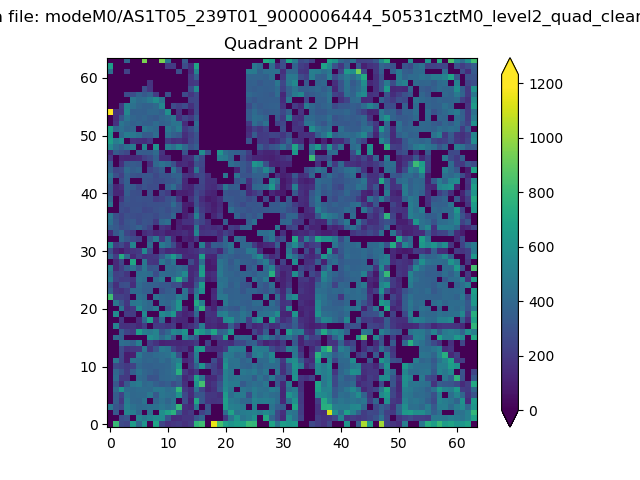 |
Quadrant C |
| Plot type | Count rate plots | Images |
|---|---|---|
| Comparison with Poisson distribution Blue bars denote a histogram of data divided into 1 sec bins. Red curve is a Poisson curve with rate = median count rate of data. |
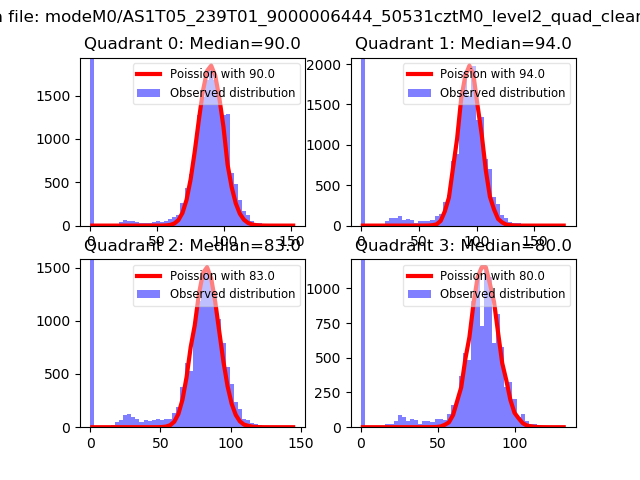 |
 |
| Quadrant-wise count rates Data is divided into 100 sec bins |
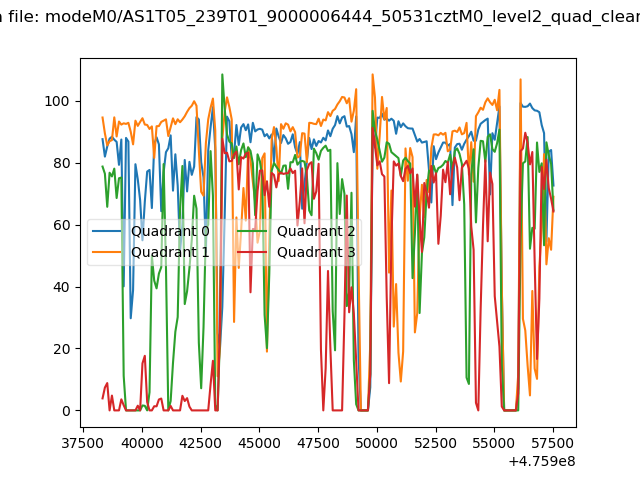 |
|
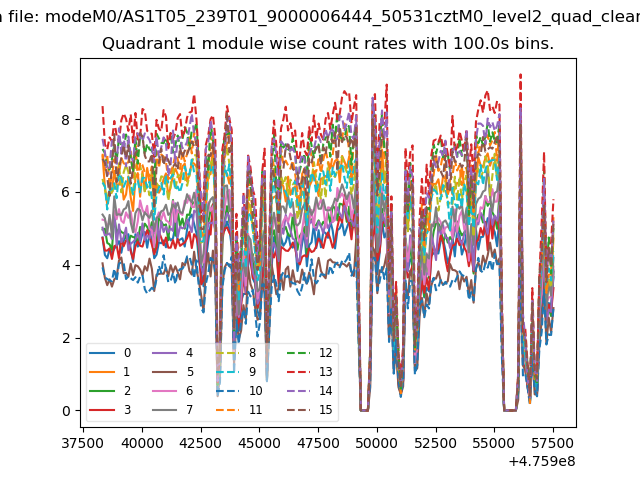
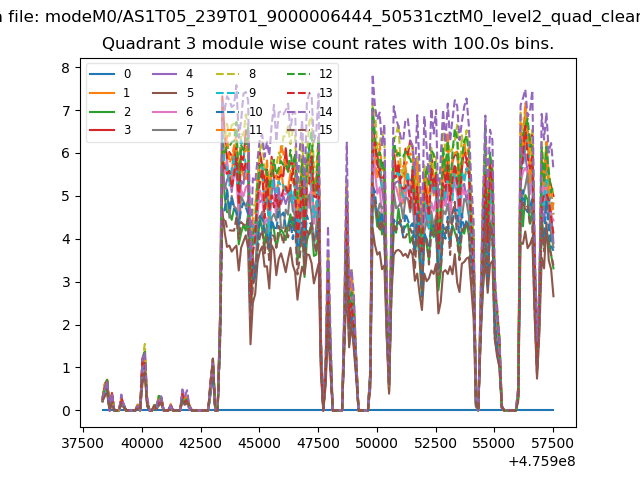
| Module-wise count rates for Quadrant A Data is divided into 100 sec bins |
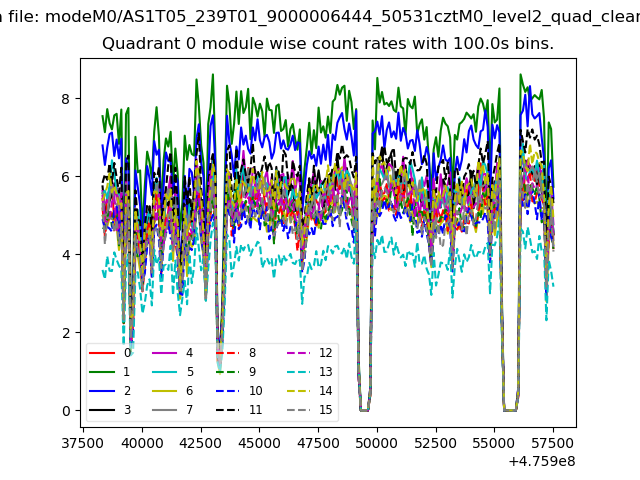 |
 |
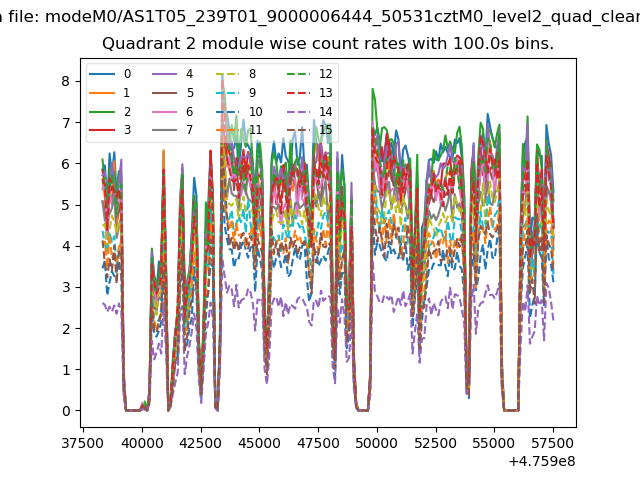
| Module-wise count rates for Quadrant B Data is divided into 100 sec bins |
 |
 |
| Module-wise count rates for Quadrant C Data is divided into 100 sec bins |
 |
 |
| Module-wise count rates for Quadrant D Data is divided into 100 sec bins |
 |
 |
| Parameter | Plot |
|---|---|
| CZT HV Monitor | 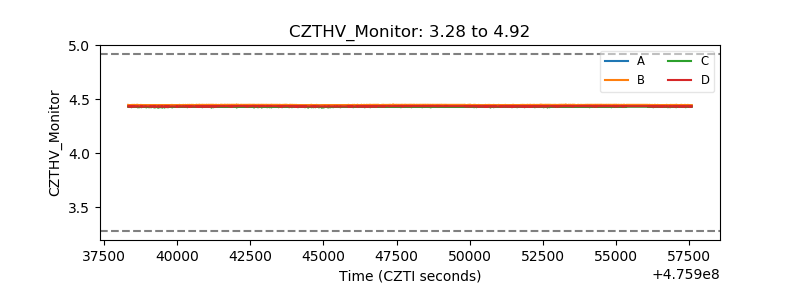 |
| D_VDD | 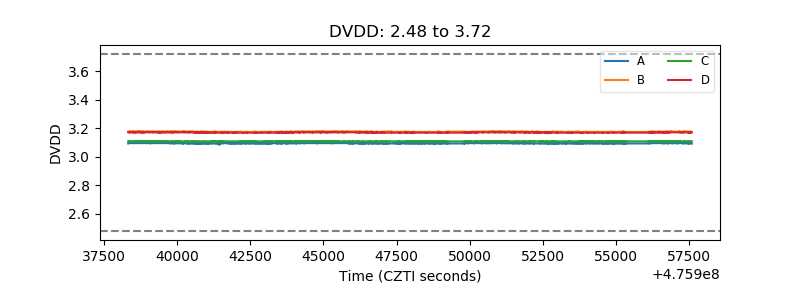 |
| Temperature 1 | 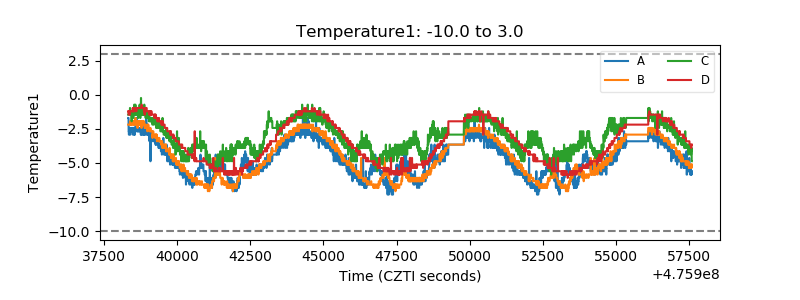 |
| Veto HV Monitor | 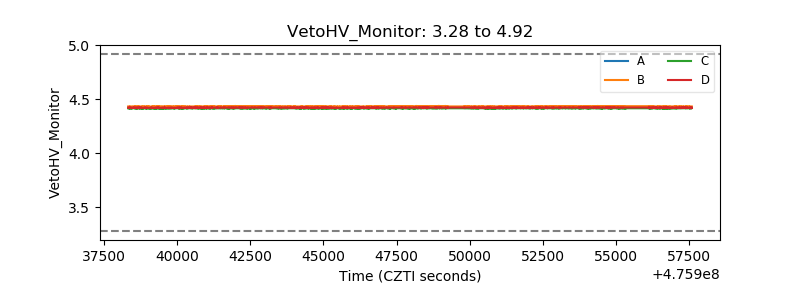 |
| Veto LLD | 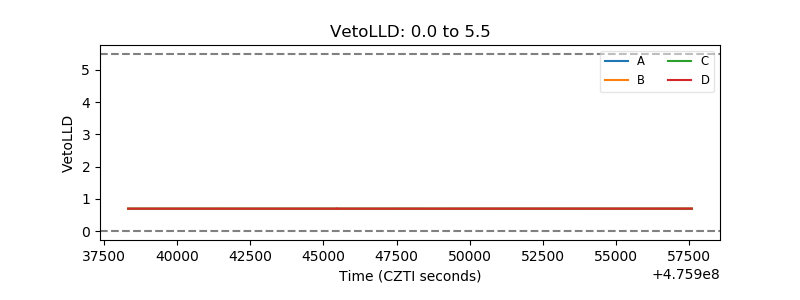 |
| Alpha Counter | 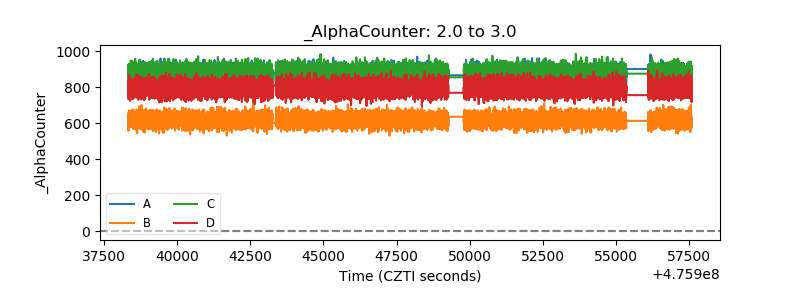 |
| _CPM_Rate | 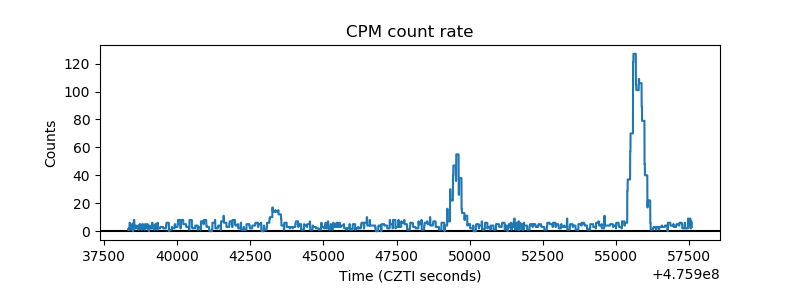 |
| CZT Counter | 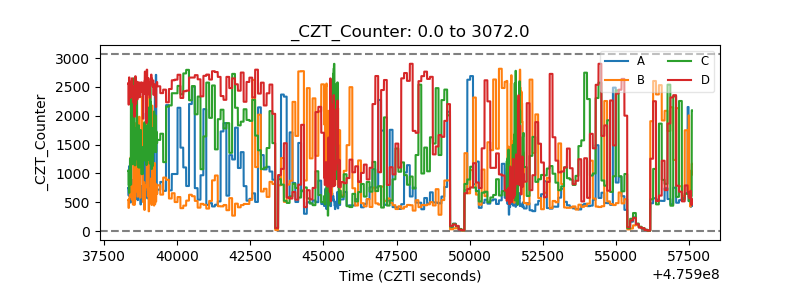 |
| +2.5 Volts monitor |  |
| +5 Volts monitor | 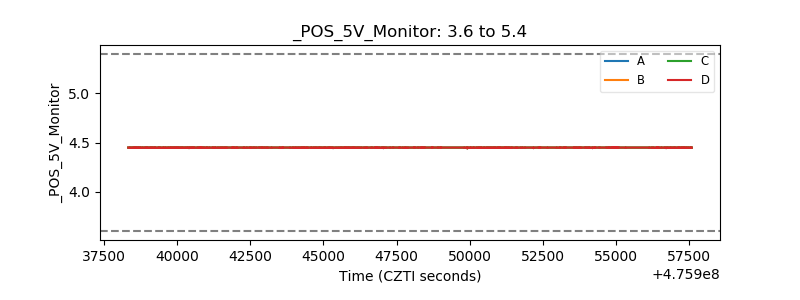 |
| _ROLL_ROT | 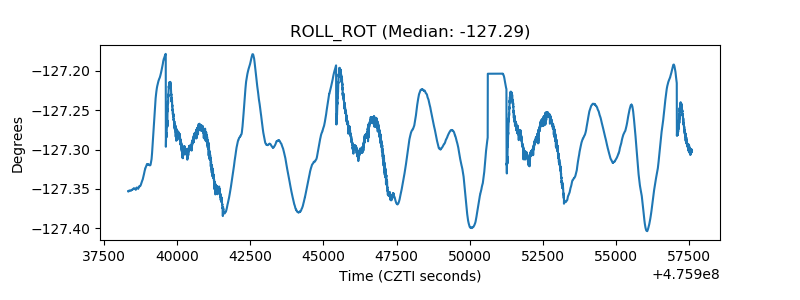 |
| _Roll_DEC | 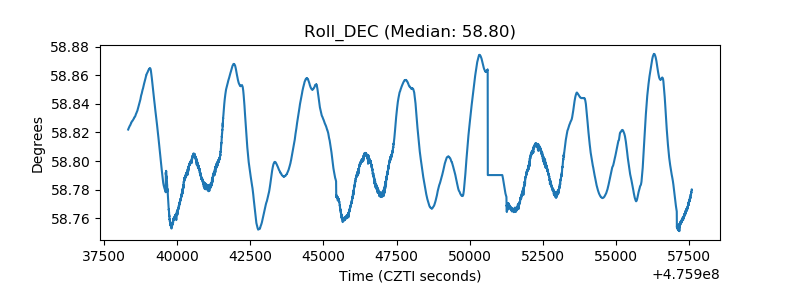 |
| _Roll_RA | 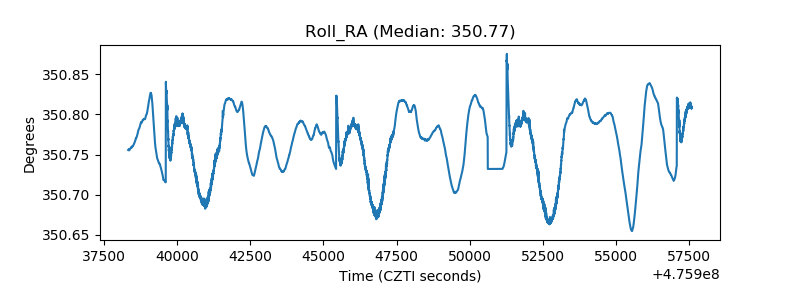 |
| Veto Counter | 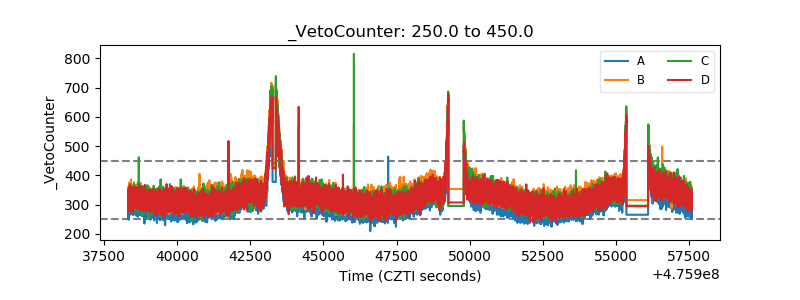 |