| Param | Original file | Final file |
|---|---|---|
| Filename | modeM0/AS1T05_239T01_9000006444_50532cztM0_level2.fits | modeM0/AS1T05_239T01_9000006444_50532cztM0_level2_quad_clean.evt |
| Size (bytes) | 654,229,440 | 84,407,040 |
| Size | 623.9 MB | 80.5 MB |
| Events in quadrant A | 3,879,500 | 589,944 |
| Events in quadrant B | 7,405,589 | 522,149 |
| Events in quadrant C | 6,582,243 | 501,301 |
| Events in quadrant D | 5,854,452 | 495,133 |
| Mode M0 | |||
|---|---|---|---|
| Quadrant | BADHDUFLAG | Total packets | Discarded packets |
| A | 0 | 15721 | 1 |
| B | 0 | 26432 | 1 |
| C | 0 | 23921 | 1 |
| D | 0 | 21750 | 1 |
| Mode M9 | |||
|---|---|---|---|
| Quadrant | BADHDUFLAG | Total packets | Discarded packets |
| A | 0 | 9 | 0 |
| B | 0 | 9 | 0 |
| C | 0 | 9 | 0 |
| D | 0 | 9 | 0 |
| Mode SS | |||
|---|---|---|---|
| Quadrant | BADHDUFLAG | Total packets | Discarded packets |
| A | 0 | 132 | 0 |
| B | 0 | 132 | 0 |
| C | 0 | 132 | 0 |
| D | 0 | 132 | 0 |
| Quadrant | Total seconds | Saturated seconds | Saturation percentage |
|---|---|---|---|
| A | 6400 | 163 | 2.546875% |
| B | 6401 | 1424 | 22.246524% |
| C | 6401 | 968 | 15.122637% |
| D | 6401 | 660 | 10.310889% |
Noise dominated data is calculated using 1-second bins in cleaned event files. If a bin has >2000 counts, and if more than 50% of those come from <1% of pixels, then it is considered to be noise-dominated and hence unusable.
| Quadrant | # 1 sec bins | Bins with >0 counts | Bins with >2000 counts | High rate bins dominated by noise | Noise dominated (total time) | Noise dominated (detector-on time) | Marked lightcurve |
|---|---|---|---|---|---|---|---|
| A | 7340 | 6401 | 128 | 128 | 1.74% | 2.00% | 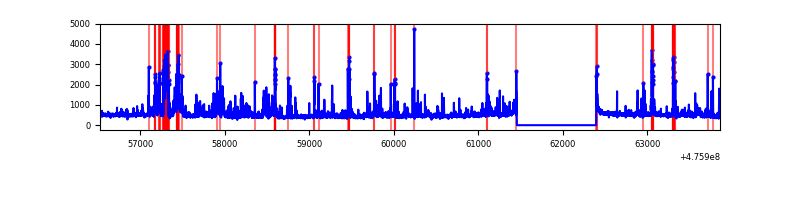 |
| B | 7341 | 6402 | 1055 | 1055 | 14.37% | 16.48% | 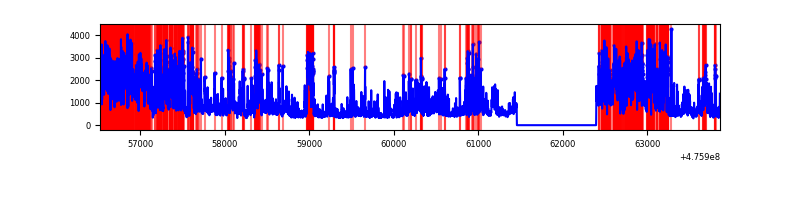 |
| C | 7341 | 6402 | 776 | 776 | 10.57% | 12.12% | 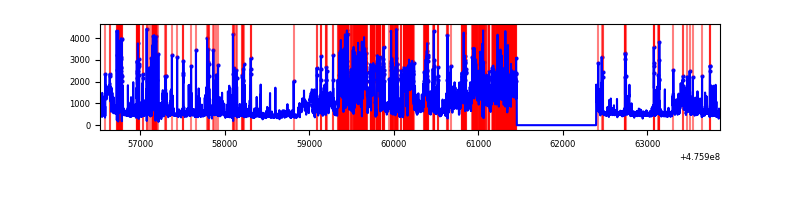 |
| D | 7341 | 6402 | 583 | 583 | 7.94% | 9.11% | 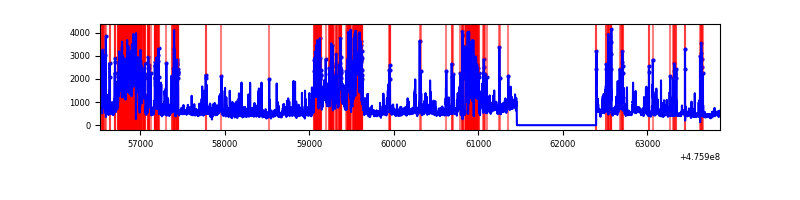 |
Top three noisy pixels from each quadrant. If the there are fewer than three noisy pixels in the level2.evt file, extra rows are filled as -1
| Pixel properties | Quadrant properties | ||||||
|---|---|---|---|---|---|---|---|
| Quadrant | DetID | PixID | Counts | Sigma | Mean | Median | Sigma |
| A | 6 | 161 | 353655 | 2141.32 | 670 | 655 | 164.9 |
| A | 4 | 3 | 173295 | 1047.25 | 670 | 655 | 164.9 |
| A | 3 | 130 | 170068 | 1027.67 | 670 | 655 | 164.9 |
| B | 7 | 0 | 3345773 | 25632.53 | 614 | 591 | 130.5 |
| B | 4 | 170 | 1175187 | 9000.37 | 614 | 591 | 130.5 |
| B | 2 | 249 | 127659 | 973.66 | 614 | 591 | 130.5 |
| C | 15 | 232 | 1101356 | 6367.77 | 625 | 622 | 172.9 |
| C | 12 | 252 | 923243 | 5337.38 | 625 | 622 | 172.9 |
| C | 15 | 174 | 629074 | 3635.61 | 625 | 622 | 172.9 |
| D | 6 | 42 | 775560 | 4333.93 | 635 | 614 | 178.8 |
| D | 15 | 79 | 521835 | 2914.96 | 635 | 614 | 178.8 |
| D | 8 | 246 | 477620 | 2667.68 | 635 | 614 | 178.8 |
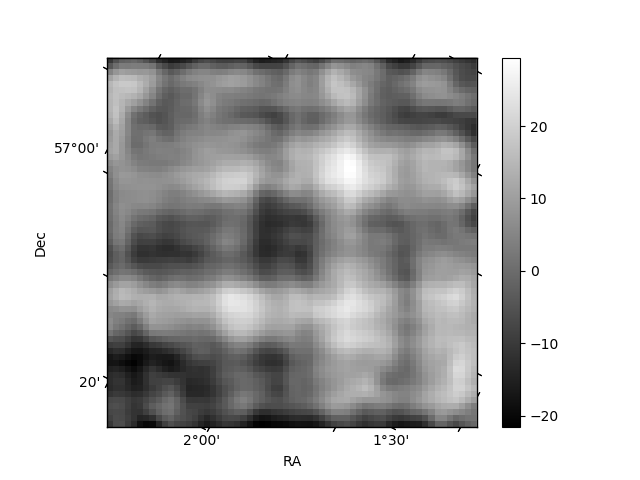
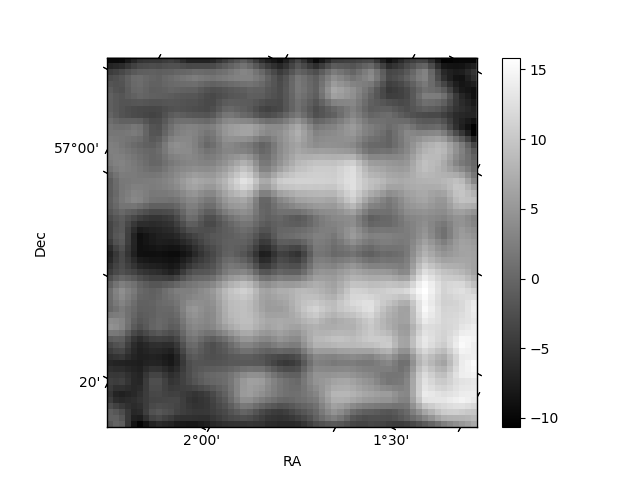
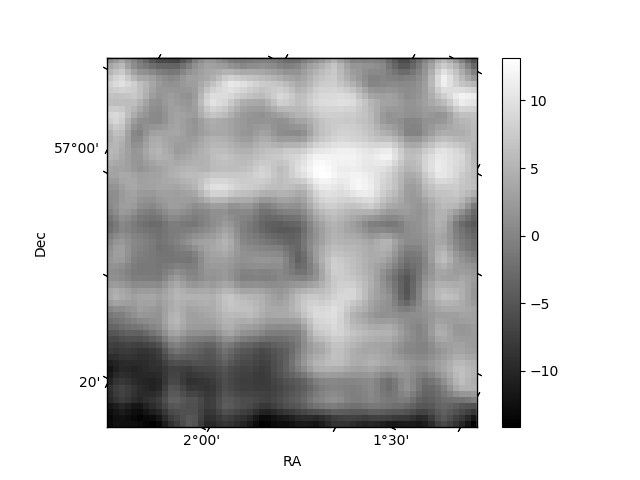
Histogram calculated using DETX and DETY for each event in the final _common_clean file
| Quadrant A | 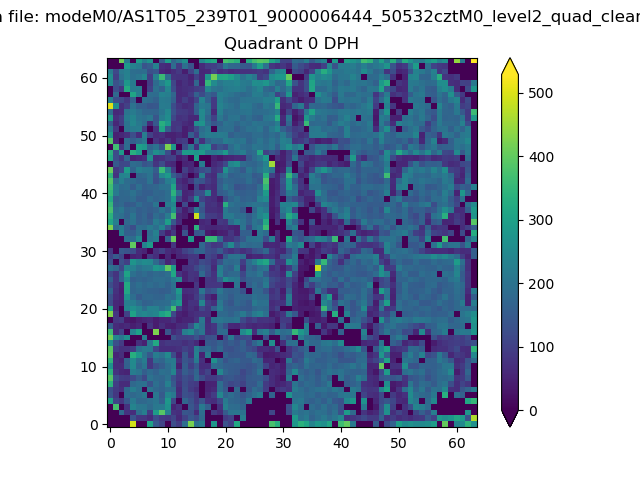 |
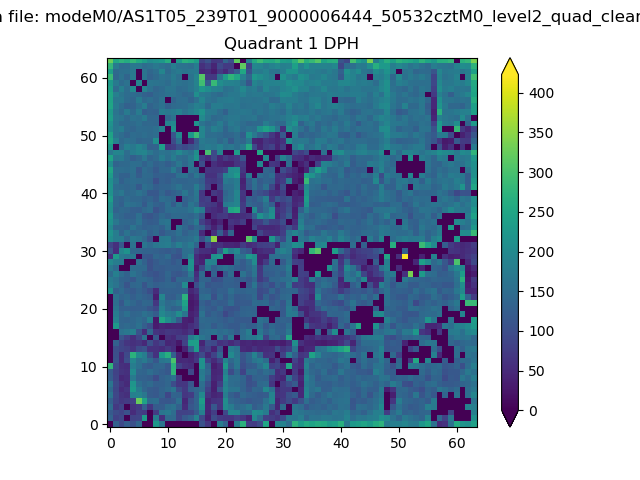 |
Quadrant B |
|---|---|---|---|
| Quadrant D | 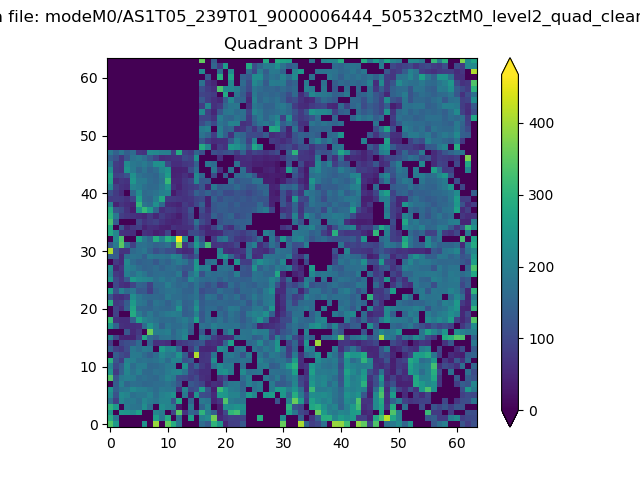 |
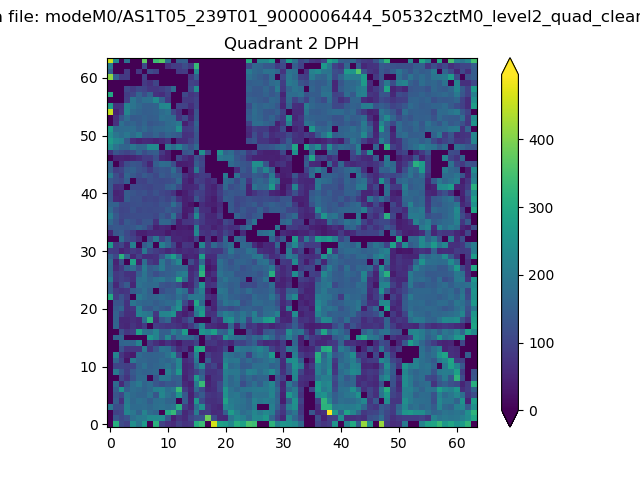 |
Quadrant C |
| Plot type | Count rate plots | Images |
|---|---|---|
| Comparison with Poisson distribution Blue bars denote a histogram of data divided into 1 sec bins. Red curve is a Poisson curve with rate = median count rate of data. |
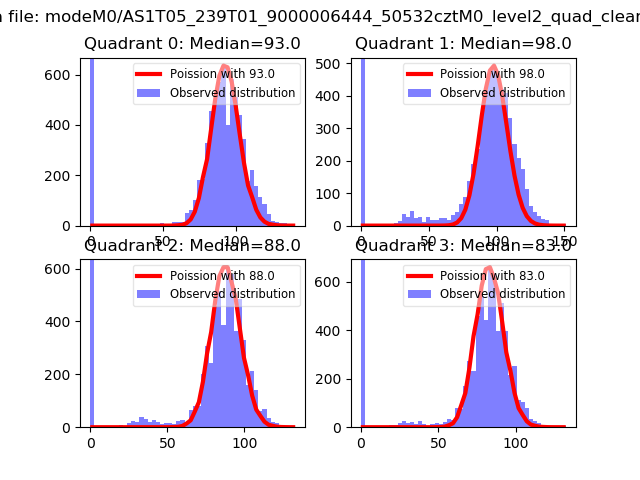 |
 |
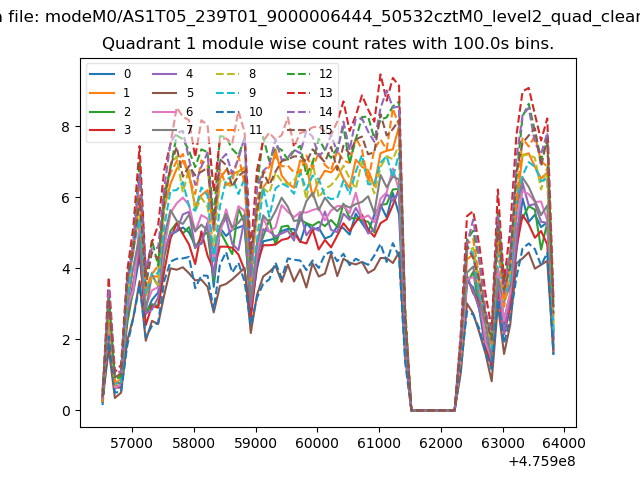
| Quadrant-wise count rates Data is divided into 100 sec bins |
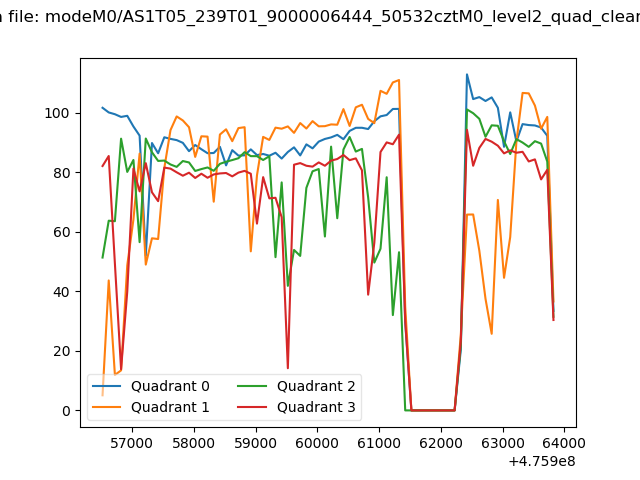 |
|
| Module-wise count rates for Quadrant A Data is divided into 100 sec bins |
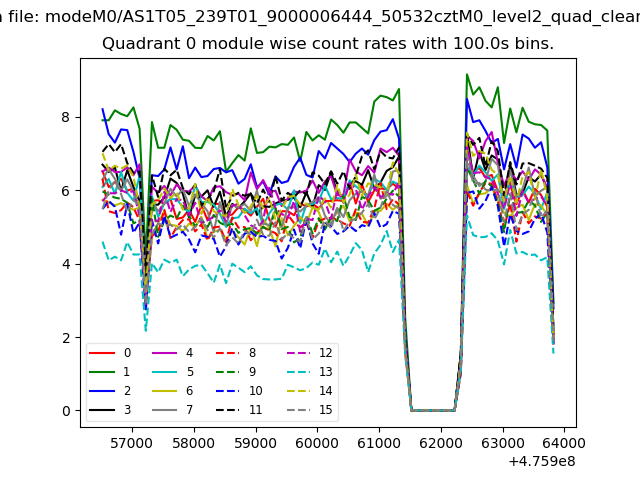 |
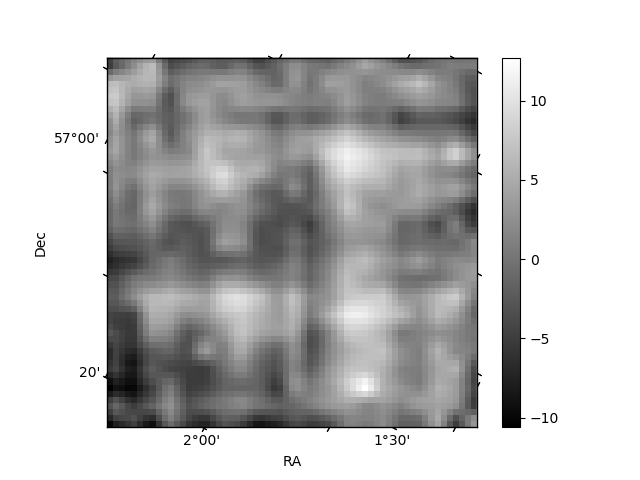 |
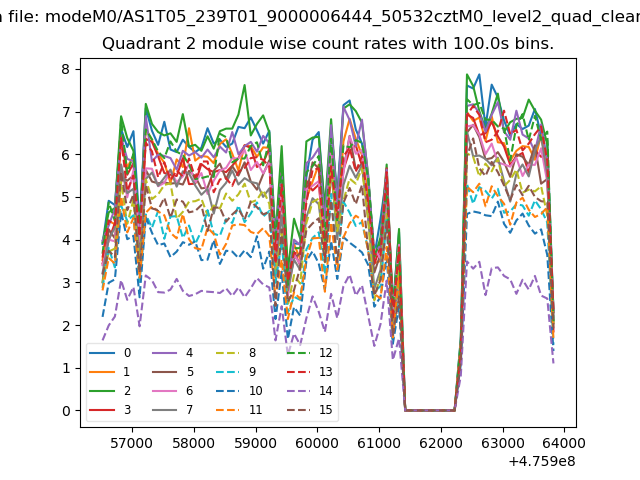
| Module-wise count rates for Quadrant B Data is divided into 100 sec bins |
 |
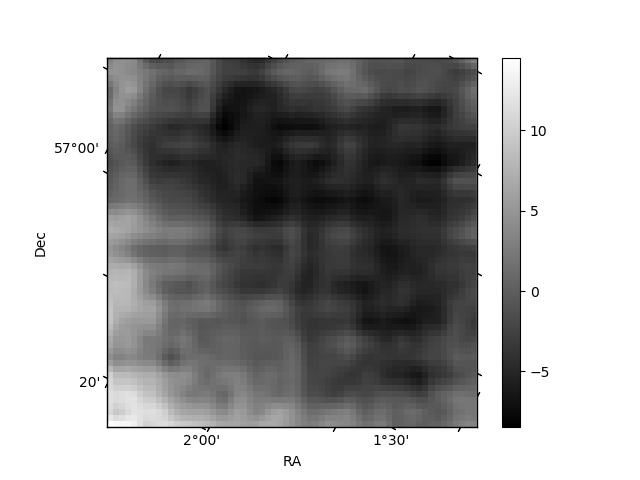 |
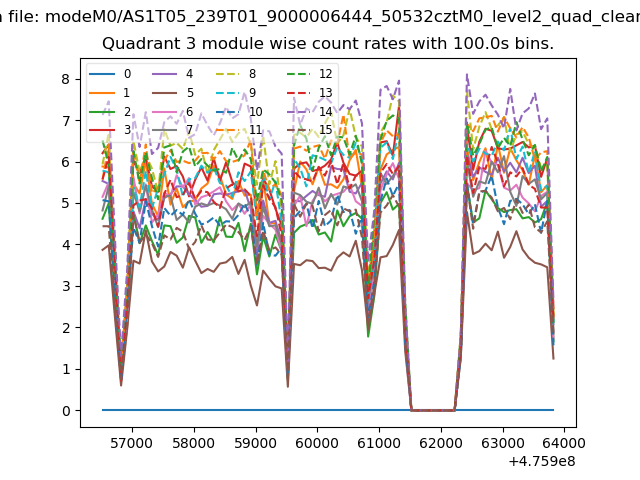
| Module-wise count rates for Quadrant C Data is divided into 100 sec bins |
 |
 |
| Module-wise count rates for Quadrant D Data is divided into 100 sec bins |
 |
 |
| Parameter | Plot |
|---|---|
| CZT HV Monitor | 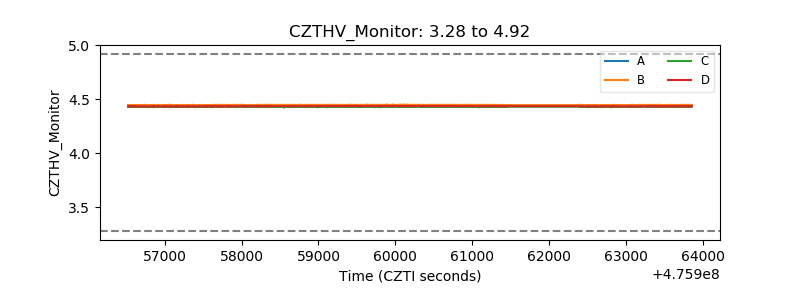 |
| D_VDD | 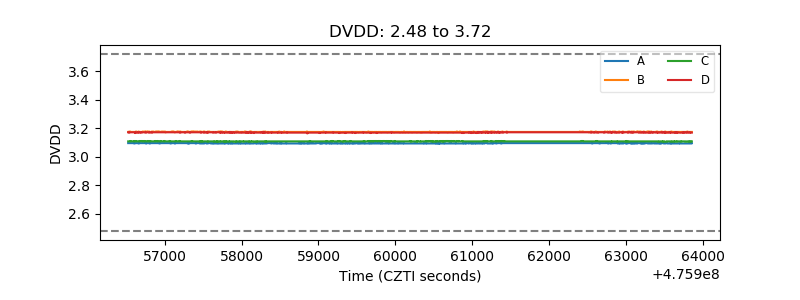 |
| Temperature 1 | 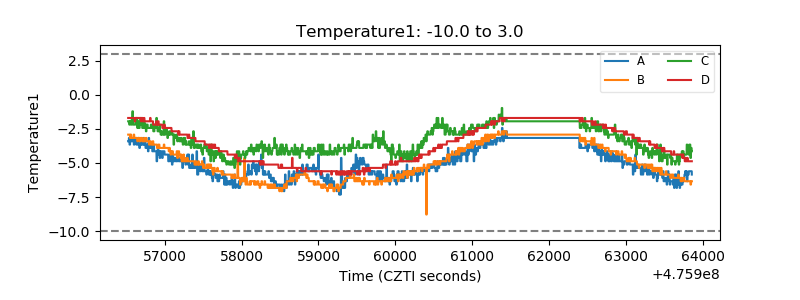 |
| Veto HV Monitor |  |
| Veto LLD | 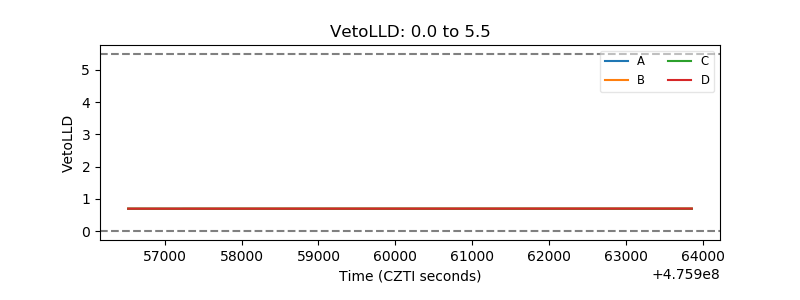 |
| Alpha Counter | 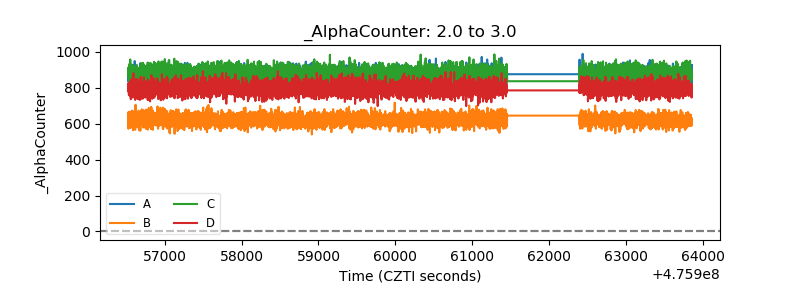 |
| _CPM_Rate | 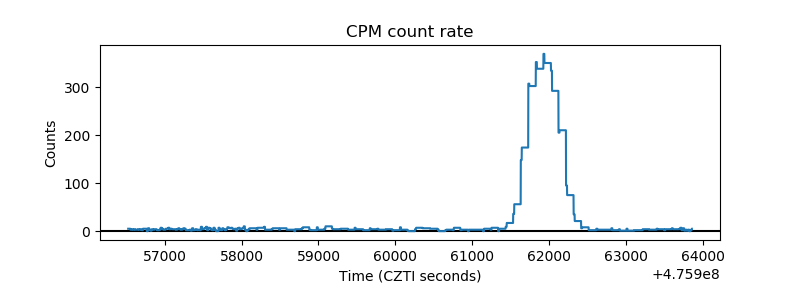 |
| CZT Counter | 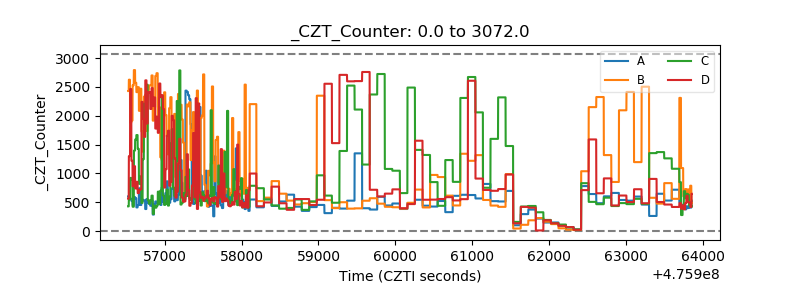 |
| +2.5 Volts monitor | 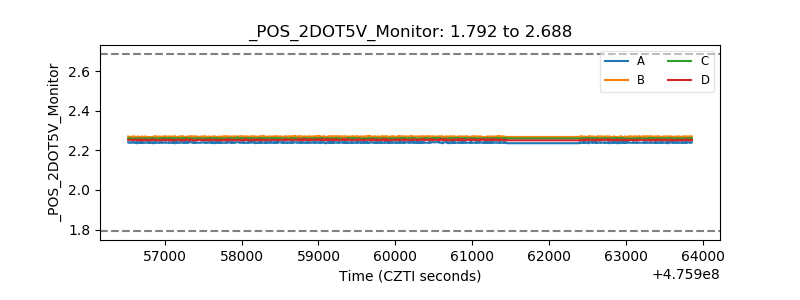 |
| +5 Volts monitor | 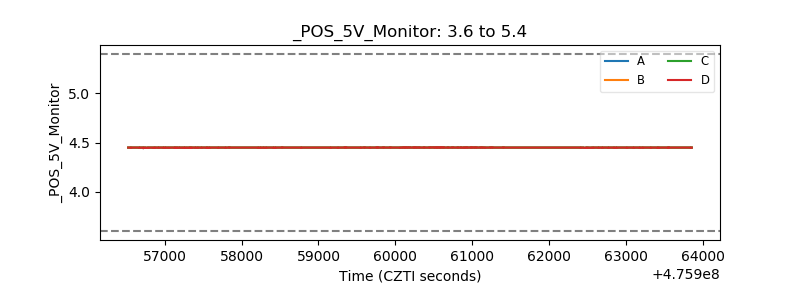 |
| _ROLL_ROT | 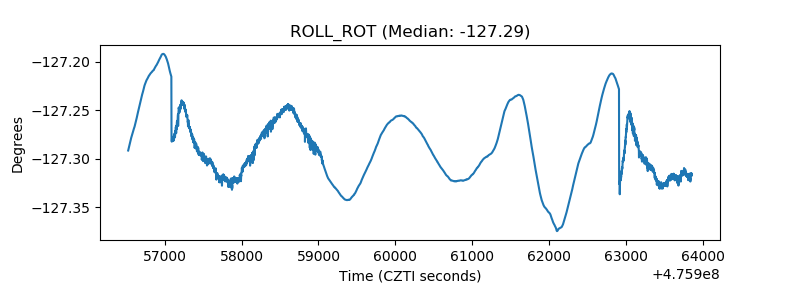 |
| _Roll_DEC | 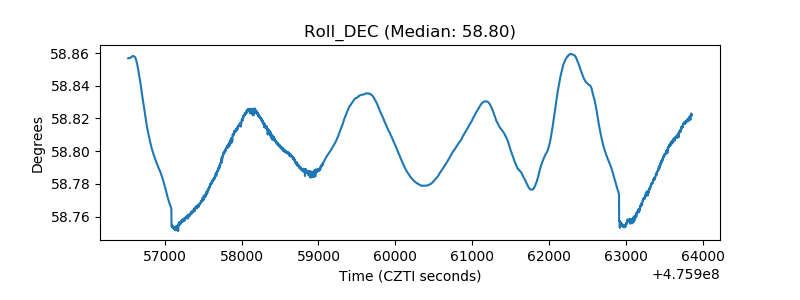 |
| _Roll_RA | 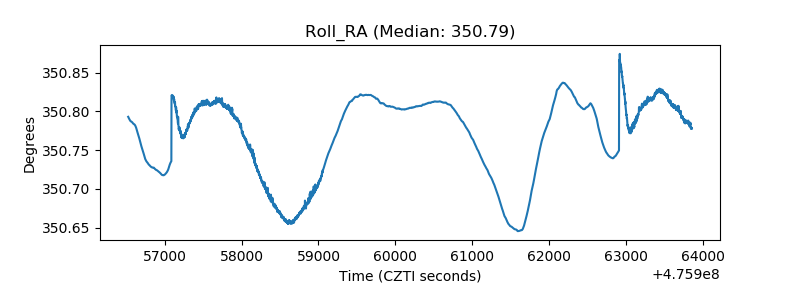 |
| Veto Counter | 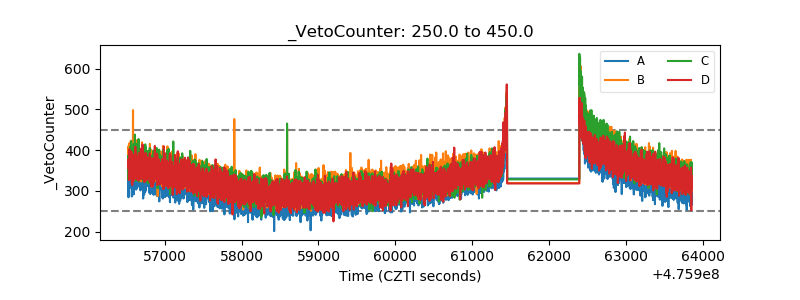 |