| Param | Original file | Final file |
|---|---|---|
| Filename | modeM0/AS1T05_239T01_9000006444_50534cztM0_level2.fits | modeM0/AS1T05_239T01_9000006444_50534cztM0_level2_quad_clean.evt |
| Size (bytes) | 599,391,360 | 93,977,280 |
| Size | 571.6 MB | 89.6 MB |
| Events in quadrant A | 4,248,595 | 639,372 |
| Events in quadrant B | 7,545,488 | 551,879 |
| Events in quadrant C | 5,003,105 | 611,268 |
| Events in quadrant D | 4,862,413 | 568,533 |
| Mode M0 | |||
|---|---|---|---|
| Quadrant | BADHDUFLAG | Total packets | Discarded packets |
| A | 0 | 17078 | 2 |
| B | 0 | 27140 | 3 |
| C | 0 | 19538 | 2 |
| D | 0 | 19287 | 2 |
| Mode M9 | |||
|---|---|---|---|
| Quadrant | BADHDUFLAG | Total packets | Discarded packets |
| A | 0 | 13 | 0 |
| B | 0 | 14 | 0 |
| C | 0 | 14 | 0 |
| D | 0 | 14 | 0 |
| Mode SS | |||
|---|---|---|---|
| Quadrant | BADHDUFLAG | Total packets | Discarded packets |
| A | 0 | 138 | 0 |
| B | 0 | 138 | 0 |
| C | 0 | 138 | 0 |
| D | 0 | 138 | 0 |
| Quadrant | Total seconds | Saturated seconds | Saturation percentage |
|---|---|---|---|
| A | 6807 | 183 | 2.688409% |
| B | 6806 | 1614 | 23.714370% |
| C | 6806 | 290 | 4.260946% |
| D | 6806 | 328 | 4.819277% |
Noise dominated data is calculated using 1-second bins in cleaned event files. If a bin has >2000 counts, and if more than 50% of those come from <1% of pixels, then it is considered to be noise-dominated and hence unusable.
| Quadrant | # 1 sec bins | Bins with >0 counts | Bins with >2000 counts | High rate bins dominated by noise | Noise dominated (total time) | Noise dominated (detector-on time) | Marked lightcurve |
|---|---|---|---|---|---|---|---|
| A | 7877 | 6808 | 118 | 118 | 1.50% | 1.73% | 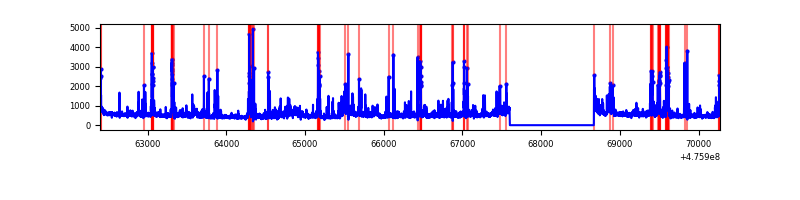 |
| B | 7876 | 6807 | 1123 | 1123 | 14.26% | 16.50% | 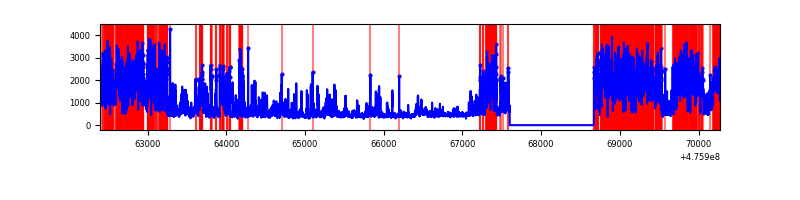 |
| C | 7876 | 6807 | 232 | 232 | 2.95% | 3.41% | 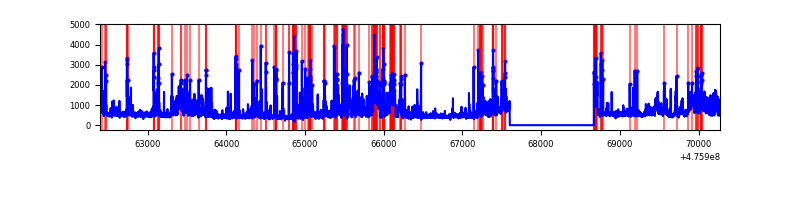 |
| D | 7876 | 6807 | 239 | 239 | 3.03% | 3.51% | 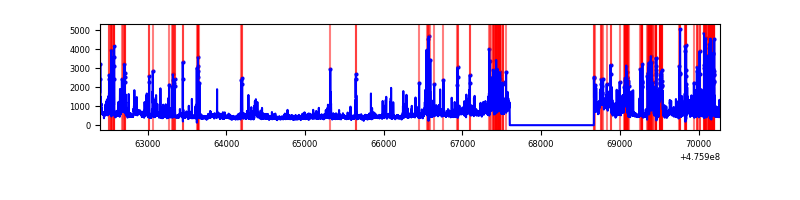 |
Top three noisy pixels from each quadrant. If the there are fewer than three noisy pixels in the level2.evt file, extra rows are filled as -1
| Pixel properties | Quadrant properties | ||||||
|---|---|---|---|---|---|---|---|
| Quadrant | DetID | PixID | Counts | Sigma | Mean | Median | Sigma |
| A | 4 | 3 | 234747 | 1287.93 | 726 | 708 | 181.7 |
| A | 5 | 240 | 127624 | 698.43 | 726 | 708 | 181.7 |
| A | 4 | 249 | 122831 | 672.05 | 726 | 708 | 181.7 |
| B | 7 | 0 | 3480486 | 24411.76 | 665 | 643 | 142.5 |
| B | 4 | 170 | 1089417 | 7637.96 | 665 | 643 | 142.5 |
| B | 0 | 229 | 68688 | 477.35 | 665 | 643 | 142.5 |
| C | 12 | 252 | 379220 | 1901.7 | 714 | 708 | 199.0 |
| C | 13 | 3 | 299579 | 1501.57 | 714 | 708 | 199.0 |
| C | 15 | 232 | 237837 | 1191.37 | 714 | 708 | 199.0 |
| D | 8 | 246 | 508138 | 2611.08 | 700 | 678 | 194.3 |
| D | 15 | 79 | 288888 | 1482.95 | 700 | 678 | 194.3 |
| D | 6 | 42 | 237710 | 1219.62 | 700 | 678 | 194.3 |
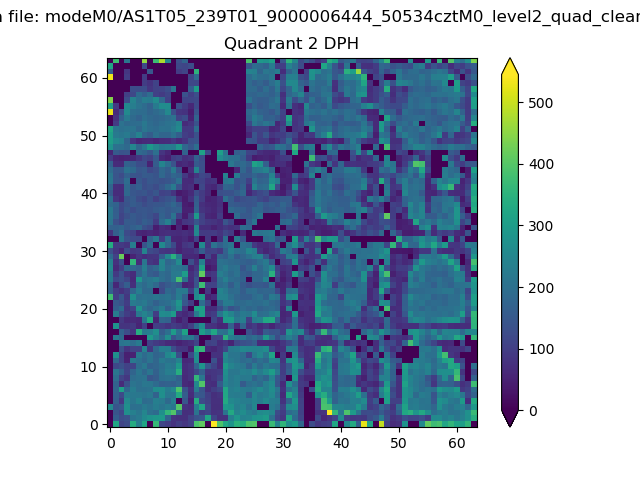
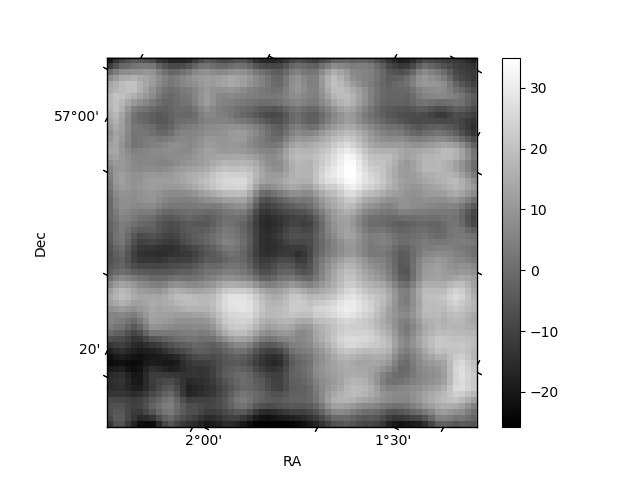
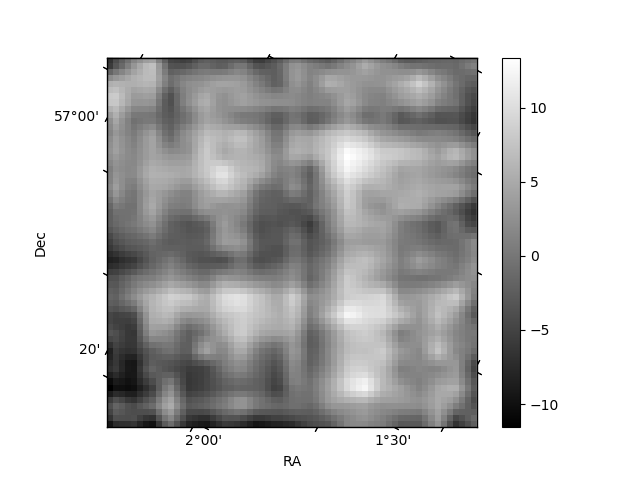
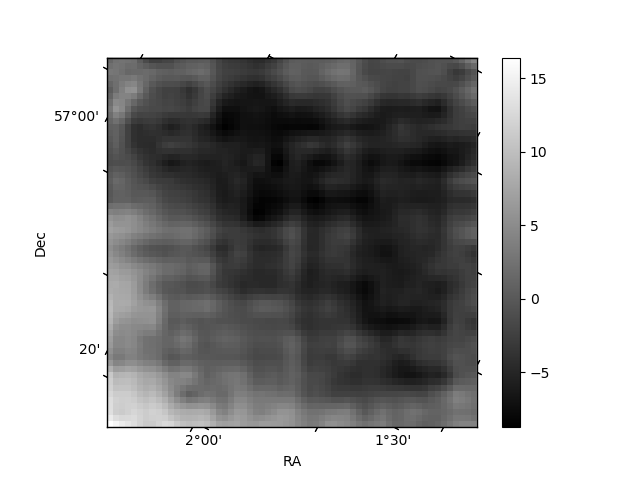
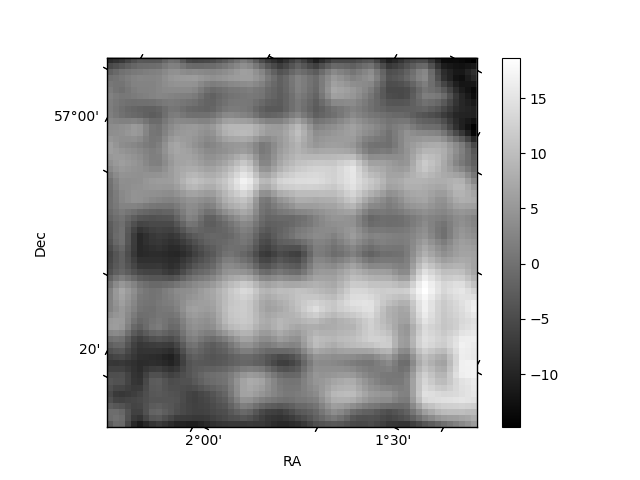
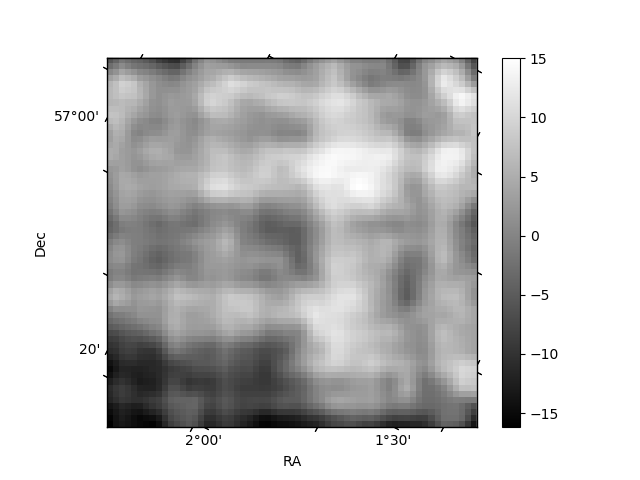
Histogram calculated using DETX and DETY for each event in the final _common_clean file
| Quadrant A | 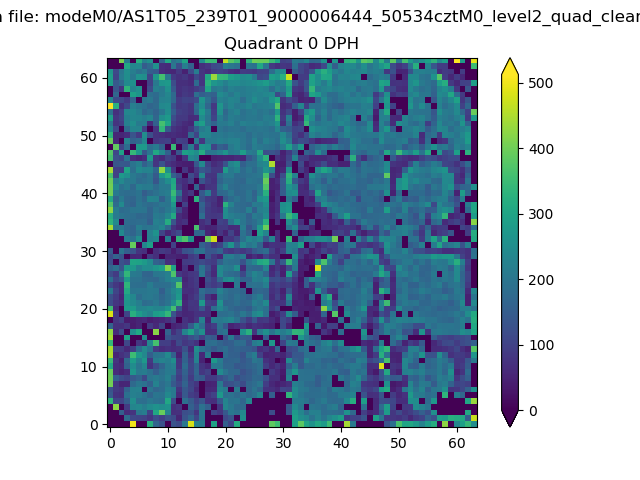 |
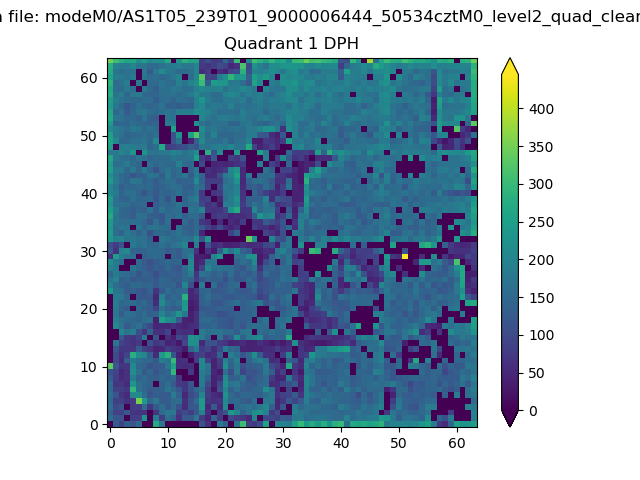 |
Quadrant B |
|---|---|---|---|
| Quadrant D | 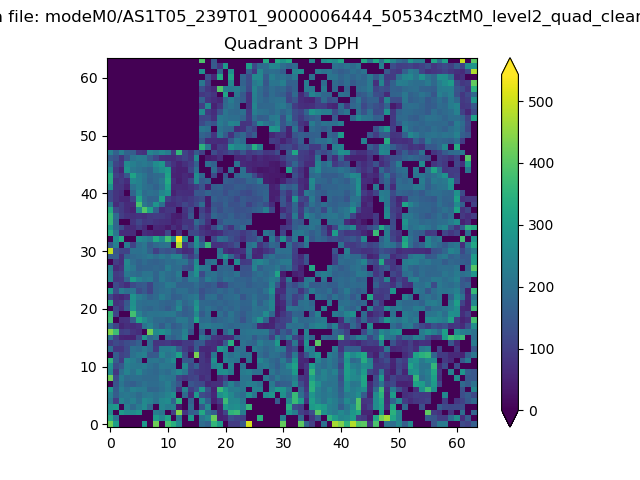 |
 |
Quadrant C |
| Plot type | Count rate plots | Images |
|---|---|---|
| Comparison with Poisson distribution Blue bars denote a histogram of data divided into 1 sec bins. Red curve is a Poisson curve with rate = median count rate of data. |
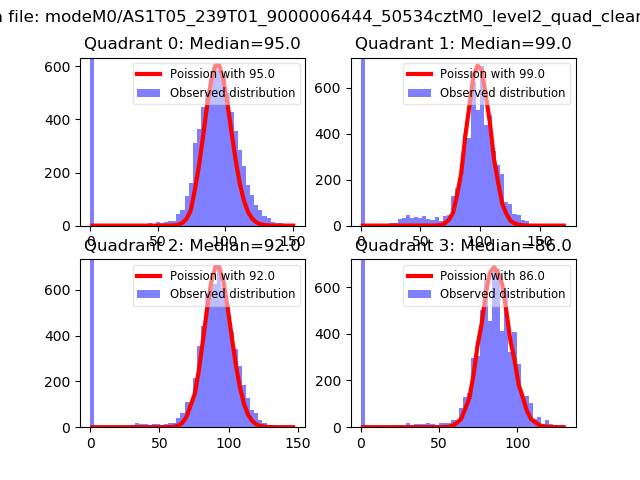 |
 |
| Quadrant-wise count rates Data is divided into 100 sec bins |
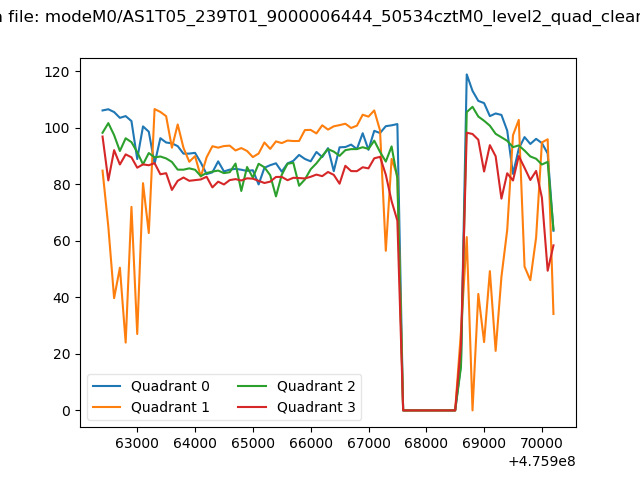 |
|
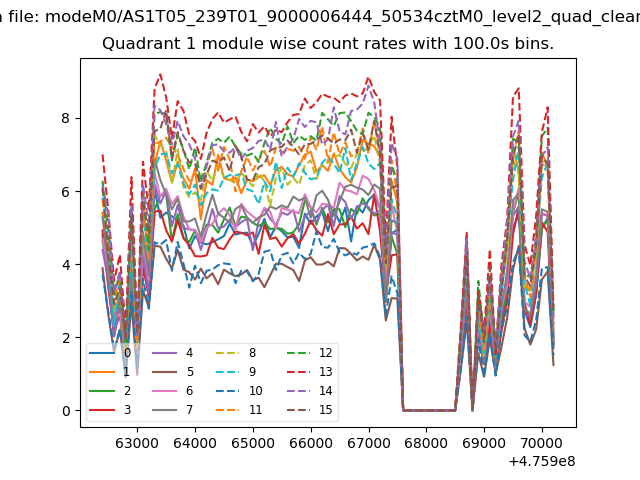
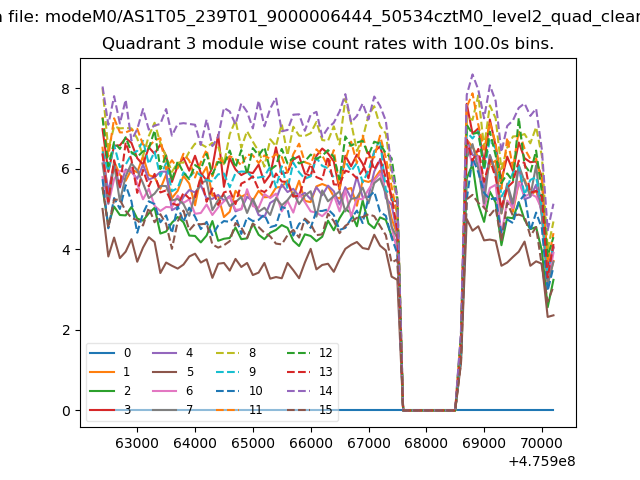
| Module-wise count rates for Quadrant A Data is divided into 100 sec bins |
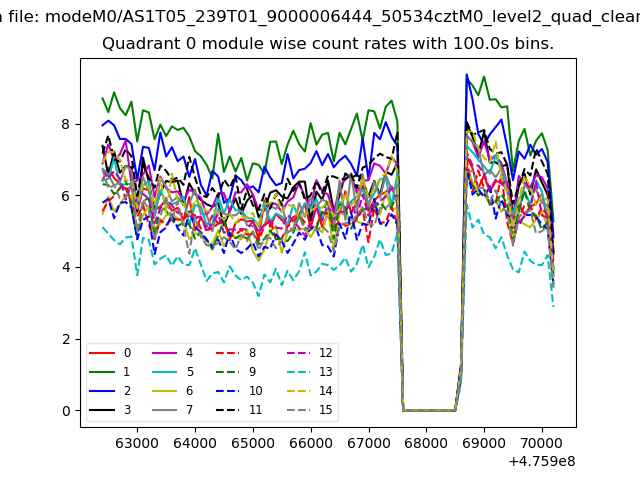 |
 |
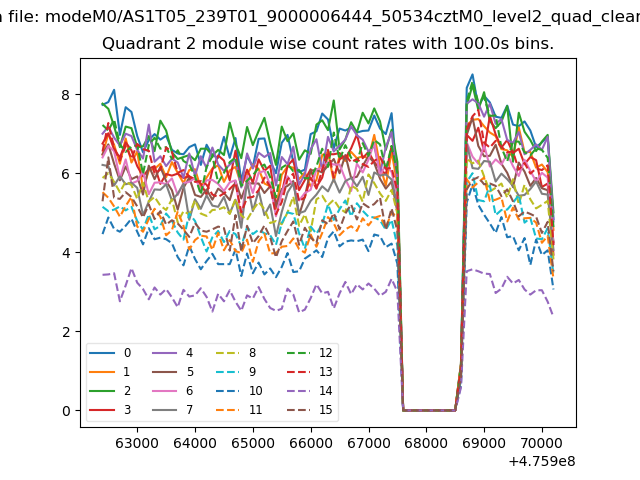
| Module-wise count rates for Quadrant B Data is divided into 100 sec bins |
 |
 |
| Module-wise count rates for Quadrant C Data is divided into 100 sec bins |
 |
 |
| Module-wise count rates for Quadrant D Data is divided into 100 sec bins |
 |
 |
| Parameter | Plot |
|---|---|
| CZT HV Monitor | 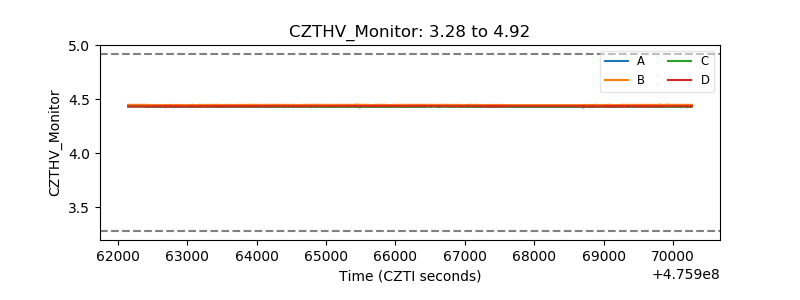 |
| D_VDD | 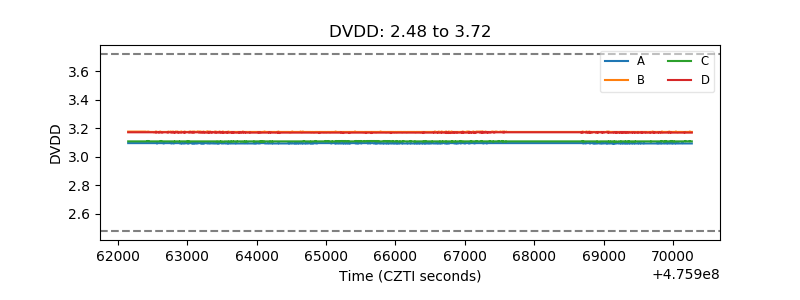 |
| Temperature 1 | 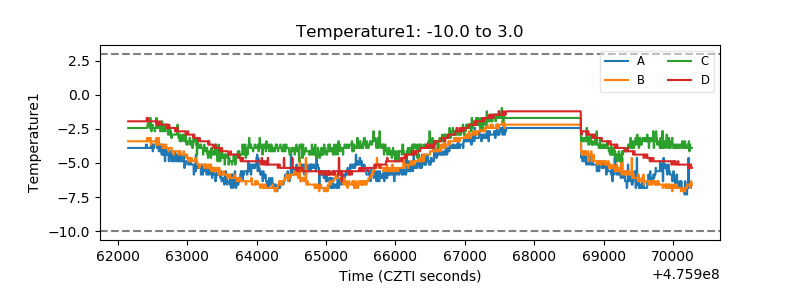 |
| Veto HV Monitor | 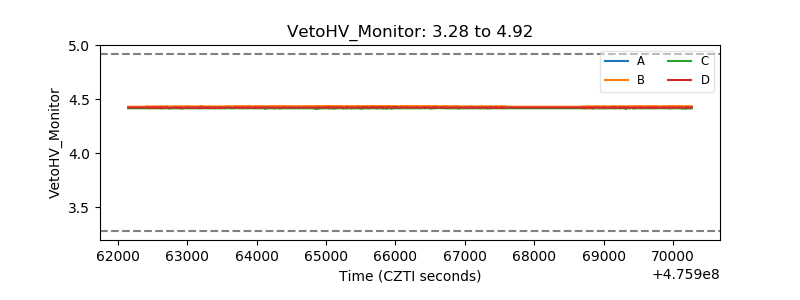 |
| Veto LLD |  |
| Alpha Counter | 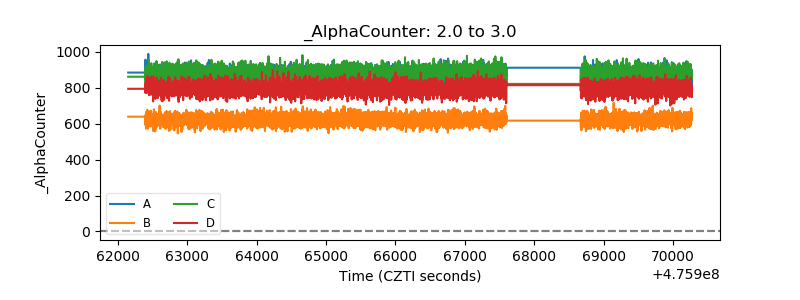 |
| _CPM_Rate | 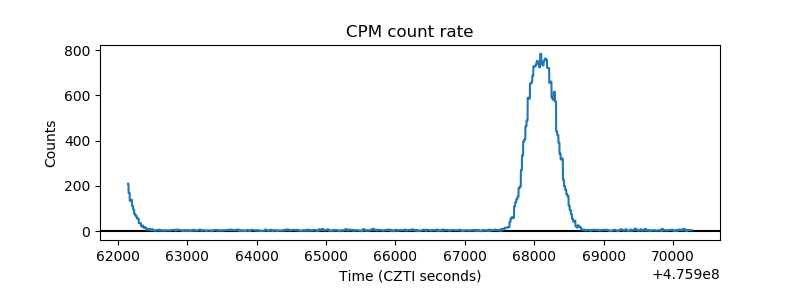 |
| CZT Counter | 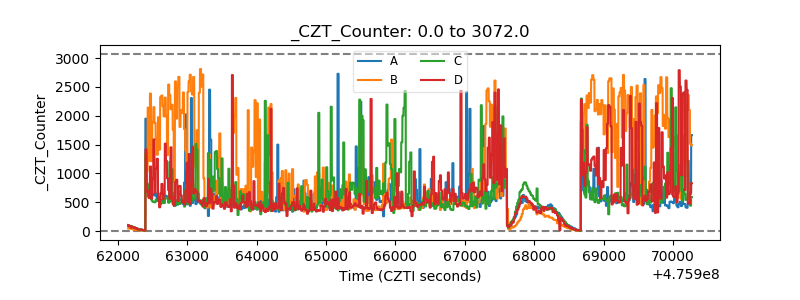 |
| +2.5 Volts monitor | 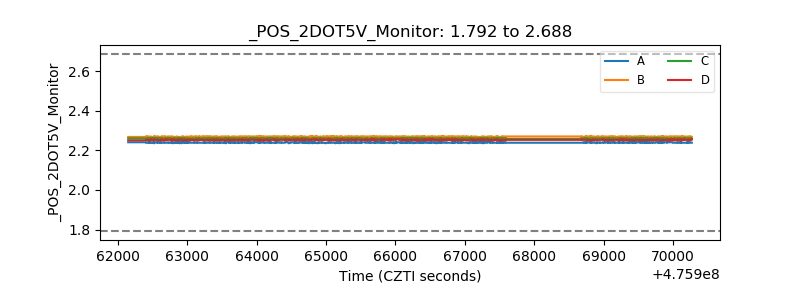 |
| +5 Volts monitor |  |
| _ROLL_ROT | 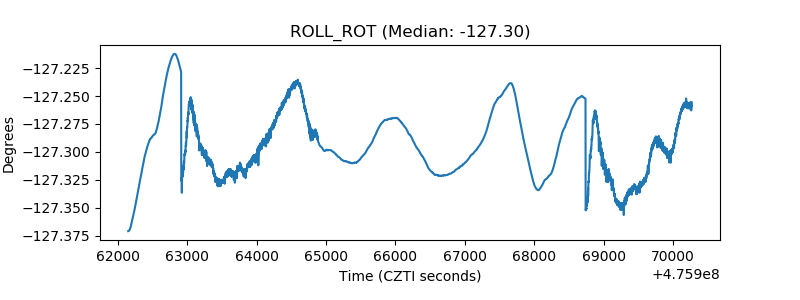 |
| _Roll_DEC | 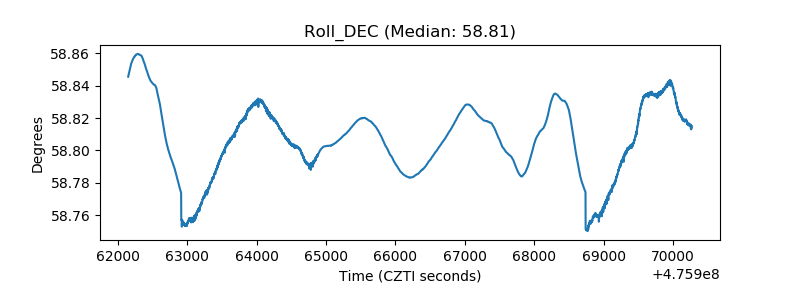 |
| _Roll_RA | 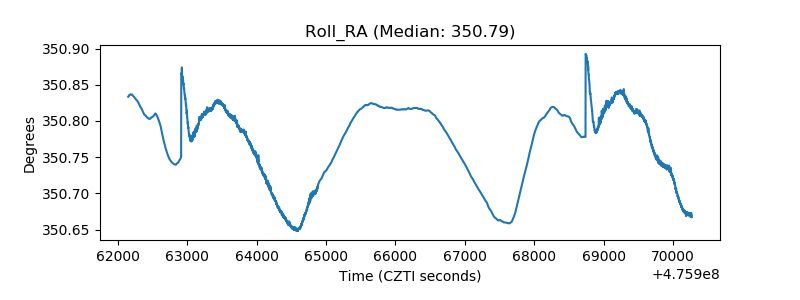 |
| Veto Counter | 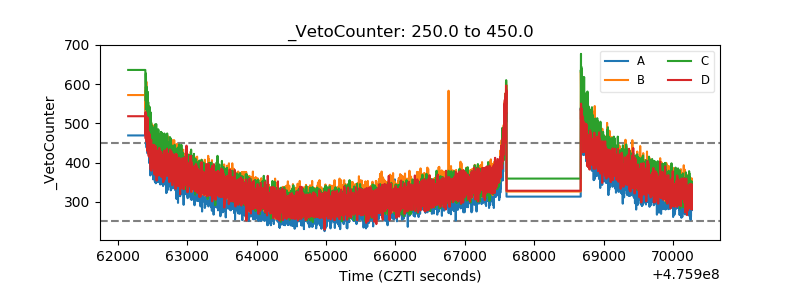 |