| Param | Original file | Final file |
|---|---|---|
| Filename | modeM0/AS1T05_239T01_9000006444_50535cztM0_level2.fits | modeM0/AS1T05_239T01_9000006444_50535cztM0_level2_quad_clean.evt |
| Size (bytes) | 648,149,760 | 92,183,040 |
| Size | 618.1 MB | 87.9 MB |
| Events in quadrant A | 4,197,692 | 632,729 |
| Events in quadrant B | 6,762,672 | 585,712 |
| Events in quadrant C | 6,524,010 | 575,891 |
| Events in quadrant D | 6,001,175 | 540,256 |
| Mode M0 | |||
|---|---|---|---|
| Quadrant | BADHDUFLAG | Total packets | Discarded packets |
| A | 0 | 16726 | 2 |
| B | 0 | 24607 | 2 |
| C | 0 | 23905 | 2 |
| D | 0 | 22437 | 7 |
| Mode M9 | |||
|---|---|---|---|
| Quadrant | BADHDUFLAG | Total packets | Discarded packets |
| A | 0 | 18 | 0 |
| B | 0 | 19 | 0 |
| C | 0 | 19 | 0 |
| D | 0 | 19 | 0 |
| Mode SS | |||
|---|---|---|---|
| Quadrant | BADHDUFLAG | Total packets | Discarded packets |
| A | 0 | 132 | 0 |
| B | 0 | 132 | 0 |
| C | 0 | 132 | 0 |
| D | 0 | 132 | 0 |
| Quadrant | Total seconds | Saturated seconds | Saturation percentage |
|---|---|---|---|
| A | 6547 | 168 | 2.566061% |
| B | 6547 | 1226 | 18.726134% |
| C | 6547 | 624 | 9.531083% |
| D | 6546 | 616 | 9.410327% |
Noise dominated data is calculated using 1-second bins in cleaned event files. If a bin has >2000 counts, and if more than 50% of those come from <1% of pixels, then it is considered to be noise-dominated and hence unusable.
| Quadrant | # 1 sec bins | Bins with >0 counts | Bins with >2000 counts | High rate bins dominated by noise | Noise dominated (total time) | Noise dominated (detector-on time) | Marked lightcurve |
|---|---|---|---|---|---|---|---|
| A | 7717 | 6548 | 102 | 102 | 1.32% | 1.56% | 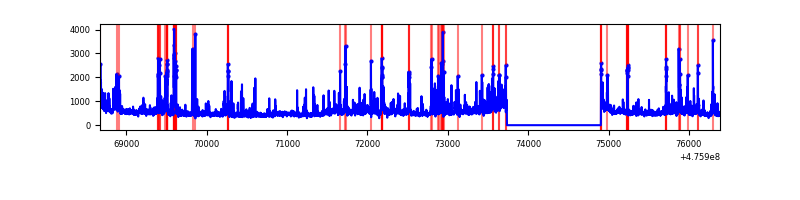 |
| B | 7717 | 6548 | 846 | 846 | 10.96% | 12.92% | 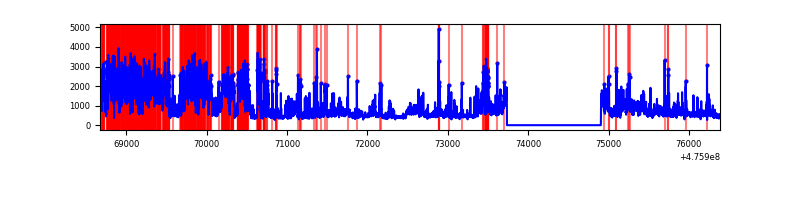 |
| C | 7717 | 6548 | 448 | 448 | 5.81% | 6.84% | 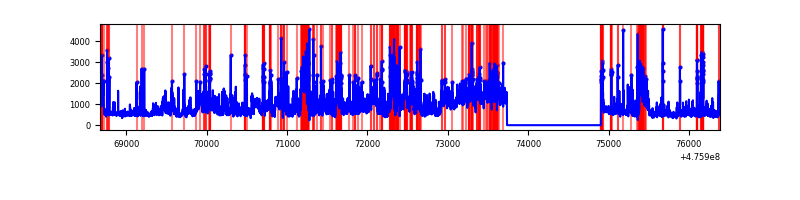 |
| D | 7716 | 6547 | 514 | 514 | 6.66% | 7.85% | 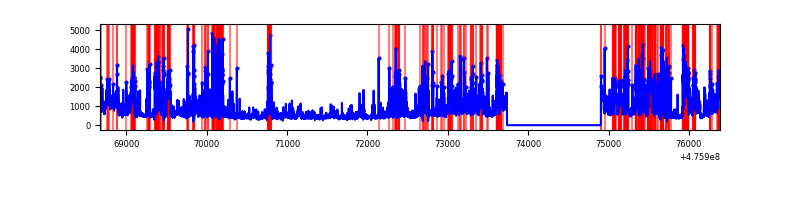 |
Top three noisy pixels from each quadrant. If the there are fewer than three noisy pixels in the level2.evt file, extra rows are filled as -1
| Pixel properties | Quadrant properties | ||||||
|---|---|---|---|---|---|---|---|
| Quadrant | DetID | PixID | Counts | Sigma | Mean | Median | Sigma |
| A | 4 | 3 | 271099 | 1543.13 | 709 | 691 | 175.2 |
| A | 12 | 250 | 174576 | 992.31 | 709 | 691 | 175.2 |
| A | 3 | 130 | 149658 | 850.11 | 709 | 691 | 175.2 |
| B | 4 | 170 | 1911912 | 13370.57 | 667 | 645 | 142.9 |
| B | 7 | 0 | 1690556 | 11822.04 | 667 | 645 | 142.9 |
| B | 8 | 128 | 137322 | 956.15 | 667 | 645 | 142.9 |
| C | 15 | 212 | 985165 | 5218.99 | 680 | 674 | 188.6 |
| C | 3 | 233 | 559919 | 2964.67 | 680 | 674 | 188.6 |
| C | 15 | 234 | 313551 | 1658.63 | 680 | 674 | 188.6 |
| D | 8 | 246 | 1629289 | 8611.75 | 670 | 645 | 189.1 |
| D | 12 | 128 | 316604 | 1670.69 | 670 | 645 | 189.1 |
| D | 15 | 79 | 296066 | 1562.09 | 670 | 645 | 189.1 |
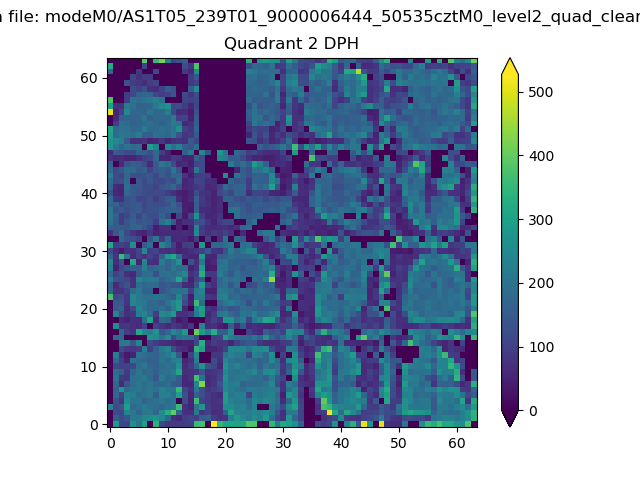
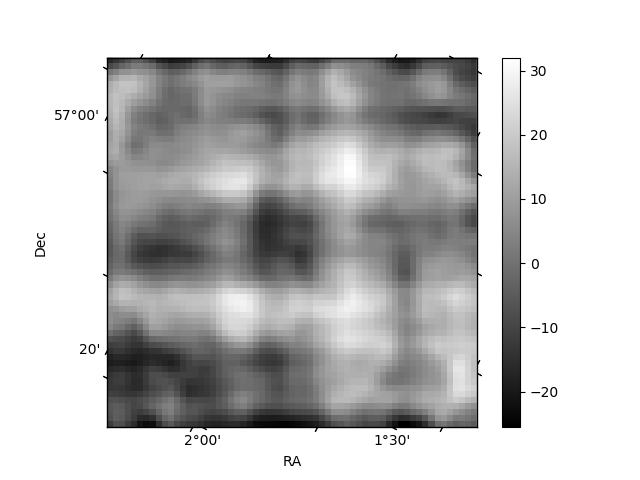
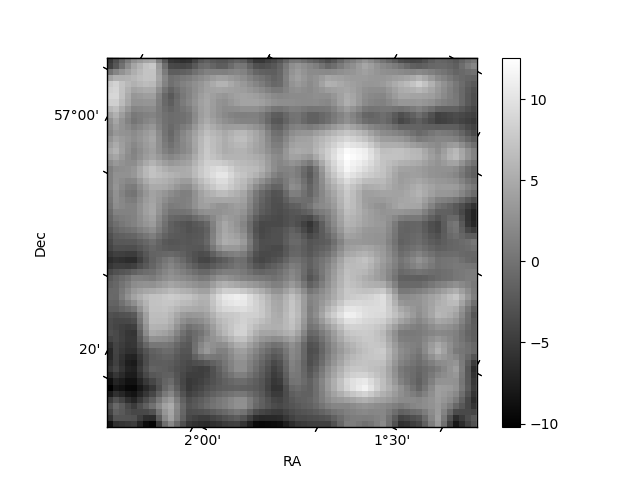
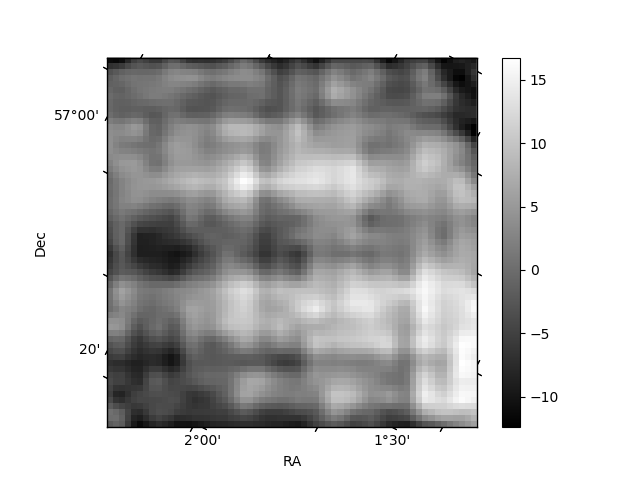
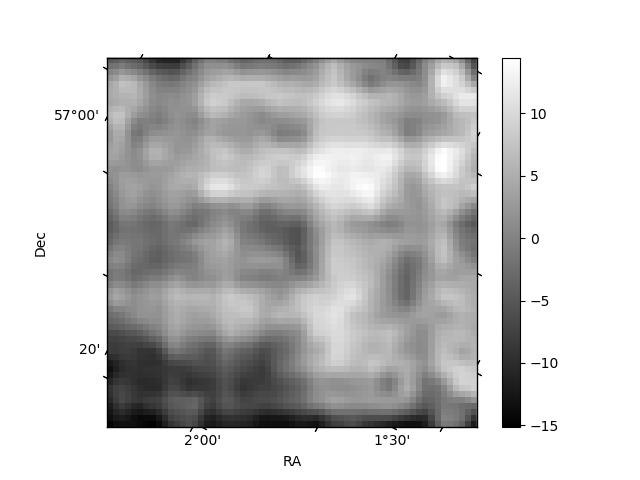
Histogram calculated using DETX and DETY for each event in the final _common_clean file
| Quadrant A | 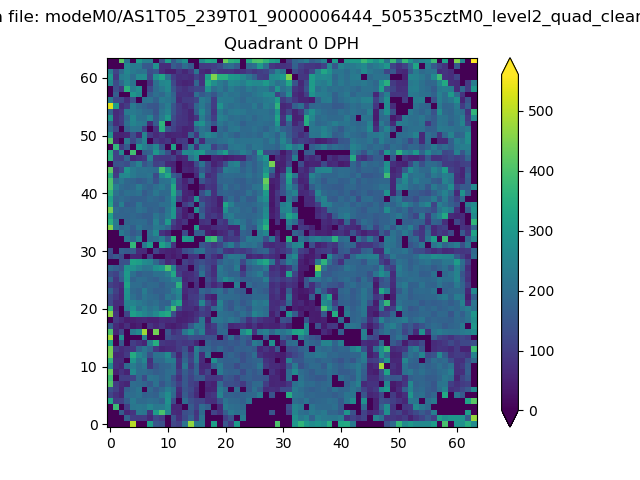 |
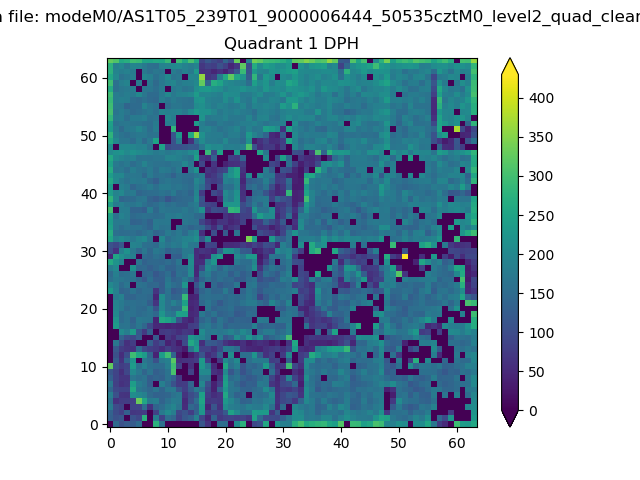 |
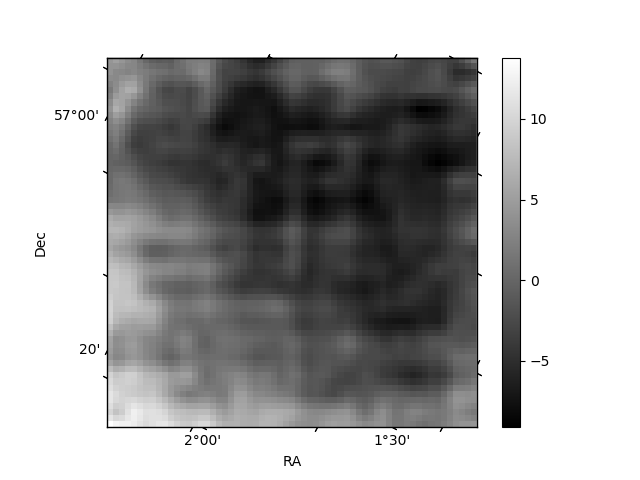
Quadrant B |
|---|---|---|---|
| Quadrant D | 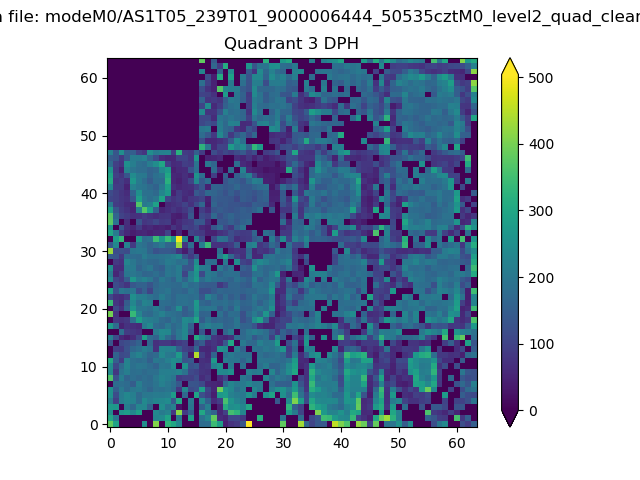 |
 |
Quadrant C |
| Plot type | Count rate plots | Images |
|---|---|---|
| Comparison with Poisson distribution Blue bars denote a histogram of data divided into 1 sec bins. Red curve is a Poisson curve with rate = median count rate of data. |
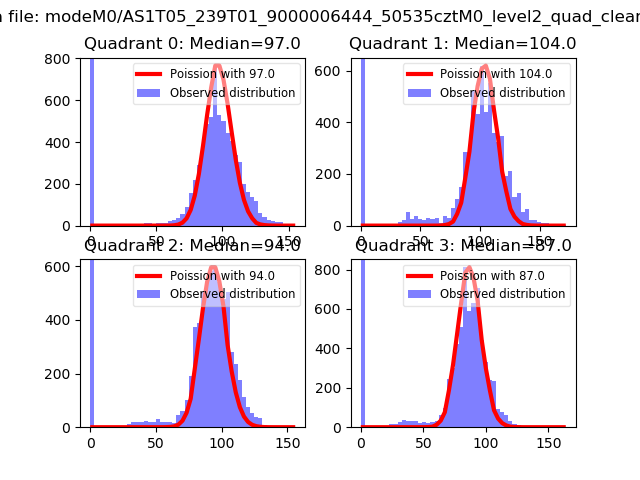 |
 |
| Quadrant-wise count rates Data is divided into 100 sec bins |
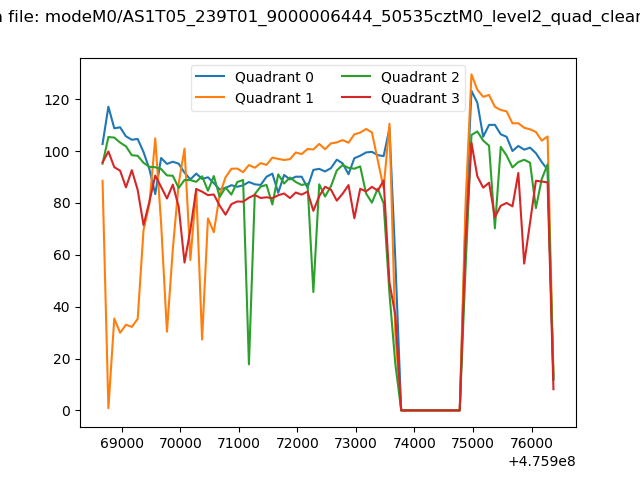 |
|
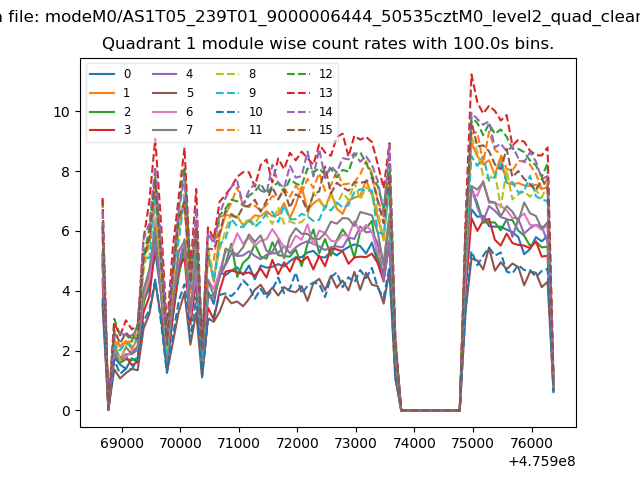
| Module-wise count rates for Quadrant A Data is divided into 100 sec bins |
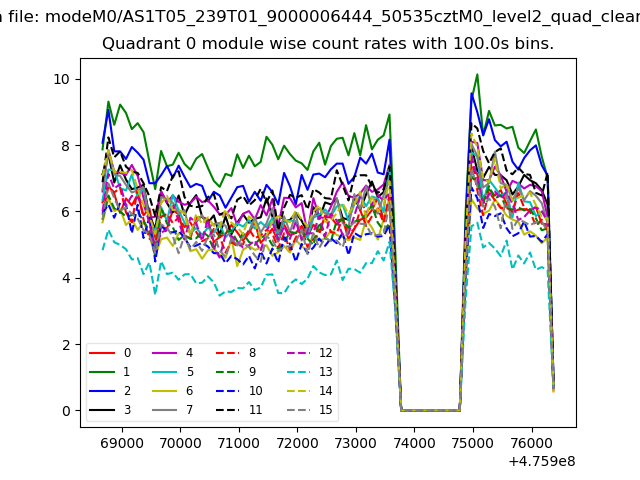 |
 |
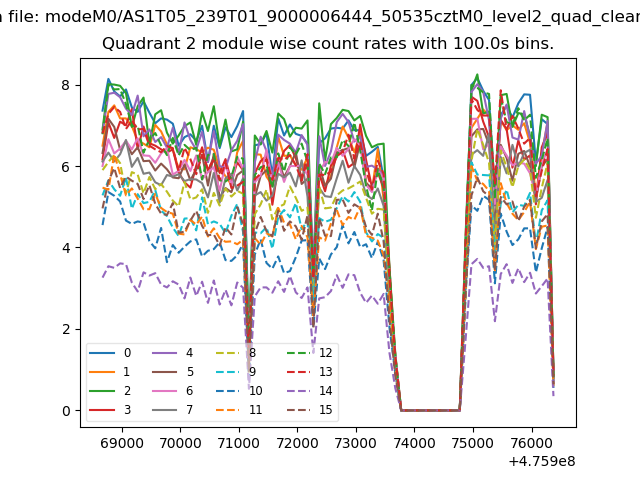
| Module-wise count rates for Quadrant B Data is divided into 100 sec bins |
 |
 |
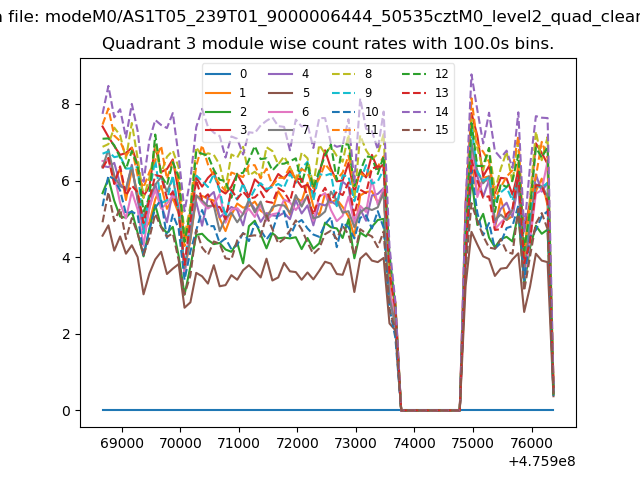
| Module-wise count rates for Quadrant C Data is divided into 100 sec bins |
 |
 |
| Module-wise count rates for Quadrant D Data is divided into 100 sec bins |
 |
 |
| Parameter | Plot |
|---|---|
| CZT HV Monitor | 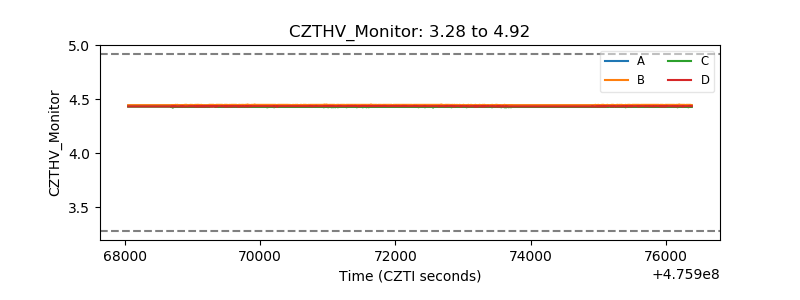 |
| D_VDD | 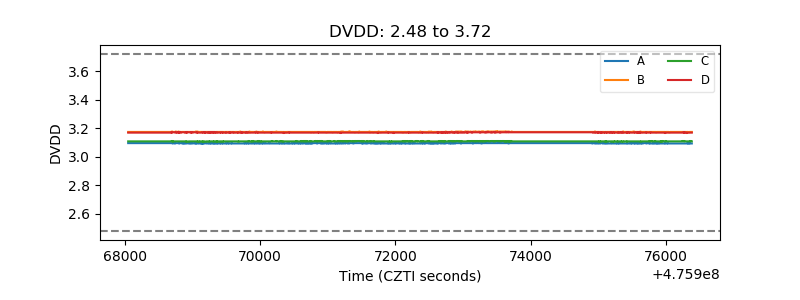 |
| Temperature 1 | 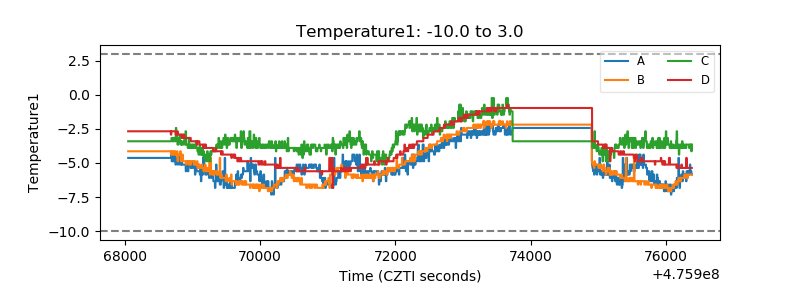 |
| Veto HV Monitor | 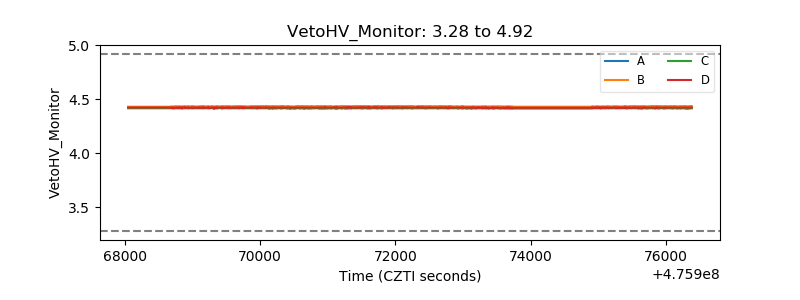 |
| Veto LLD | 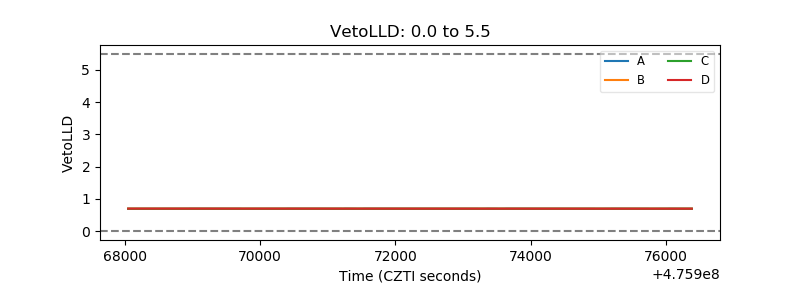 |
| Alpha Counter | 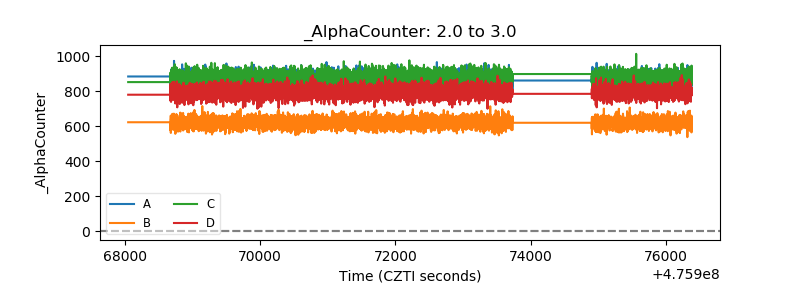 |
| _CPM_Rate | 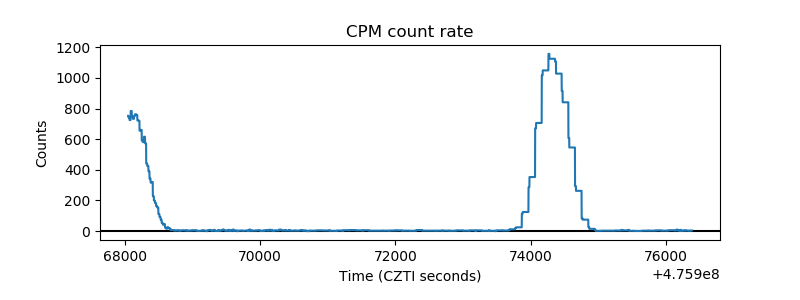 |
| CZT Counter | 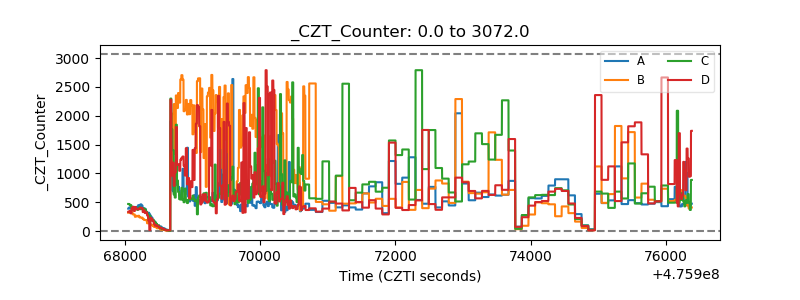 |
| +2.5 Volts monitor |  |
| +5 Volts monitor | 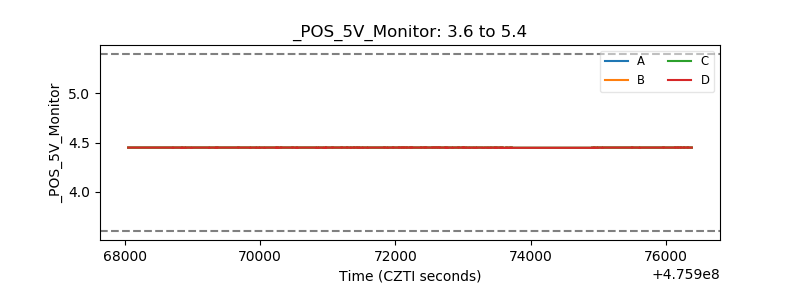 |
| _ROLL_ROT | 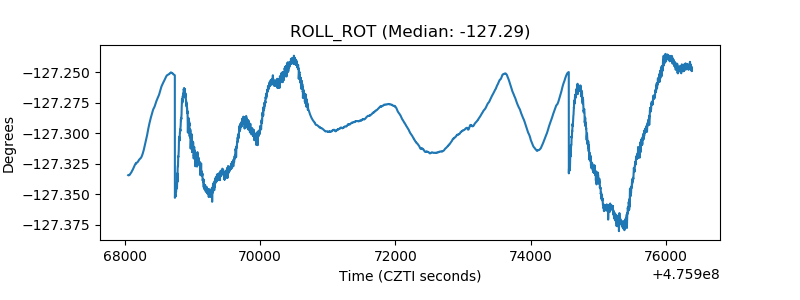 |
| _Roll_DEC | 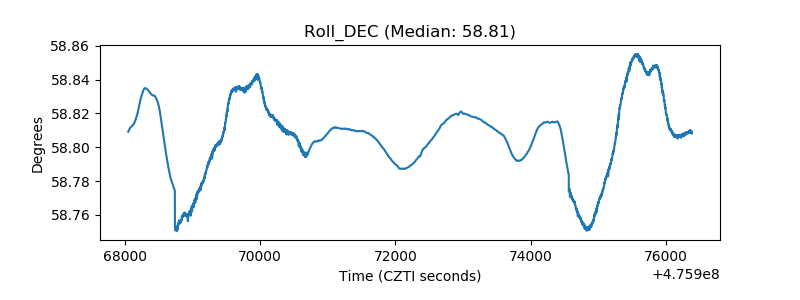 |
| _Roll_RA | 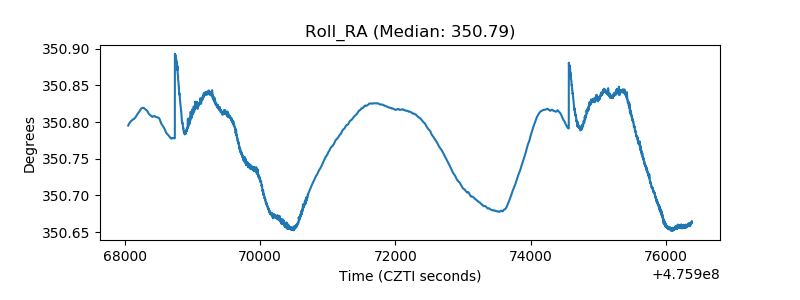 |
| Veto Counter | 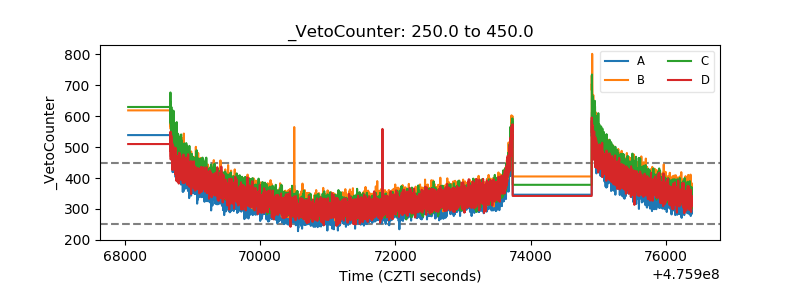 |