| Param | Original file | Final file |
|---|---|---|
| Filename | modeM0/AS1T05_239T01_9000006444_50536cztM0_level2.fits | modeM0/AS1T05_239T01_9000006444_50536cztM0_level2_quad_clean.evt |
| Size (bytes) | 604,284,480 | 95,927,040 |
| Size | 576.3 MB | 91.5 MB |
| Events in quadrant A | 4,093,983 | 638,825 |
| Events in quadrant B | 4,555,587 | 690,844 |
| Events in quadrant C | 7,520,653 | 562,213 |
| Events in quadrant D | 5,694,482 | 558,756 |
| Mode M0 | |||
|---|---|---|---|
| Quadrant | BADHDUFLAG | Total packets | Discarded packets |
| A | 0 | 16361 | 1 |
| B | 0 | 18003 | 1 |
| C | 0 | 26813 | 1 |
| D | 0 | 21529 | 1 |
| Mode M9 | |||
|---|---|---|---|
| Quadrant | BADHDUFLAG | Total packets | Discarded packets |
| A | 0 | 12 | 0 |
| B | 0 | 12 | 0 |
| C | 0 | 12 | 0 |
| D | 0 | 12 | 0 |
| Mode SS | |||
|---|---|---|---|
| Quadrant | BADHDUFLAG | Total packets | Discarded packets |
| A | 0 | 132 | 0 |
| B | 0 | 132 | 0 |
| C | 0 | 132 | 0 |
| D | 0 | 132 | 0 |
| Quadrant | Total seconds | Saturated seconds | Saturation percentage |
|---|---|---|---|
| A | 6509 | 149 | 2.289138% |
| B | 6509 | 292 | 4.486096% |
| C | 6510 | 944 | 14.500768% |
| D | 6510 | 495 | 7.603687% |
Noise dominated data is calculated using 1-second bins in cleaned event files. If a bin has >2000 counts, and if more than 50% of those come from <1% of pixels, then it is considered to be noise-dominated and hence unusable.
| Quadrant | # 1 sec bins | Bins with >0 counts | Bins with >2000 counts | High rate bins dominated by noise | Noise dominated (total time) | Noise dominated (detector-on time) | Marked lightcurve |
|---|---|---|---|---|---|---|---|
| A | 7724 | 6510 | 97 | 97 | 1.26% | 1.49% | 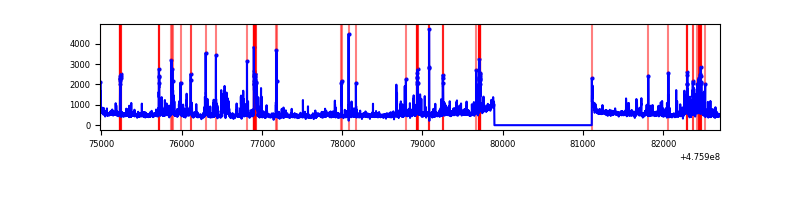 |
| B | 7724 | 6510 | 115 | 115 | 1.49% | 1.77% | 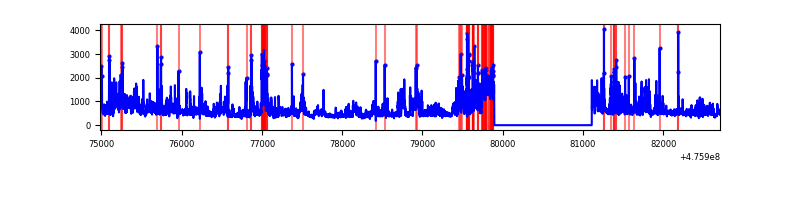 |
| C | 7725 | 6511 | 689 | 689 | 8.92% | 10.58% | 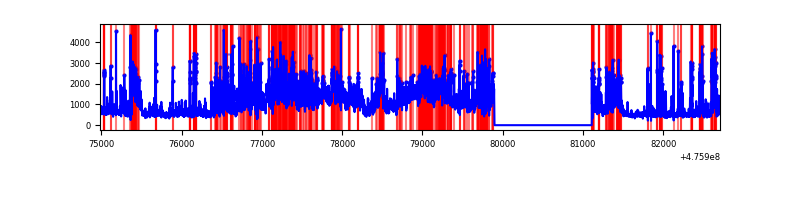 |
| D | 7725 | 6511 | 487 | 487 | 6.30% | 7.48% | 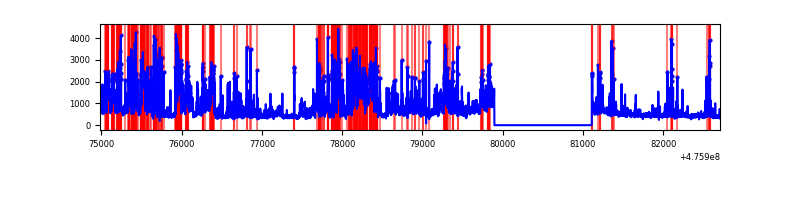 |
Top three noisy pixels from each quadrant. If the there are fewer than three noisy pixels in the level2.evt file, extra rows are filled as -1
| Pixel properties | Quadrant properties | ||||||
|---|---|---|---|---|---|---|---|
| Quadrant | DetID | PixID | Counts | Sigma | Mean | Median | Sigma |
| A | 8 | 247 | 238593 | 1350.41 | 711 | 695 | 176.2 |
| A | 12 | 250 | 196589 | 1111.98 | 711 | 695 | 176.2 |
| A | 4 | 3 | 188597 | 1066.61 | 711 | 695 | 176.2 |
| B | 4 | 170 | 1070994 | 7242.77 | 702 | 680 | 147.8 |
| B | 7 | 0 | 281179 | 1898.13 | 702 | 680 | 147.8 |
| B | 0 | 229 | 84503 | 567.23 | 702 | 680 | 147.8 |
| C | 15 | 174 | 1860568 | 10004.6 | 668 | 663 | 185.9 |
| C | 15 | 196 | 482030 | 2589.32 | 668 | 663 | 185.9 |
| C | 15 | 212 | 377866 | 2029.01 | 668 | 663 | 185.9 |
| D | 8 | 246 | 1623191 | 8553.35 | 673 | 649 | 189.7 |
| D | 2 | 249 | 355071 | 1868.36 | 673 | 649 | 189.7 |
| D | 12 | 128 | 297171 | 1563.14 | 673 | 649 | 189.7 |
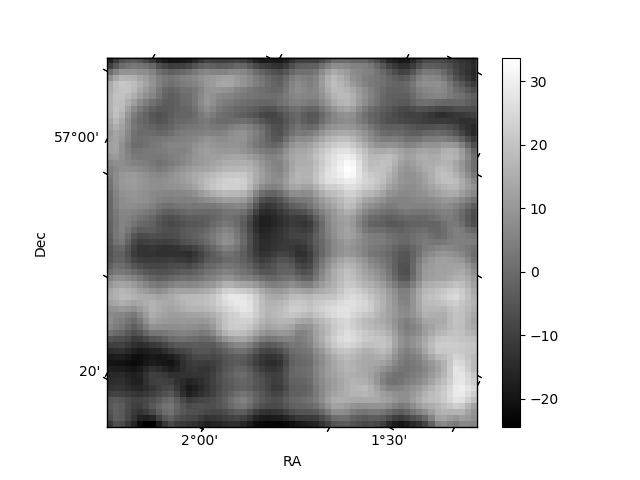
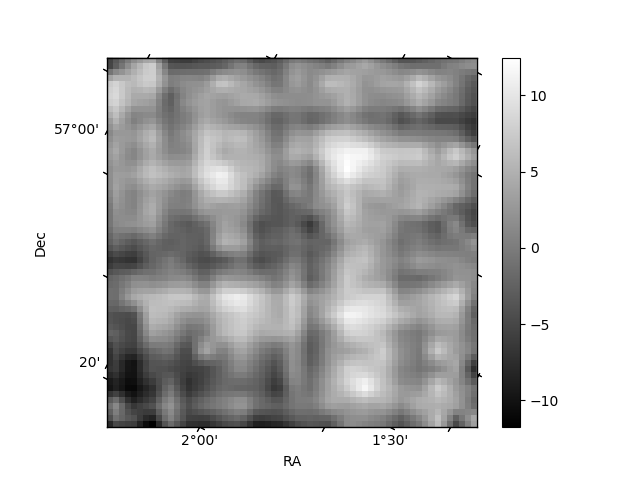
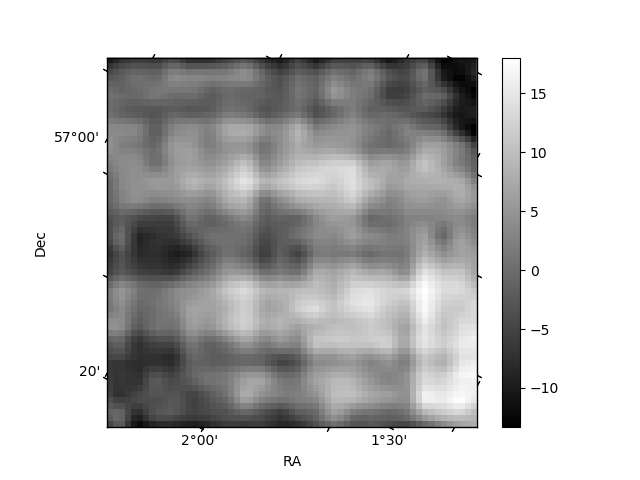
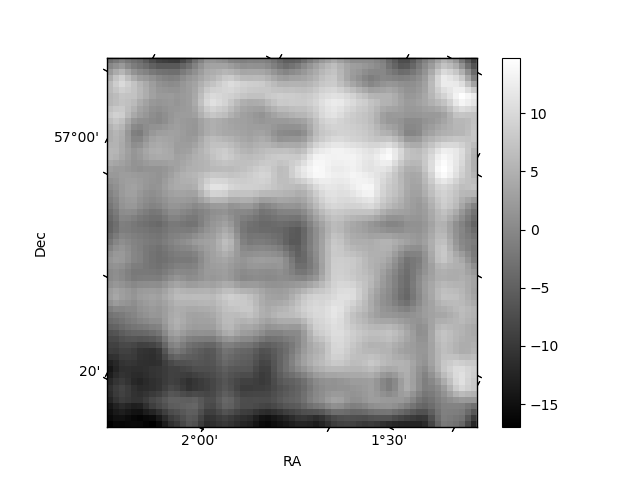
Histogram calculated using DETX and DETY for each event in the final _common_clean file
| Quadrant A | 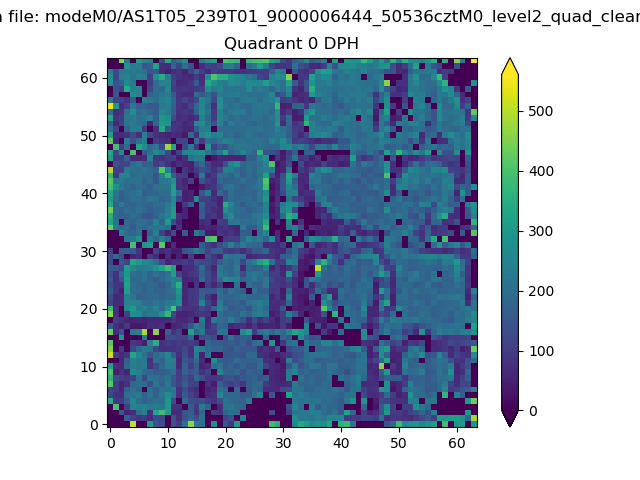 |
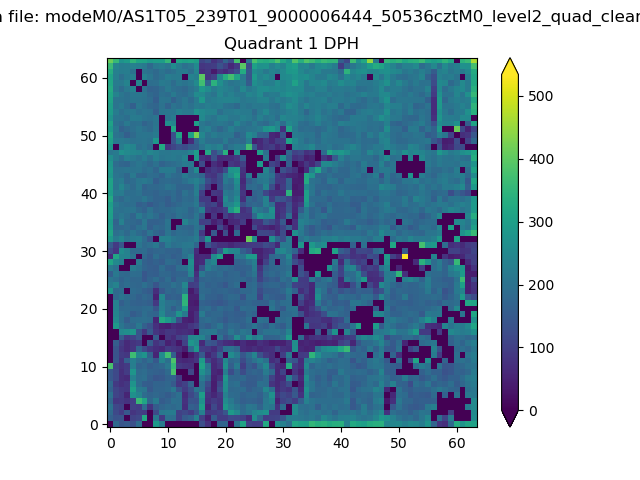 |
Quadrant B |
|---|---|---|---|
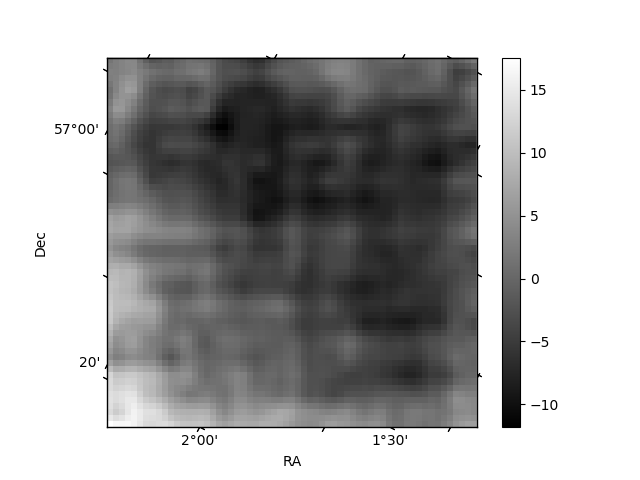
| Quadrant D | 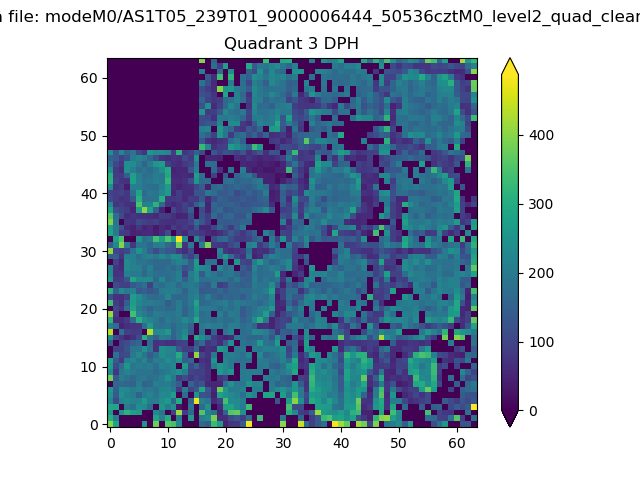 |
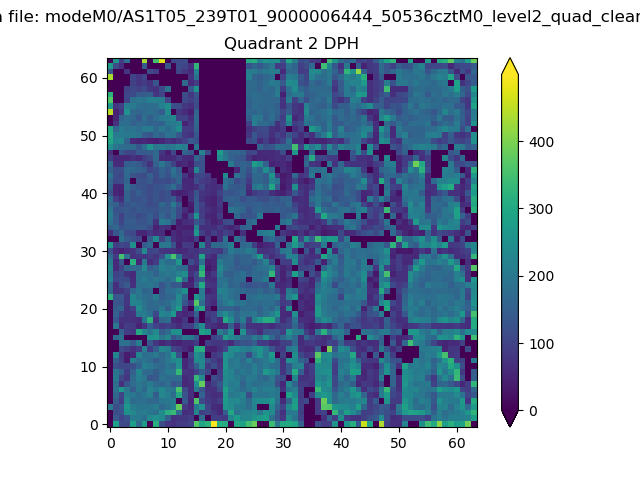 |
Quadrant C |
| Plot type | Count rate plots | Images |
|---|---|---|
| Comparison with Poisson distribution Blue bars denote a histogram of data divided into 1 sec bins. Red curve is a Poisson curve with rate = median count rate of data. |
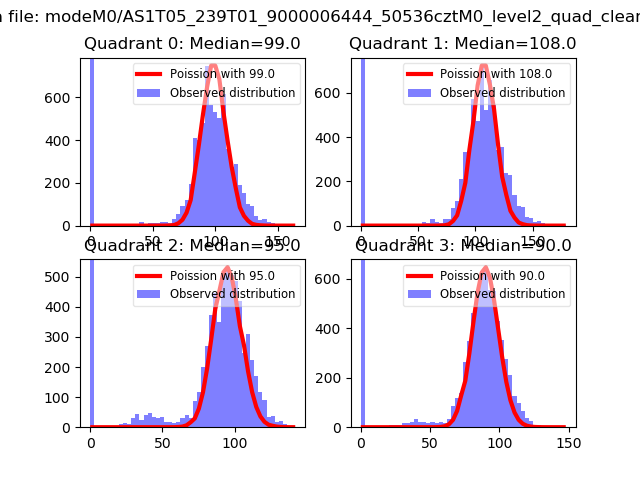 |
 |
| Quadrant-wise count rates Data is divided into 100 sec bins |
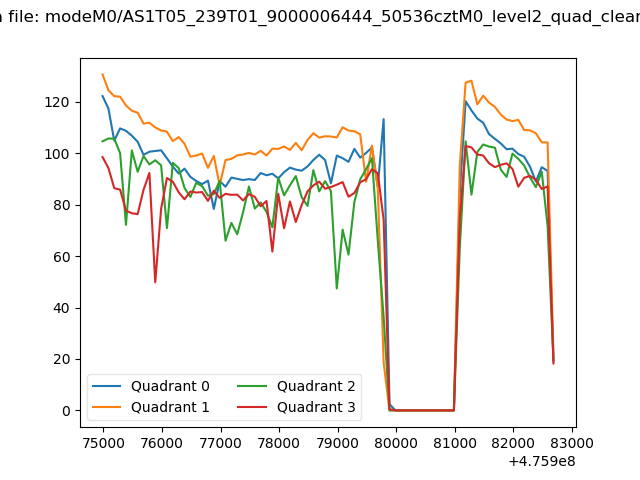 |
|
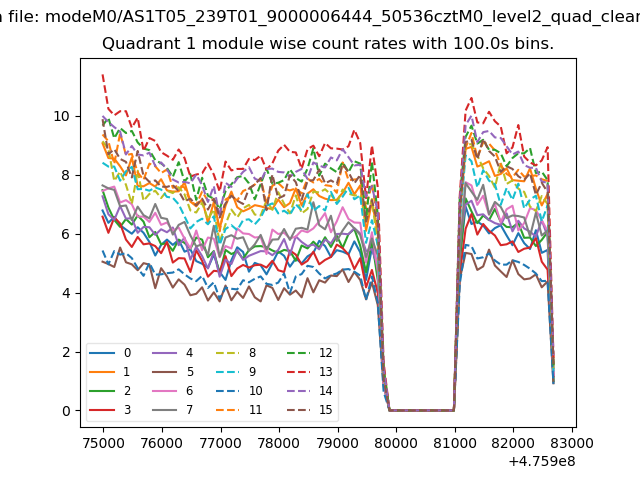
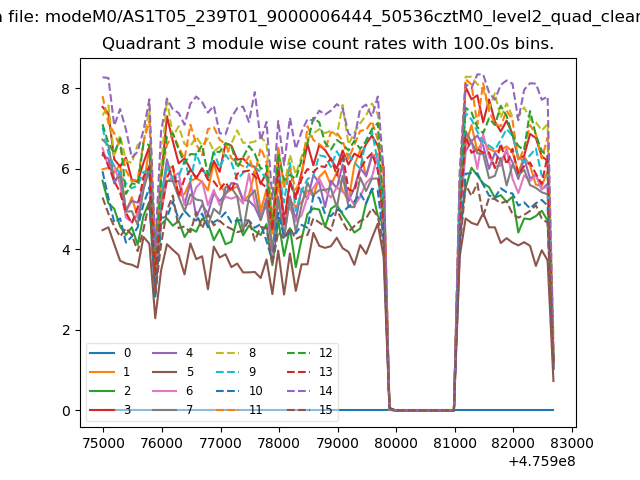
| Module-wise count rates for Quadrant A Data is divided into 100 sec bins |
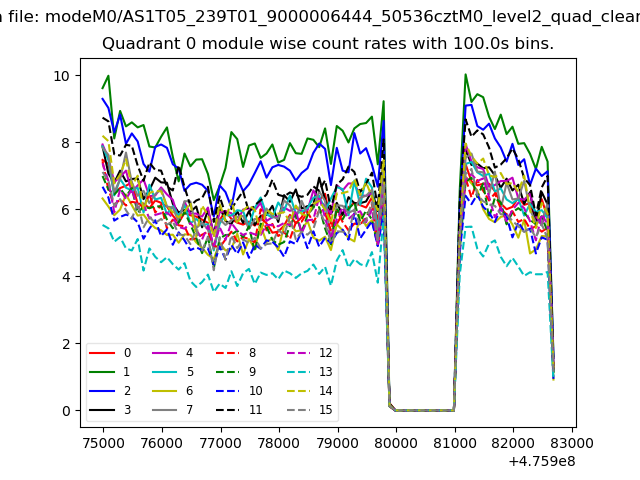 |
 |
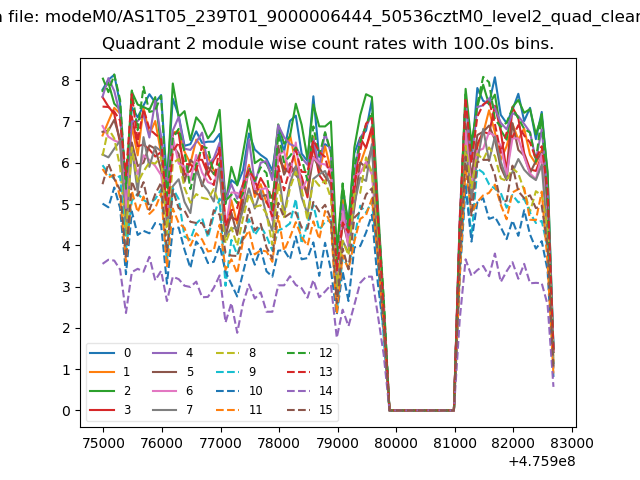
| Module-wise count rates for Quadrant B Data is divided into 100 sec bins |
 |
 |
| Module-wise count rates for Quadrant C Data is divided into 100 sec bins |
 |
 |
| Module-wise count rates for Quadrant D Data is divided into 100 sec bins |
 |
 |
| Parameter | Plot |
|---|---|
| CZT HV Monitor | 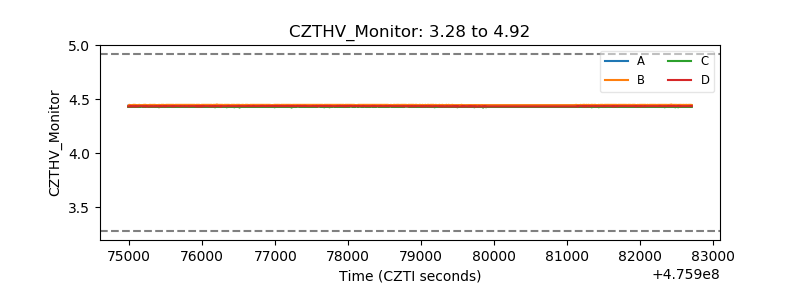 |
| D_VDD | 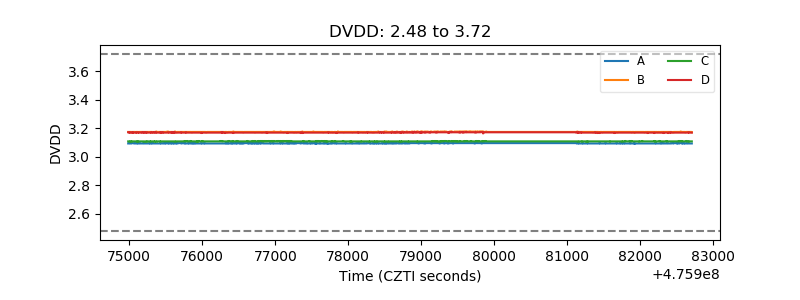 |
| Temperature 1 | 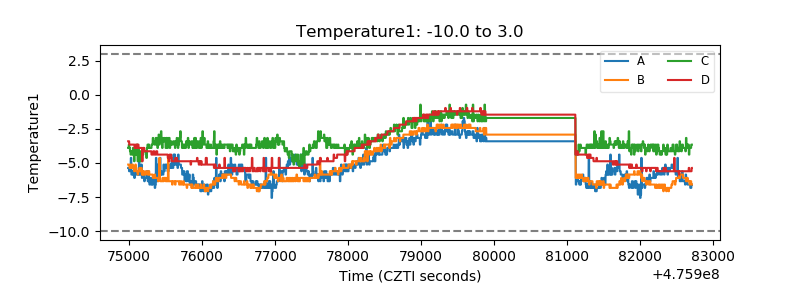 |
| Veto HV Monitor | 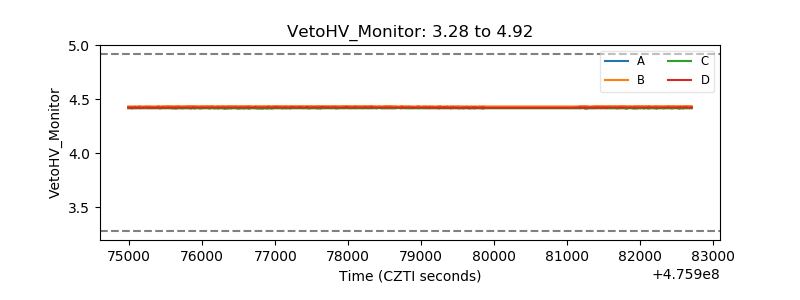 |
| Veto LLD | 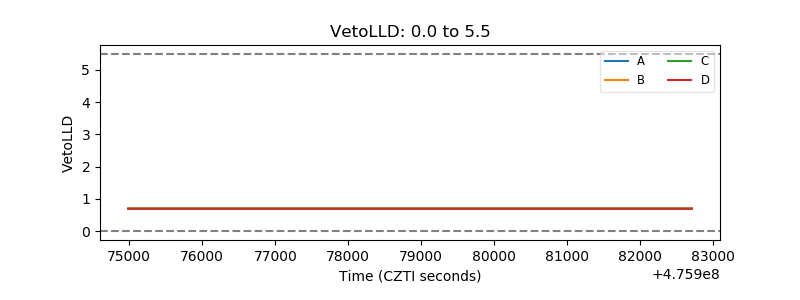 |
| Alpha Counter | 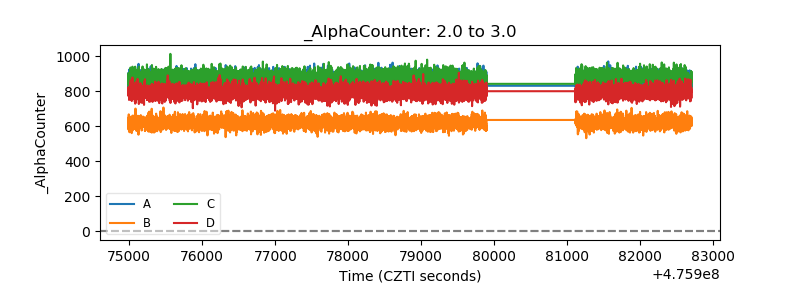 |
| _CPM_Rate | 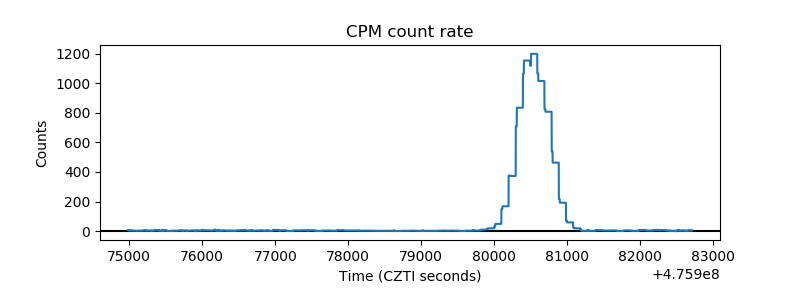 |
| CZT Counter | 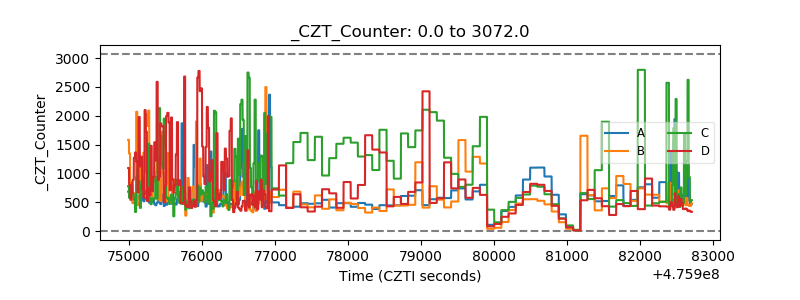 |
| +2.5 Volts monitor | 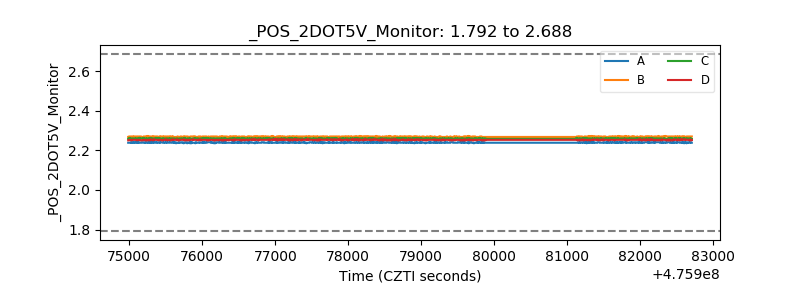 |
| +5 Volts monitor | 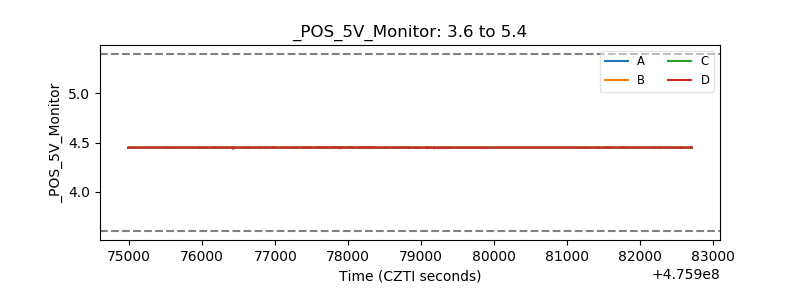 |
| _ROLL_ROT | 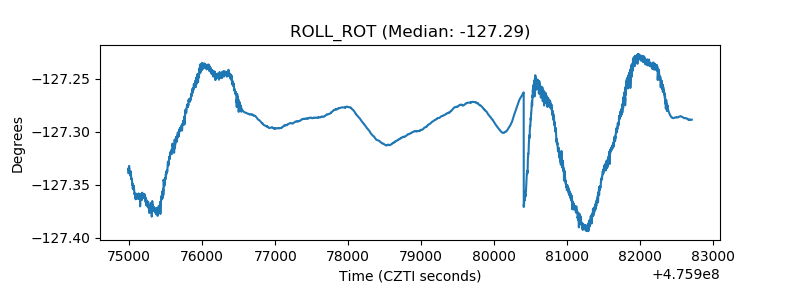 |
| _Roll_DEC | 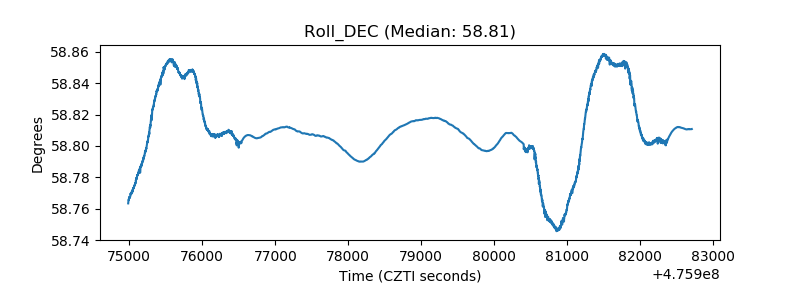 |
| _Roll_RA | 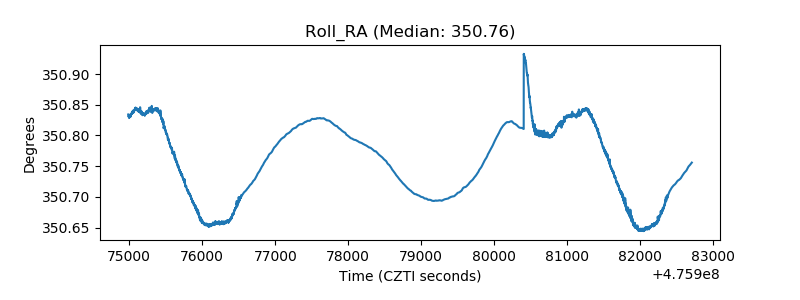 |
| Veto Counter | 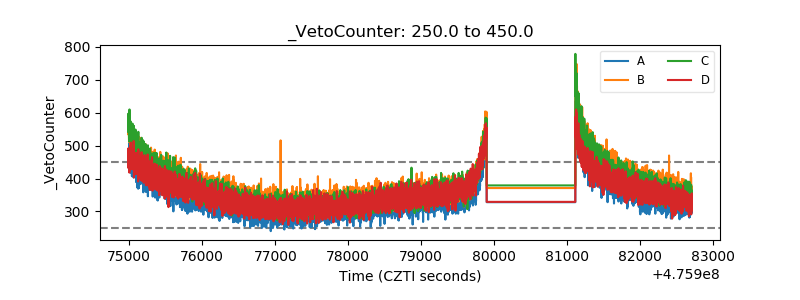 |