| Param | Original file | Final file |
|---|---|---|
| Filename | modeM0/AS1T05_239T01_9000006444_50537cztM0_level2.fits | modeM0/AS1T05_239T01_9000006444_50537cztM0_level2_quad_clean.evt |
| Size (bytes) | 613,319,040 | 95,630,400 |
| Size | 584.9 MB | 91.2 MB |
| Events in quadrant A | 4,857,383 | 624,923 |
| Events in quadrant B | 4,231,824 | 704,489 |
| Events in quadrant C | 7,202,282 | 568,671 |
| Events in quadrant D | 5,903,864 | 539,785 |
| Mode M0 | |||
|---|---|---|---|
| Quadrant | BADHDUFLAG | Total packets | Discarded packets |
| A | 0 | 18803 | 2 |
| B | 0 | 16949 | 2 |
| C | 0 | 25907 | 2 |
| D | 0 | 22219 | 2 |
| Mode M9 | |||
|---|---|---|---|
| Quadrant | BADHDUFLAG | Total packets | Discarded packets |
| A | 0 | 20 | 0 |
| B | 0 | 21 | 0 |
| C | 0 | 21 | 0 |
| D | 0 | 21 | 0 |
| Mode SS | |||
|---|---|---|---|
| Quadrant | BADHDUFLAG | Total packets | Discarded packets |
| A | 0 | 134 | 0 |
| B | 0 | 134 | 0 |
| C | 0 | 134 | 0 |
| D | 0 | 134 | 0 |
| Quadrant | Total seconds | Saturated seconds | Saturation percentage |
|---|---|---|---|
| A | 6557 | 394 | 6.008846% |
| B | 6557 | 196 | 2.989172% |
| C | 6557 | 926 | 14.122312% |
| D | 6557 | 743 | 11.331402% |
Noise dominated data is calculated using 1-second bins in cleaned event files. If a bin has >2000 counts, and if more than 50% of those come from <1% of pixels, then it is considered to be noise-dominated and hence unusable.
| Quadrant | # 1 sec bins | Bins with >0 counts | Bins with >2000 counts | High rate bins dominated by noise | Noise dominated (total time) | Noise dominated (detector-on time) | Marked lightcurve |
|---|---|---|---|---|---|---|---|
| A | 7752 | 6558 | 315 | 315 | 4.06% | 4.80% | 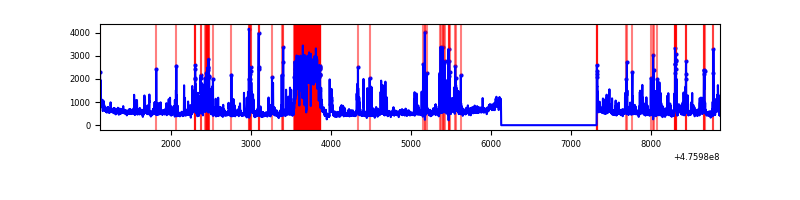 |
| B | 7752 | 6558 | 38 | 38 | 0.49% | 0.58% | 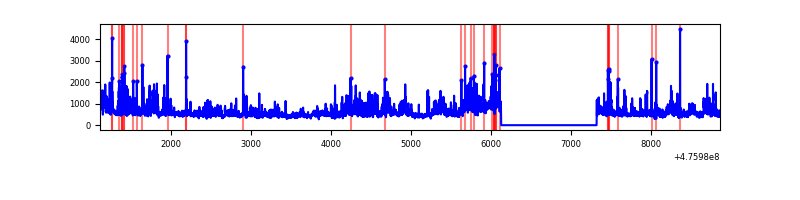 |
| C | 7752 | 6558 | 640 | 640 | 8.26% | 9.76% | 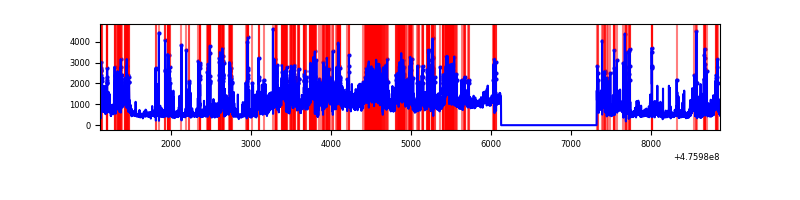 |
| D | 7752 | 6558 | 564 | 564 | 7.28% | 8.60% | 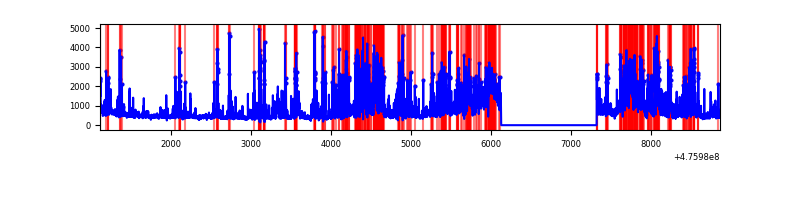 |
Top three noisy pixels from each quadrant. If the there are fewer than three noisy pixels in the level2.evt file, extra rows are filled as -1
| Pixel properties | Quadrant properties | ||||||
|---|---|---|---|---|---|---|---|
| Quadrant | DetID | PixID | Counts | Sigma | Mean | Median | Sigma |
| A | 8 | 247 | 942947 | 5252.11 | 717 | 699 | 179.4 |
| A | 4 | 3 | 188244 | 1045.38 | 717 | 699 | 179.4 |
| A | 5 | 240 | 133488 | 740.17 | 717 | 699 | 179.4 |
| B | 4 | 170 | 650127 | 4290.07 | 720 | 694 | 151.4 |
| B | 0 | 229 | 157855 | 1038.19 | 720 | 694 | 151.4 |
| B | 7 | 0 | 154363 | 1015.12 | 720 | 694 | 151.4 |
| C | 15 | 174 | 1654997 | 8837.87 | 677 | 673 | 187.2 |
| C | 15 | 234 | 438154 | 2337.15 | 677 | 673 | 187.2 |
| C | 15 | 232 | 341214 | 1819.27 | 677 | 673 | 187.2 |
| D | 7 | 96 | 975439 | 5226.88 | 664 | 640 | 186.5 |
| D | 8 | 246 | 552598 | 2959.61 | 664 | 640 | 186.5 |
| D | 6 | 42 | 444472 | 2379.83 | 664 | 640 | 186.5 |
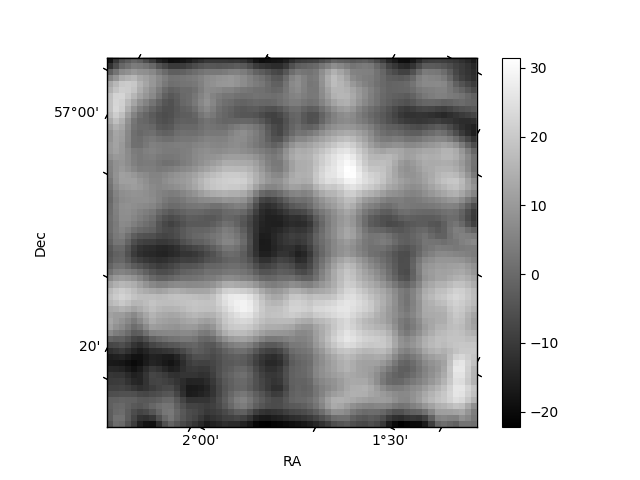
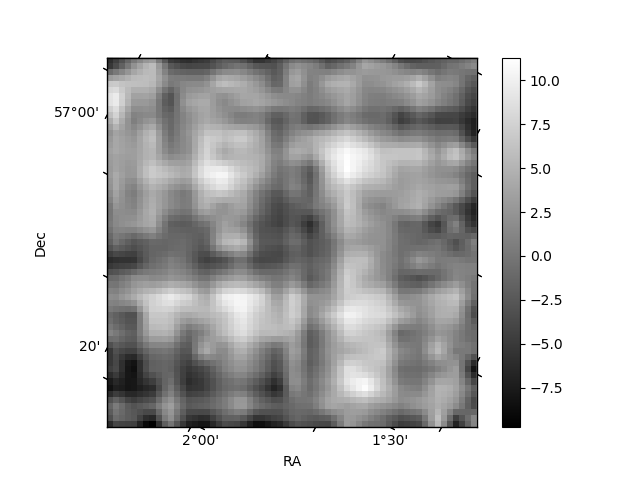
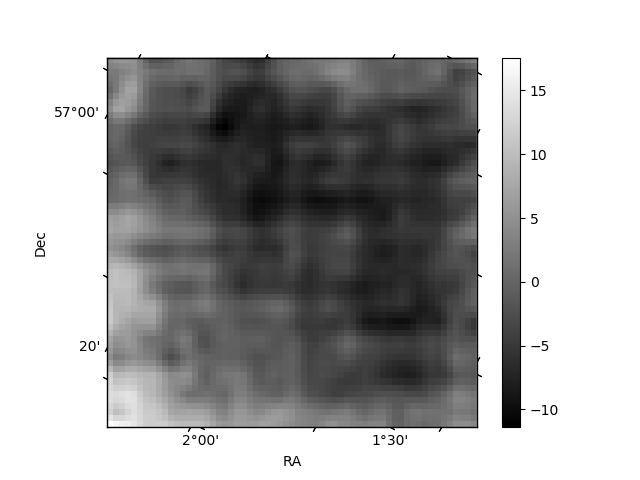
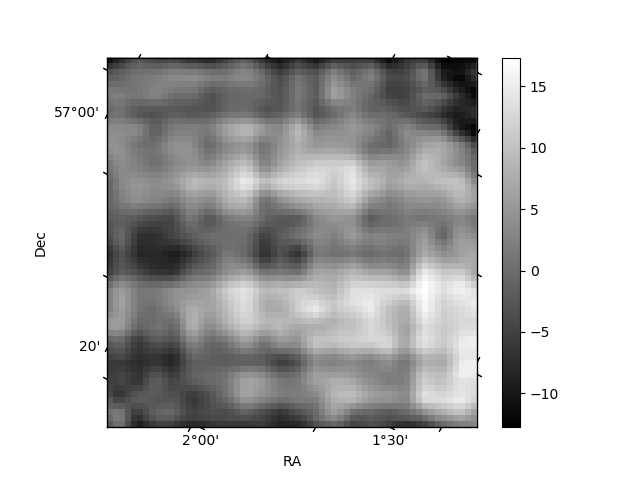
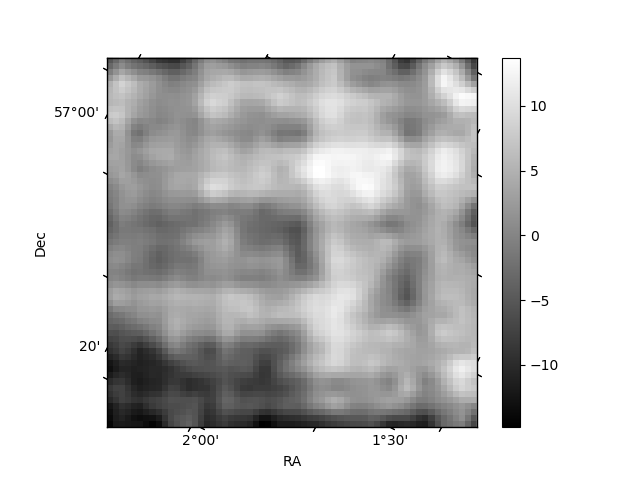
Histogram calculated using DETX and DETY for each event in the final _common_clean file
| Quadrant A | 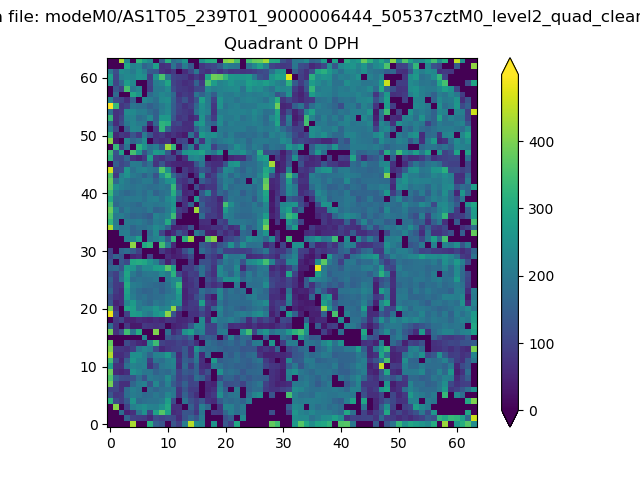 |
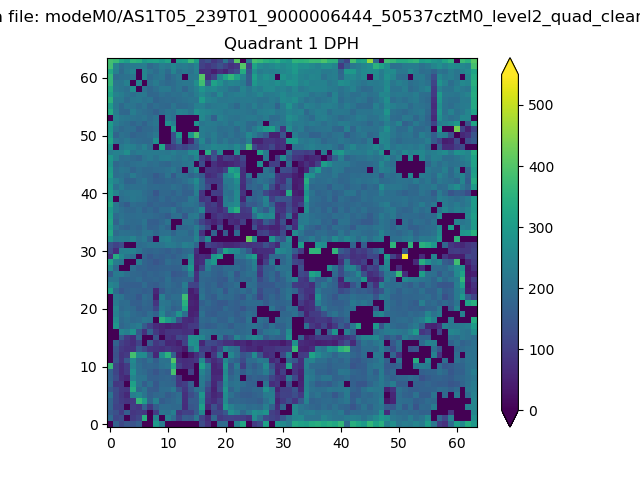 |
Quadrant B |
|---|---|---|---|
| Quadrant D |  |
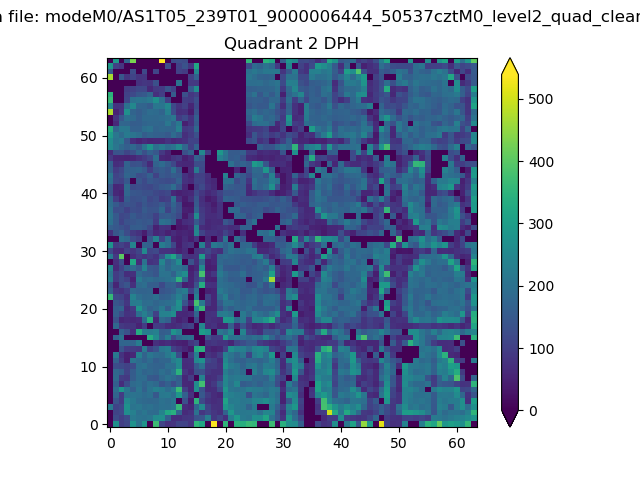 |
Quadrant C |
| Plot type | Count rate plots | Images |
|---|---|---|
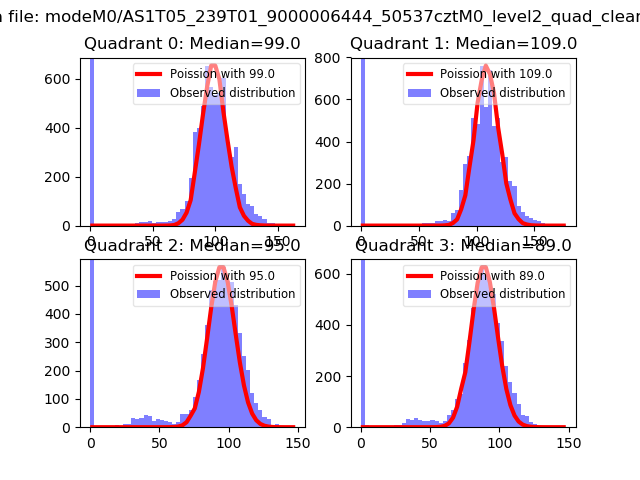
| Comparison with Poisson distribution Blue bars denote a histogram of data divided into 1 sec bins. Red curve is a Poisson curve with rate = median count rate of data. |
 |
 |
| Quadrant-wise count rates Data is divided into 100 sec bins |
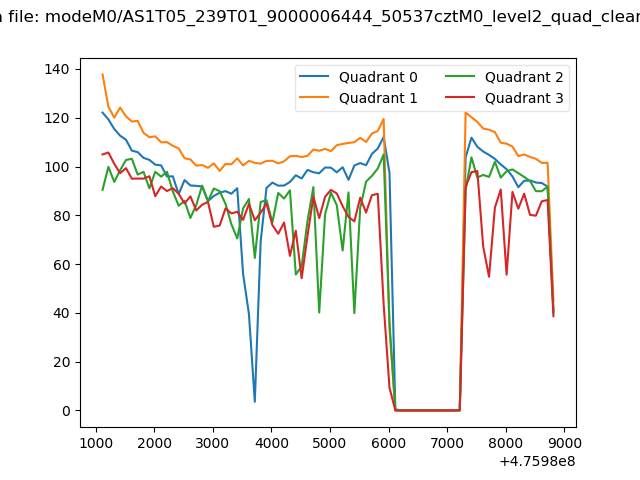 |
|
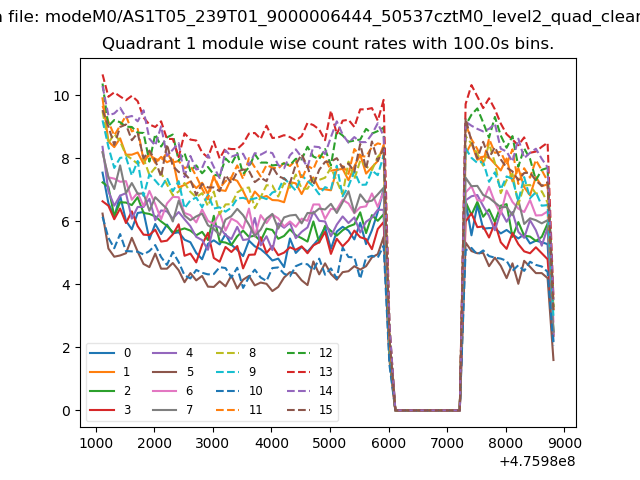
| Module-wise count rates for Quadrant A Data is divided into 100 sec bins |
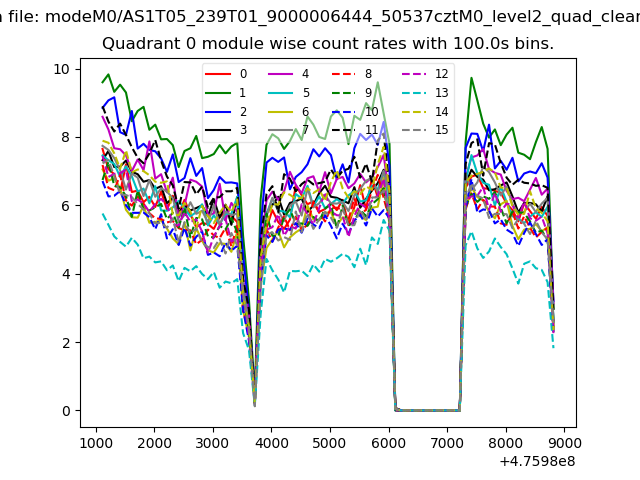 |
 |
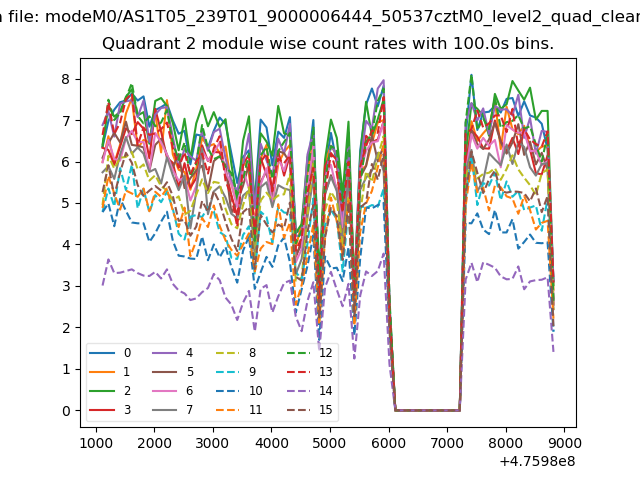
| Module-wise count rates for Quadrant B Data is divided into 100 sec bins |
 |
 |
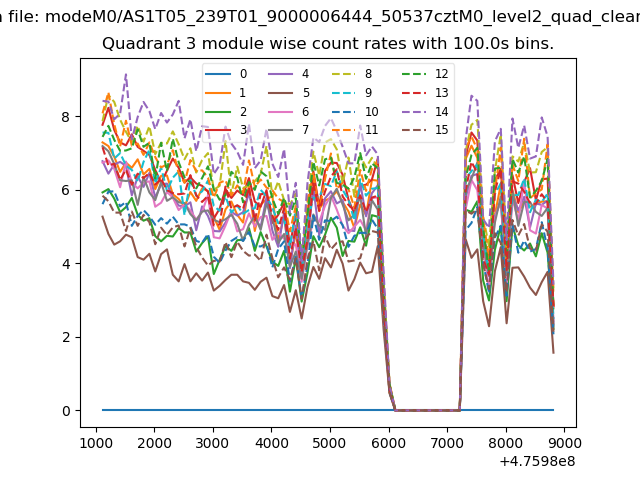
| Module-wise count rates for Quadrant C Data is divided into 100 sec bins |
 |
 |
| Module-wise count rates for Quadrant D Data is divided into 100 sec bins |
 |
 |
| Parameter | Plot |
|---|---|
| CZT HV Monitor | 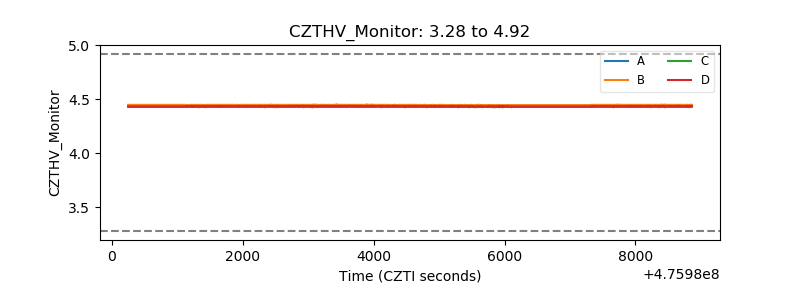 |
| D_VDD | 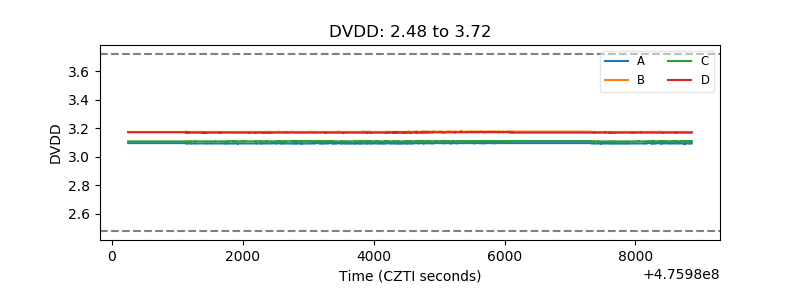 |
| Temperature 1 | 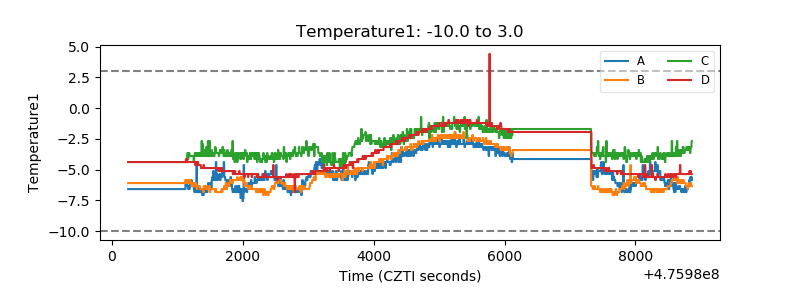 |
| Veto HV Monitor | 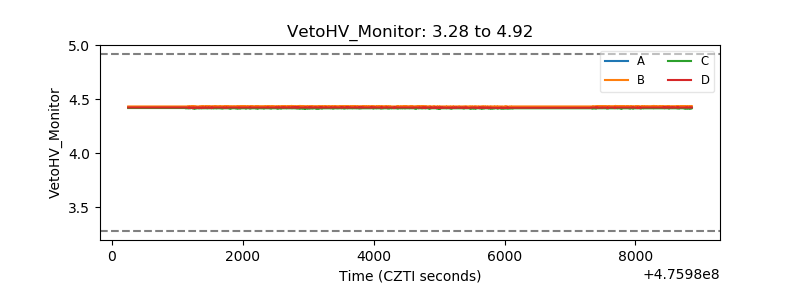 |
| Veto LLD | 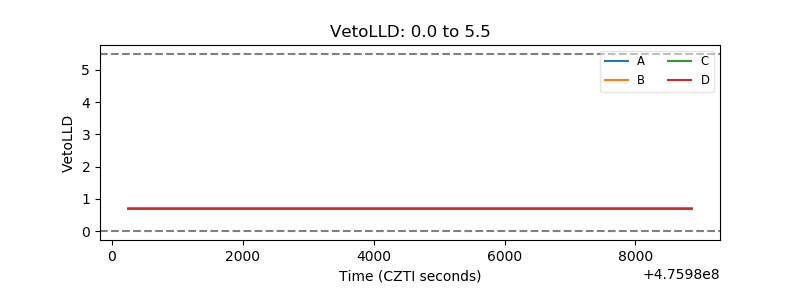 |
| Alpha Counter | 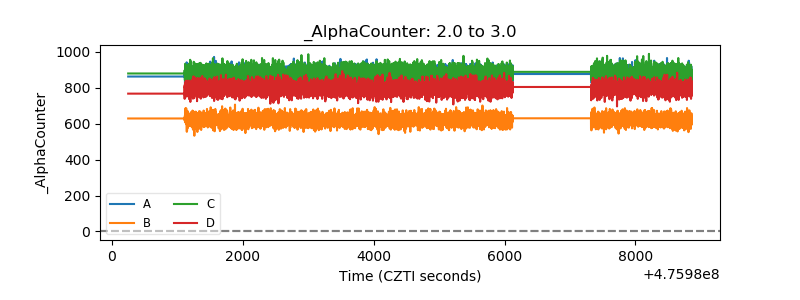 |
| _CPM_Rate | 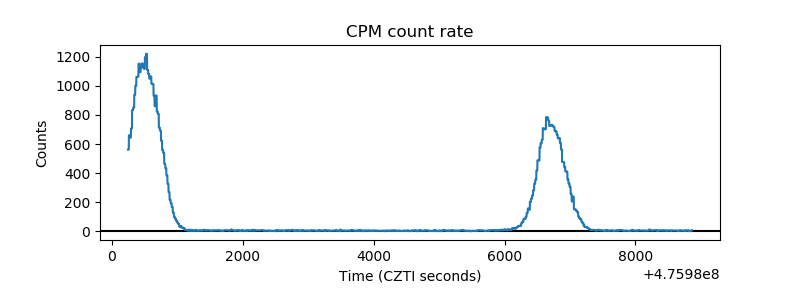 |
| CZT Counter | 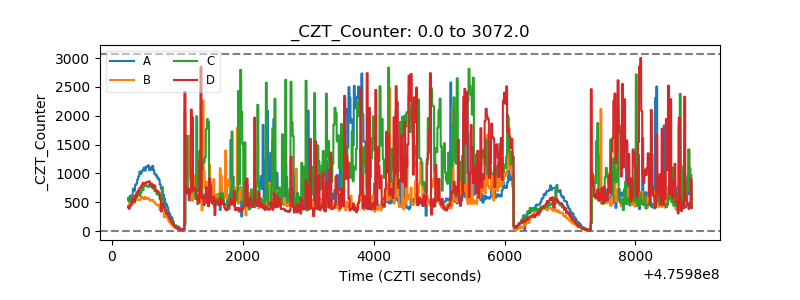 |
| +2.5 Volts monitor | 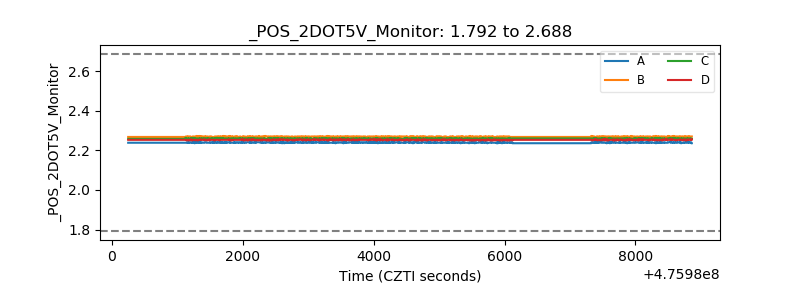 |
| +5 Volts monitor |  |
| _ROLL_ROT | 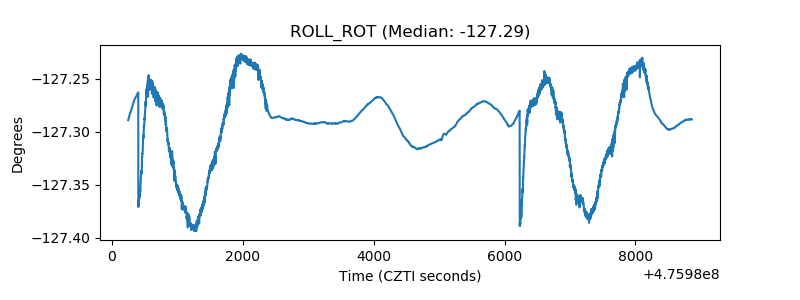 |
| _Roll_DEC | 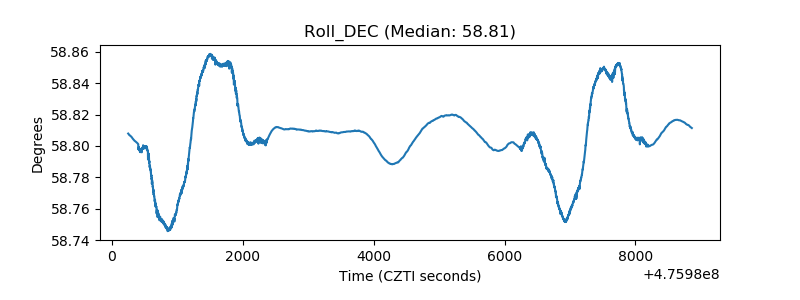 |
| _Roll_RA | 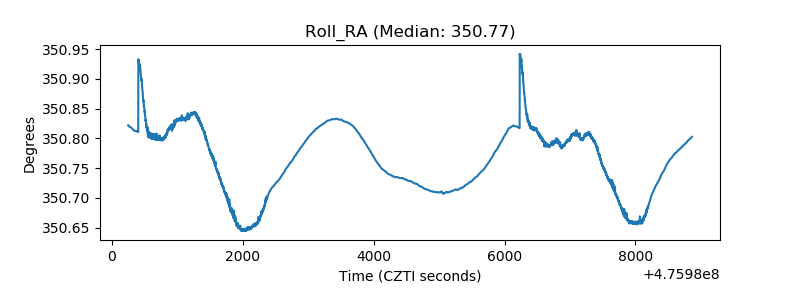 |
| Veto Counter | 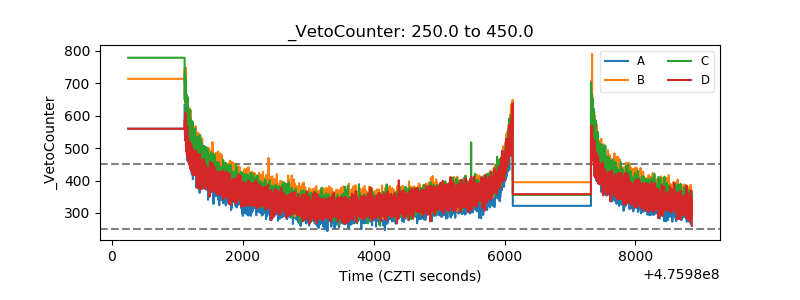 |