| Param | Original file | Final file |
|---|---|---|
| Filename | modeM0/AS1T05_239T01_9000006444_50538cztM0_level2.fits | modeM0/AS1T05_239T01_9000006444_50538cztM0_level2_quad_clean.evt |
| Size (bytes) | 610,240,320 | 89,904,960 |
| Size | 582.0 MB | 85.7 MB |
| Events in quadrant A | 4,223,117 | 603,103 |
| Events in quadrant B | 4,812,883 | 638,196 |
| Events in quadrant C | 7,129,944 | 538,227 |
| Events in quadrant D | 5,929,429 | 497,737 |
| Mode M0 | |||
|---|---|---|---|
| Quadrant | BADHDUFLAG | Total packets | Discarded packets |
| A | 0 | 16827 | 1 |
| B | 0 | 18652 | 1 |
| C | 0 | 25569 | 2 |
| D | 0 | 22066 | 1 |
| Mode M9 | |||
|---|---|---|---|
| Quadrant | BADHDUFLAG | Total packets | Discarded packets |
| A | 0 | 11 | 0 |
| B | 0 | 11 | 0 |
| C | 0 | 11 | 0 |
| D | 0 | 11 | 0 |
| Mode SS | |||
|---|---|---|---|
| Quadrant | BADHDUFLAG | Total packets | Discarded packets |
| A | 0 | 130 | 0 |
| B | 0 | 130 | 0 |
| C | 0 | 130 | 0 |
| D | 0 | 130 | 0 |
| Quadrant | Total seconds | Saturated seconds | Saturation percentage |
|---|---|---|---|
| A | 6373 | 235 | 3.687431% |
| B | 6373 | 503 | 7.892672% |
| C | 6372 | 942 | 14.783427% |
| D | 6373 | 848 | 13.306135% |
Noise dominated data is calculated using 1-second bins in cleaned event files. If a bin has >2000 counts, and if more than 50% of those come from <1% of pixels, then it is considered to be noise-dominated and hence unusable.
| Quadrant | # 1 sec bins | Bins with >0 counts | Bins with >2000 counts | High rate bins dominated by noise | Noise dominated (total time) | Noise dominated (detector-on time) | Marked lightcurve |
|---|---|---|---|---|---|---|---|
| A | 7478 | 6374 | 118 | 118 | 1.58% | 1.85% | 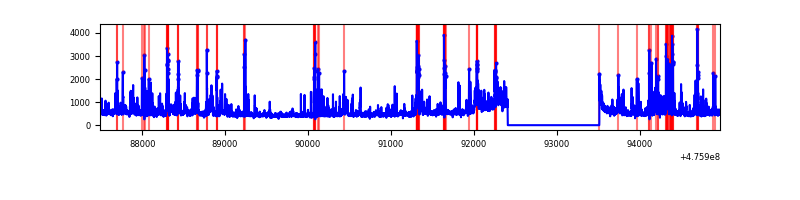 |
| B | 7478 | 6374 | 299 | 299 | 4.00% | 4.69% | 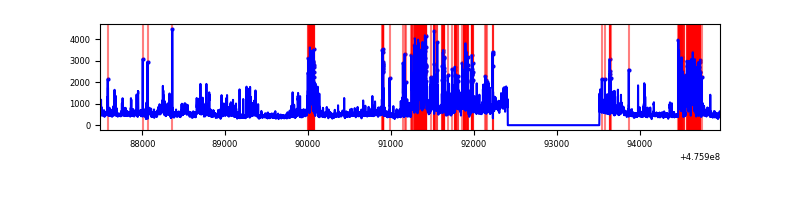 |
| C | 7477 | 6373 | 840 | 840 | 11.23% | 13.18% | 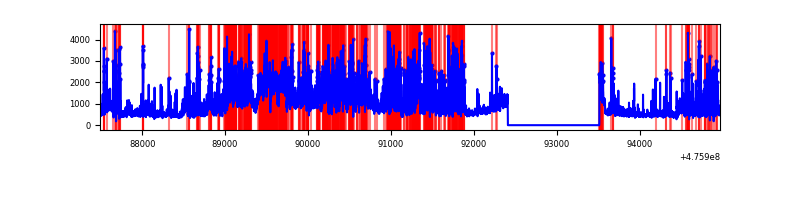 |
| D | 7478 | 6373 | 698 | 698 | 9.33% | 10.95% | 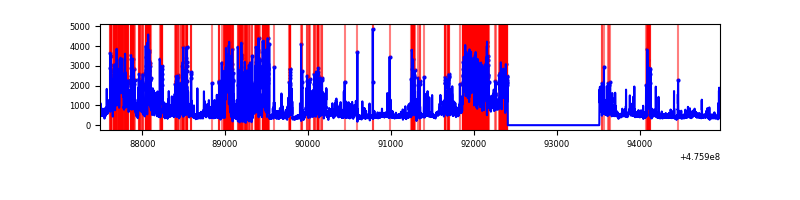 |
Top three noisy pixels from each quadrant. If the there are fewer than three noisy pixels in the level2.evt file, extra rows are filled as -1
| Pixel properties | Quadrant properties | ||||||
|---|---|---|---|---|---|---|---|
| Quadrant | DetID | PixID | Counts | Sigma | Mean | Median | Sigma |
| A | 4 | 78 | 200975 | 1176.19 | 684 | 667 | 170.3 |
| A | 8 | 247 | 176219 | 1030.83 | 684 | 667 | 170.3 |
| A | 12 | 250 | 171137 | 1000.98 | 684 | 667 | 170.3 |
| B | 4 | 170 | 869178 | 6116.59 | 670 | 647 | 142.0 |
| B | 12 | 0 | 481181 | 3384.14 | 670 | 647 | 142.0 |
| B | 0 | 229 | 163263 | 1145.21 | 670 | 647 | 142.0 |
| C | 0 | 208 | 1231885 | 6881.71 | 643 | 639 | 178.9 |
| C | 15 | 174 | 1035437 | 5783.72 | 643 | 639 | 178.9 |
| C | 12 | 252 | 686938 | 3835.88 | 643 | 639 | 178.9 |
| D | 6 | 42 | 925161 | 5404.58 | 618 | 596 | 171.1 |
| D | 7 | 96 | 779131 | 4550.95 | 618 | 596 | 171.1 |
| D | 8 | 246 | 555800 | 3245.46 | 618 | 596 | 171.1 |
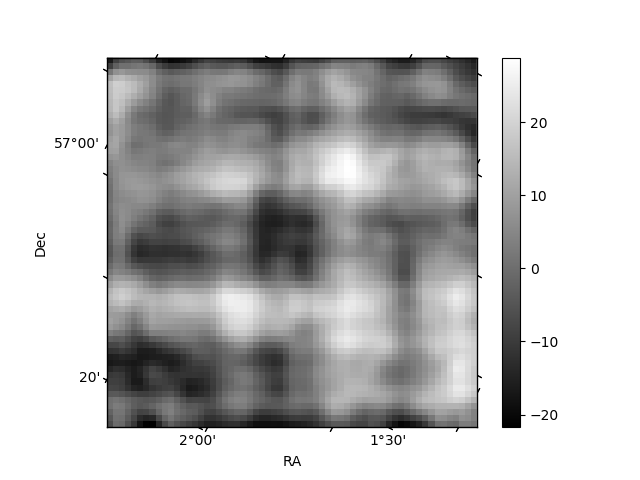
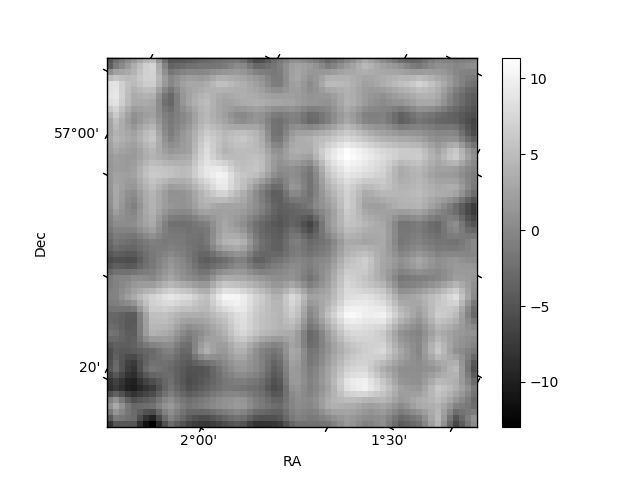
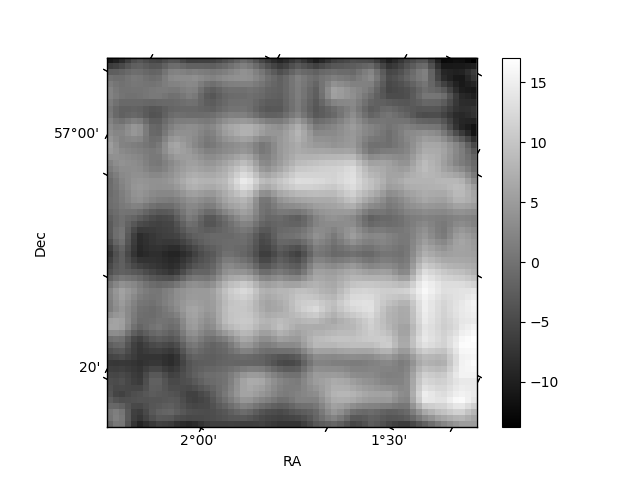
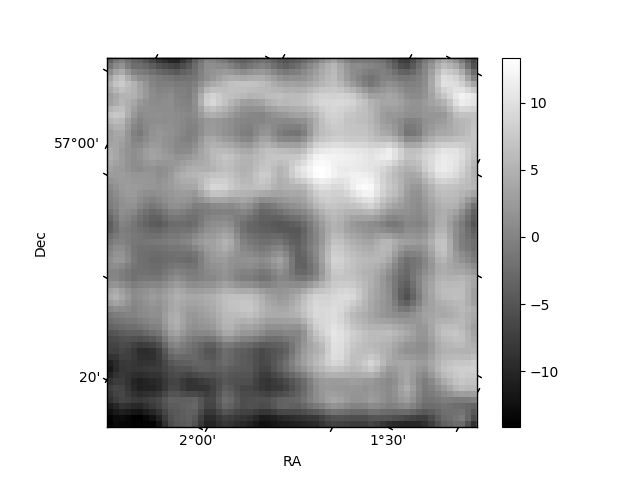
Histogram calculated using DETX and DETY for each event in the final _common_clean file
| Quadrant A | 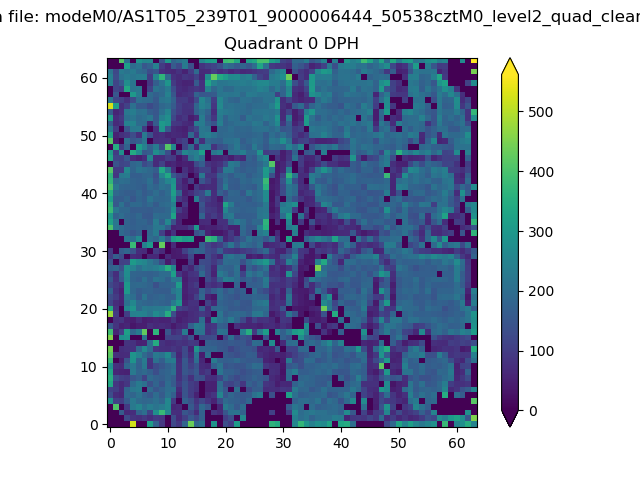 |
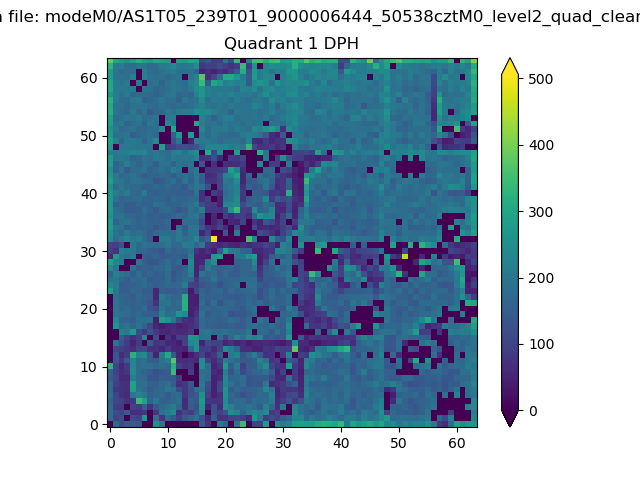 |
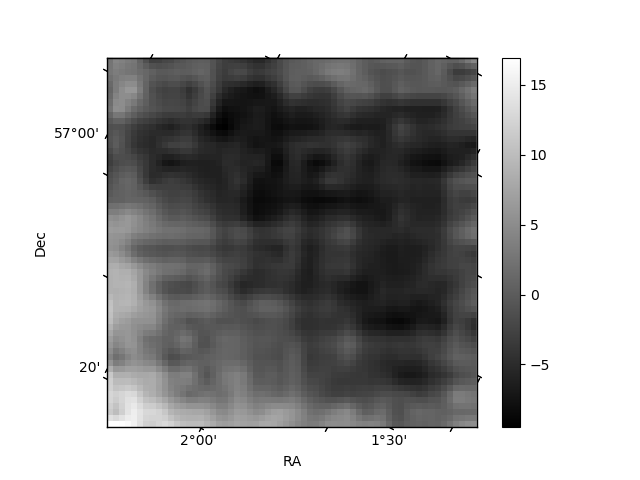
Quadrant B |
|---|---|---|---|
| Quadrant D | 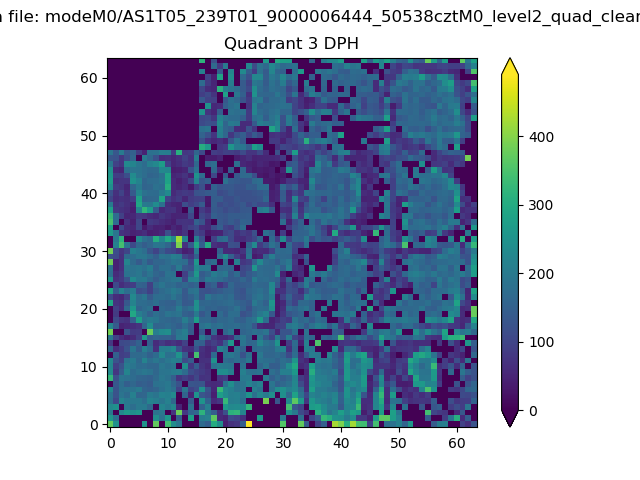 |
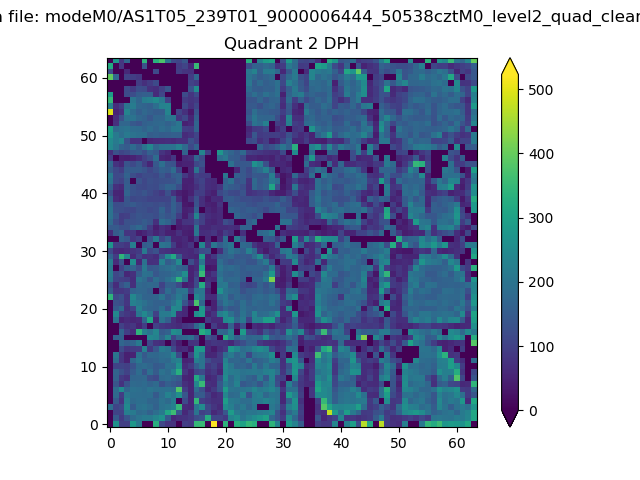 |
Quadrant C |
| Plot type | Count rate plots | Images |
|---|---|---|
| Comparison with Poisson distribution Blue bars denote a histogram of data divided into 1 sec bins. Red curve is a Poisson curve with rate = median count rate of data. |
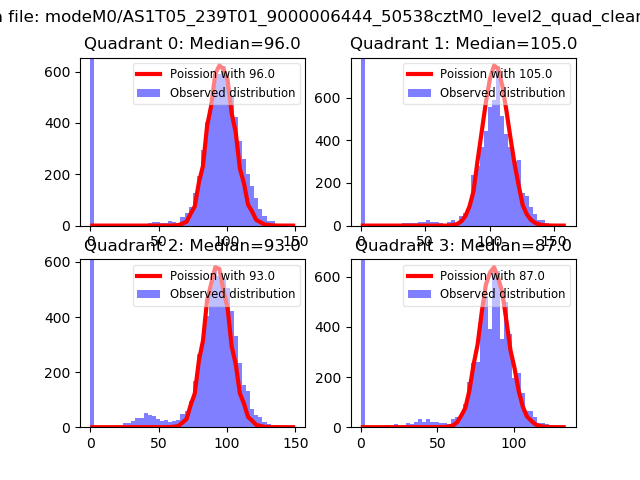 |
 |
| Quadrant-wise count rates Data is divided into 100 sec bins |
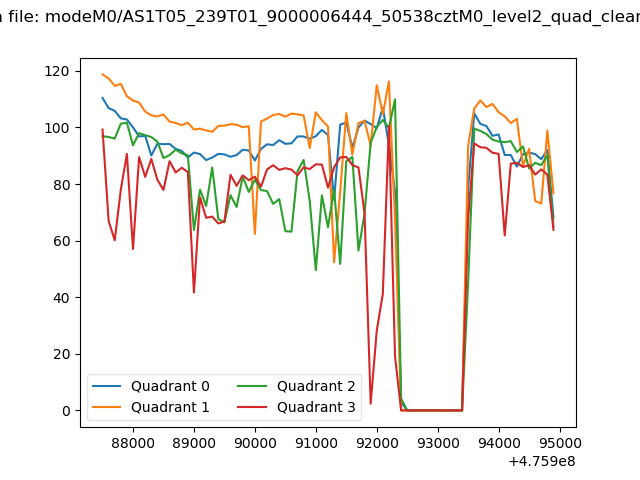 |
|
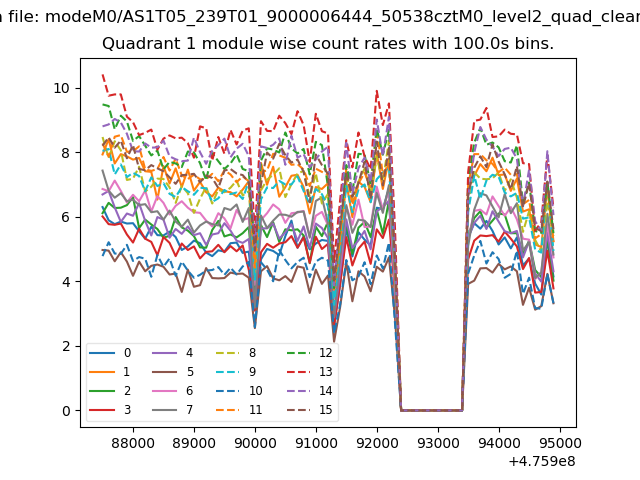
| Module-wise count rates for Quadrant A Data is divided into 100 sec bins |
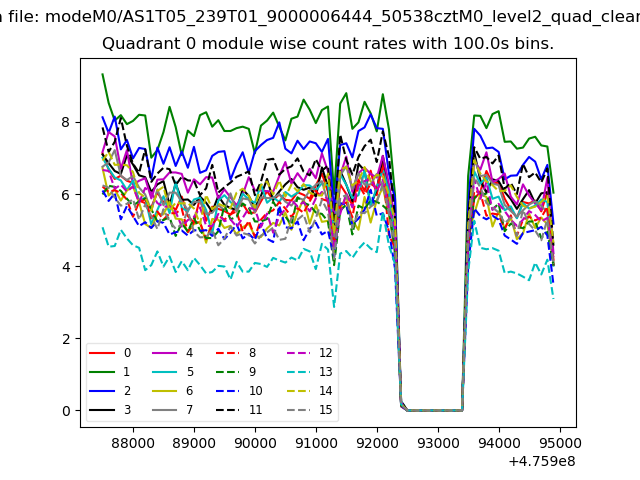 |
 |
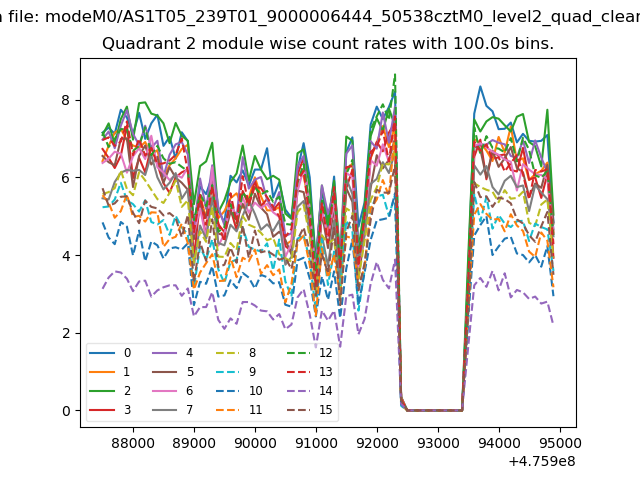
| Module-wise count rates for Quadrant B Data is divided into 100 sec bins |
 |
 |
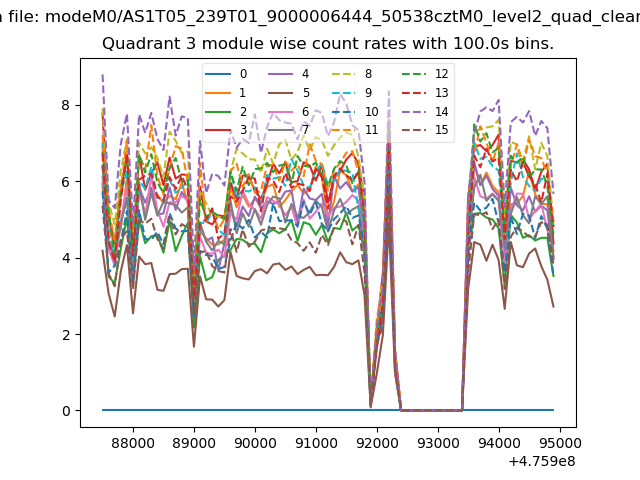
| Module-wise count rates for Quadrant C Data is divided into 100 sec bins |
 |
 |
| Module-wise count rates for Quadrant D Data is divided into 100 sec bins |
 |
 |
| Parameter | Plot |
|---|---|
| CZT HV Monitor | 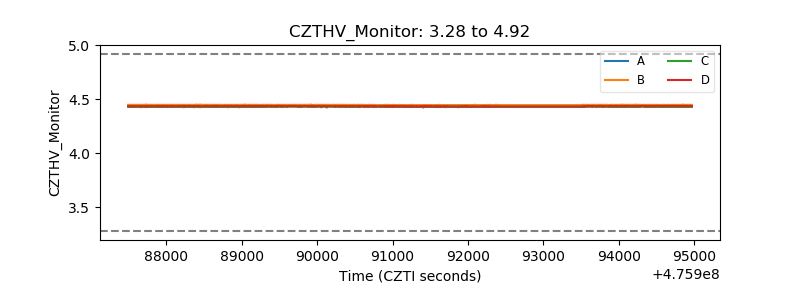 |
| D_VDD | 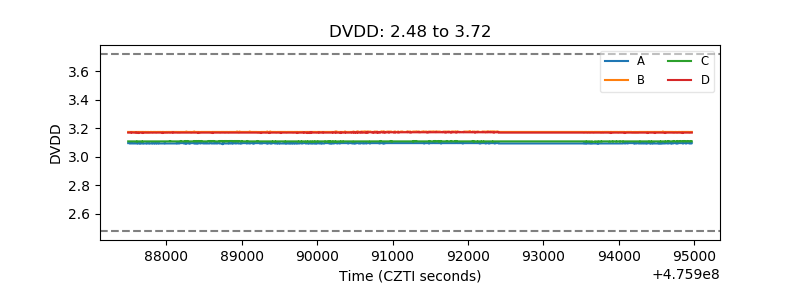 |
| Temperature 1 | 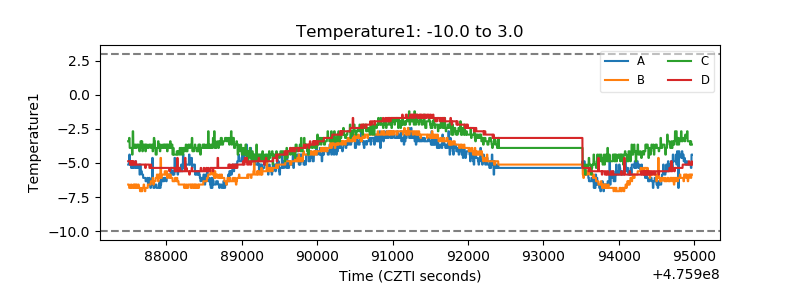 |
| Veto HV Monitor | 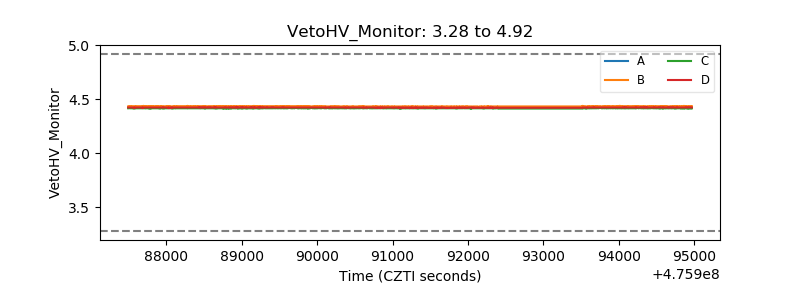 |
| Veto LLD | 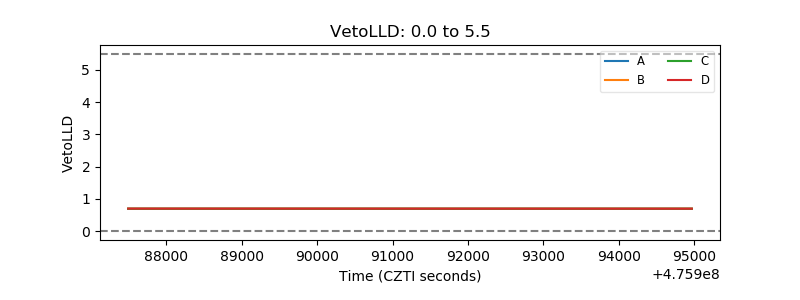 |
| Alpha Counter | 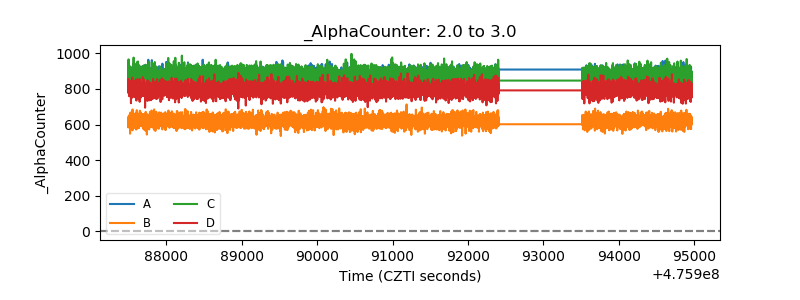 |
| _CPM_Rate | 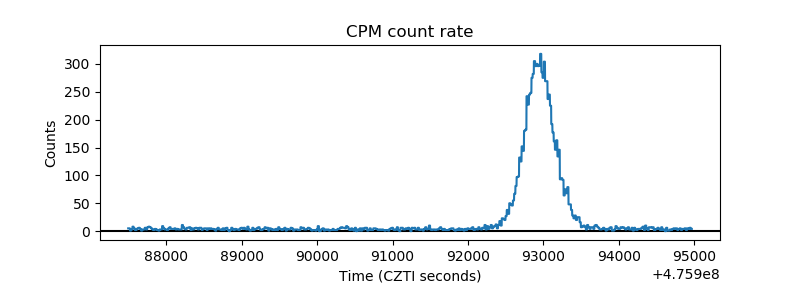 |
| CZT Counter | 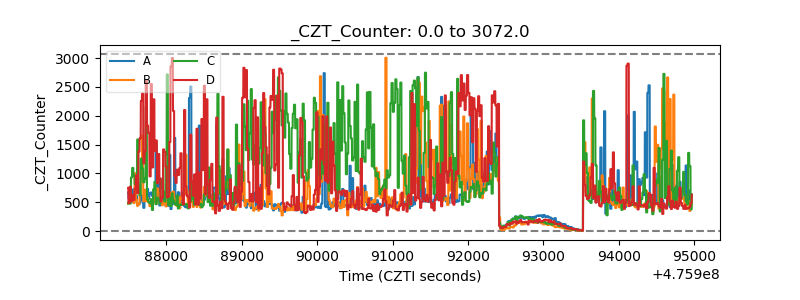 |
| +2.5 Volts monitor |  |
| +5 Volts monitor | 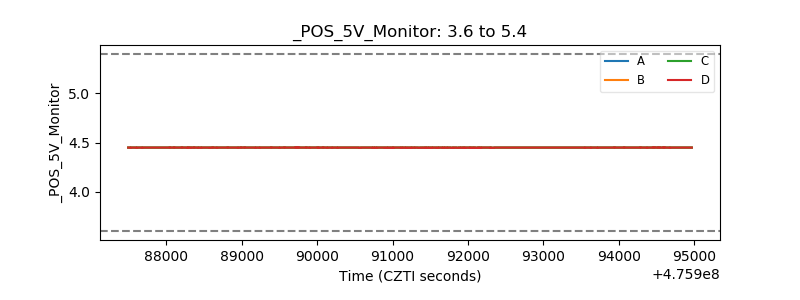 |
| _ROLL_ROT | 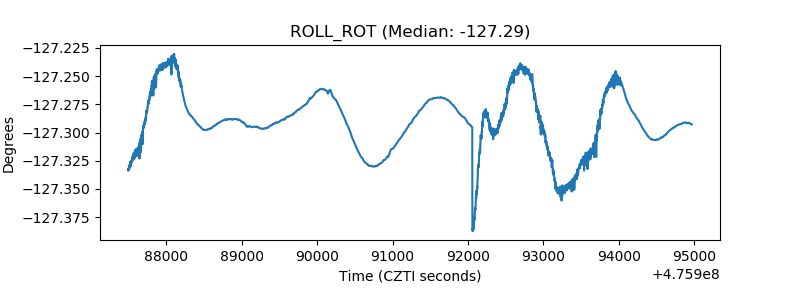 |
| _Roll_DEC | 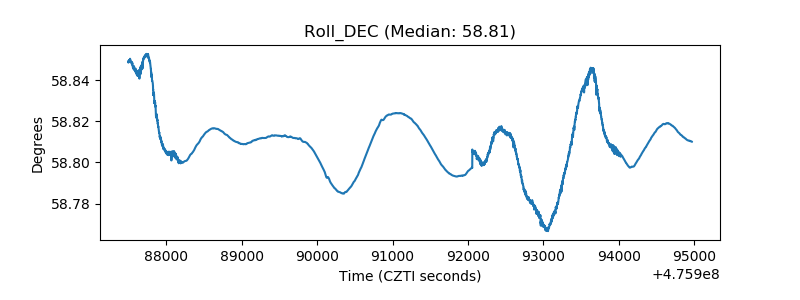 |
| _Roll_RA | 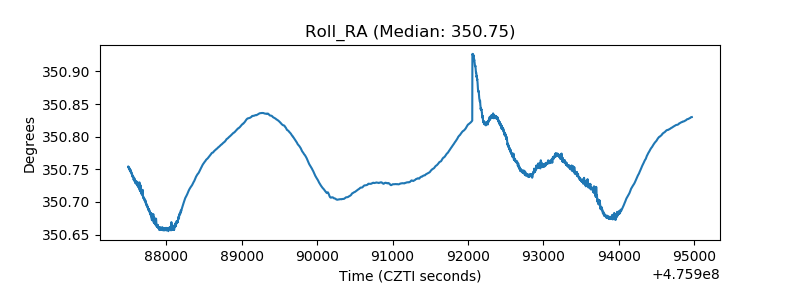 |
| Veto Counter | 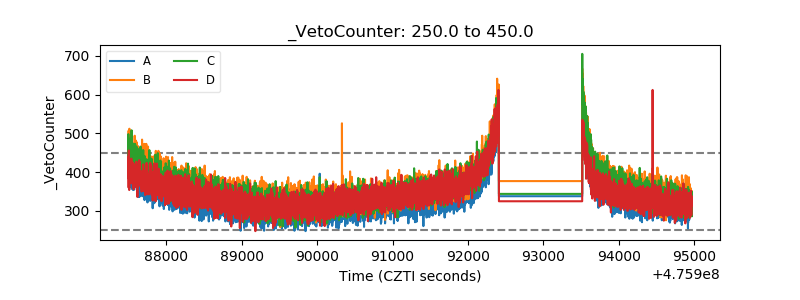 |