| Param | Original file | Final file |
|---|---|---|
| Filename | modeM0/AS1T05_239T01_9000006444_50539cztM0_level2.fits | modeM0/AS1T05_239T01_9000006444_50539cztM0_level2_quad_clean.evt |
| Size (bytes) | 575,976,960 | 96,413,760 |
| Size | 549.3 MB | 91.9 MB |
| Events in quadrant A | 4,706,003 | 630,380 |
| Events in quadrant B | 4,889,687 | 682,526 |
| Events in quadrant C | 6,180,029 | 564,163 |
| Events in quadrant D | 5,013,703 | 563,813 |
| Mode M0 | |||
|---|---|---|---|
| Quadrant | BADHDUFLAG | Total packets | Discarded packets |
| A | 0 | 18589 | 3 |
| B | 0 | 19250 | 3 |
| C | 0 | 23165 | 3 |
| D | 0 | 19753 | 3 |
| Mode M9 | |||
|---|---|---|---|
| Quadrant | BADHDUFLAG | Total packets | Discarded packets |
| A | 0 | 14 | 0 |
| B | 0 | 15 | 0 |
| C | 0 | 15 | 0 |
| D | 0 | 15 | 0 |
| Mode SS | |||
|---|---|---|---|
| Quadrant | BADHDUFLAG | Total packets | Discarded packets |
| A | 0 | 142 | 0 |
| B | 0 | 142 | 0 |
| C | 0 | 142 | 0 |
| D | 0 | 142 | 0 |
| Quadrant | Total seconds | Saturated seconds | Saturation percentage |
|---|---|---|---|
| A | 6856 | 291 | 4.244457% |
| B | 6856 | 418 | 6.096849% |
| C | 6856 | 827 | 12.062427% |
| D | 6856 | 409 | 5.965578% |
Noise dominated data is calculated using 1-second bins in cleaned event files. If a bin has >2000 counts, and if more than 50% of those come from <1% of pixels, then it is considered to be noise-dominated and hence unusable.
| Quadrant | # 1 sec bins | Bins with >0 counts | Bins with >2000 counts | High rate bins dominated by noise | Noise dominated (total time) | Noise dominated (detector-on time) | Marked lightcurve |
|---|---|---|---|---|---|---|---|
| A | 7676 | 6858 | 149 | 149 | 1.94% | 2.17% | 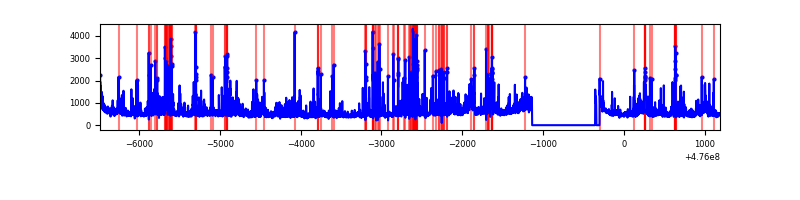 |
| B | 7676 | 6857 | 203 | 203 | 2.64% | 2.96% | 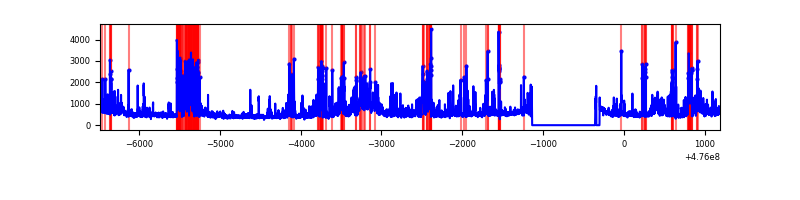 |
| C | 7676 | 6858 | 577 | 577 | 7.52% | 8.41% | 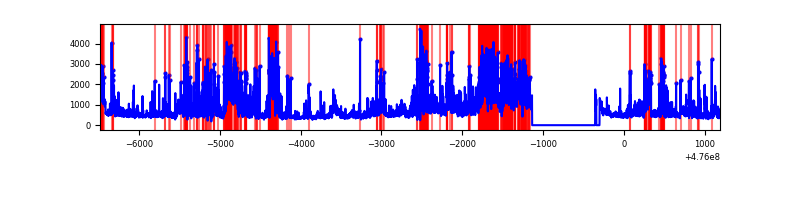 |
| D | 7676 | 6858 | 319 | 319 | 4.16% | 4.65% | 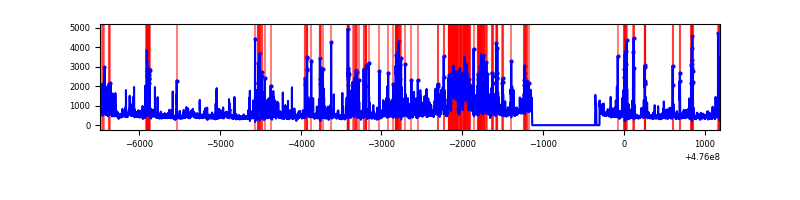 |
Top three noisy pixels from each quadrant. If the there are fewer than three noisy pixels in the level2.evt file, extra rows are filled as -1
| Pixel properties | Quadrant properties | ||||||
|---|---|---|---|---|---|---|---|
| Quadrant | DetID | PixID | Counts | Sigma | Mean | Median | Sigma |
| A | 3 | 130 | 206467 | 1141.01 | 727 | 707 | 180.3 |
| A | 4 | 3 | 176976 | 977.48 | 727 | 707 | 180.3 |
| A | 8 | 247 | 167541 | 925.16 | 727 | 707 | 180.3 |
| B | 4 | 170 | 708758 | 4654.44 | 724 | 699 | 152.1 |
| B | 0 | 229 | 403434 | 2647.39 | 724 | 699 | 152.1 |
| B | 7 | 0 | 387794 | 2544.58 | 724 | 699 | 152.1 |
| C | 15 | 196 | 1068548 | 5568.2 | 687 | 684 | 191.8 |
| C | 15 | 230 | 508322 | 2647.0 | 687 | 684 | 191.8 |
| C | 15 | 147 | 319940 | 1664.71 | 687 | 684 | 191.8 |
| D | 8 | 246 | 492188 | 2548.65 | 694 | 671 | 192.9 |
| D | 2 | 249 | 433286 | 2243.23 | 694 | 671 | 192.9 |
| D | 3 | 12 | 307407 | 1590.51 | 694 | 671 | 192.9 |
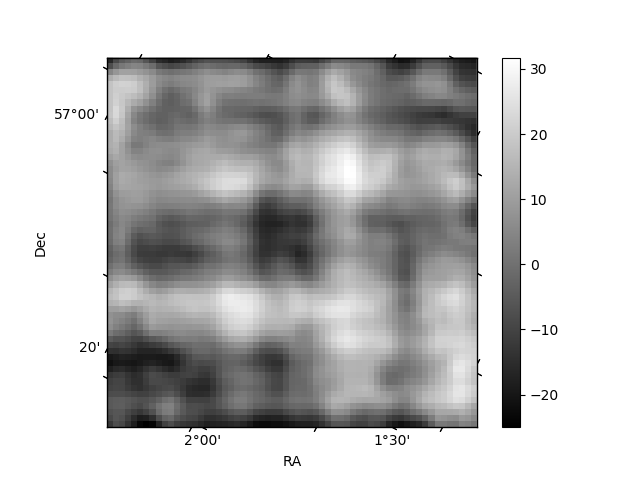
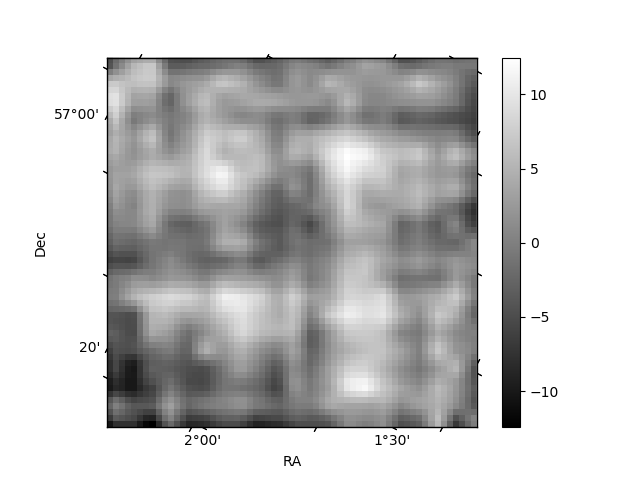
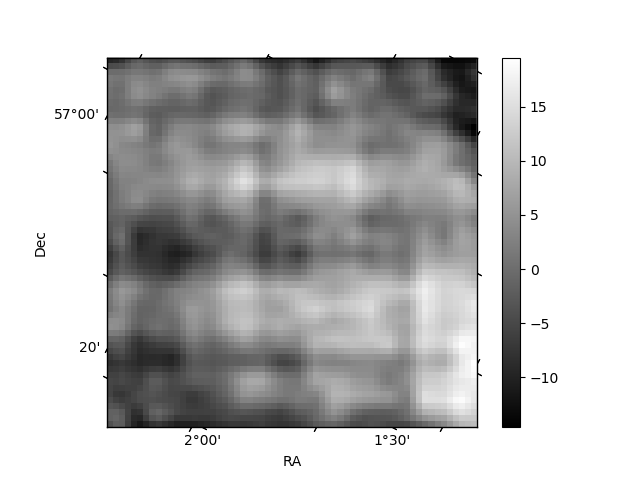
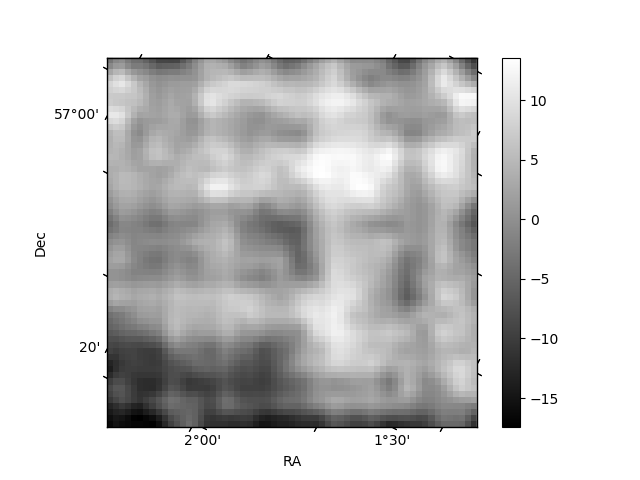
Histogram calculated using DETX and DETY for each event in the final _common_clean file
| Quadrant A | 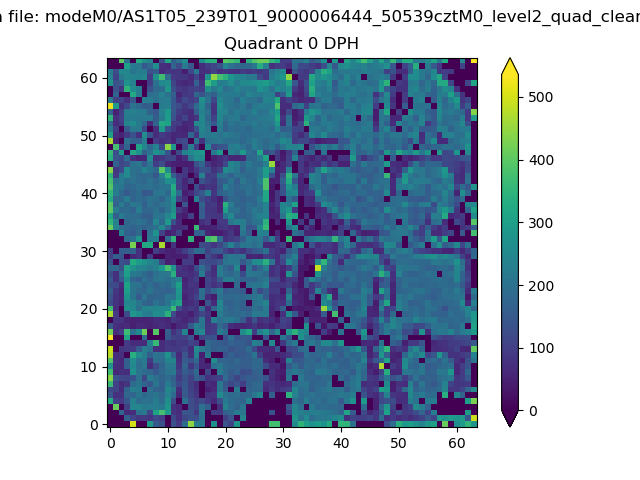 |
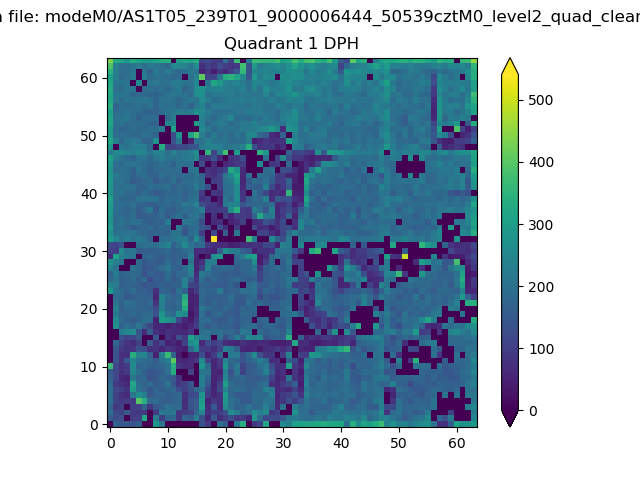 |
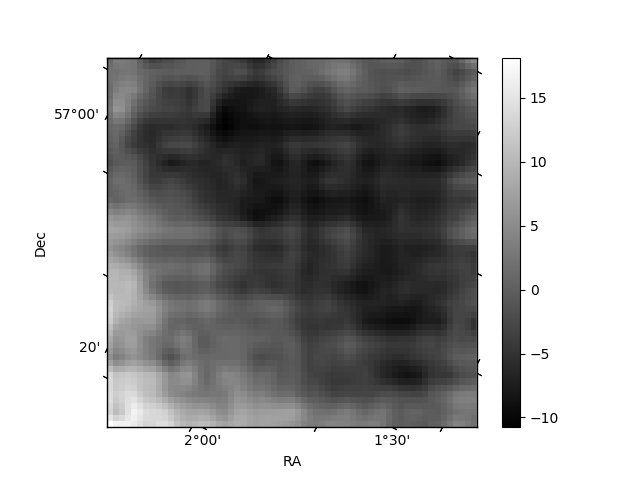
Quadrant B |
|---|---|---|---|
| Quadrant D | 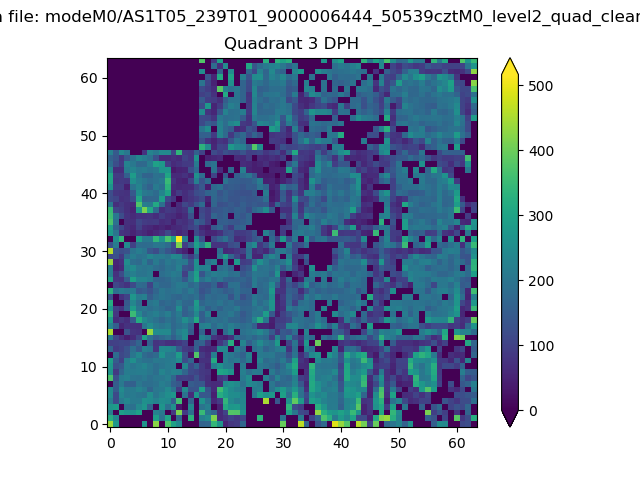 |
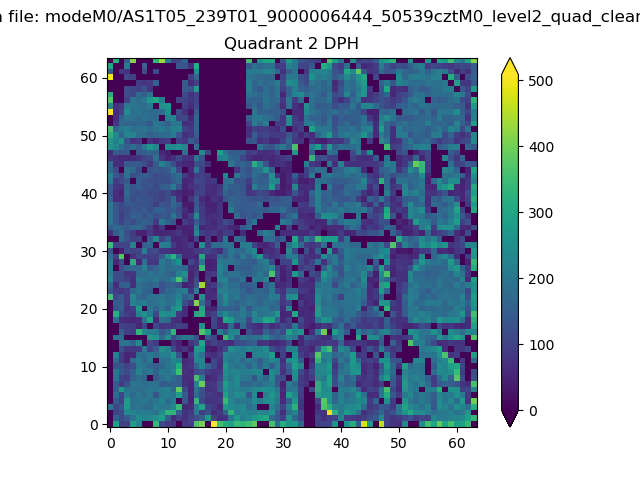 |
Quadrant C |
| Plot type | Count rate plots | Images |
|---|---|---|
| Comparison with Poisson distribution Blue bars denote a histogram of data divided into 1 sec bins. Red curve is a Poisson curve with rate = median count rate of data. |
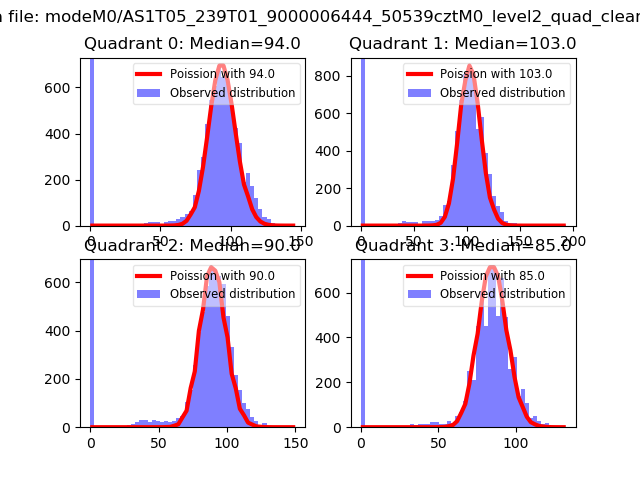 |
 |
| Quadrant-wise count rates Data is divided into 100 sec bins |
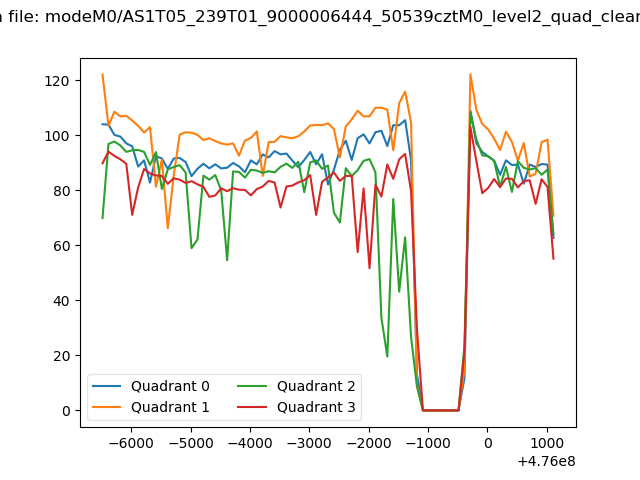 |
|
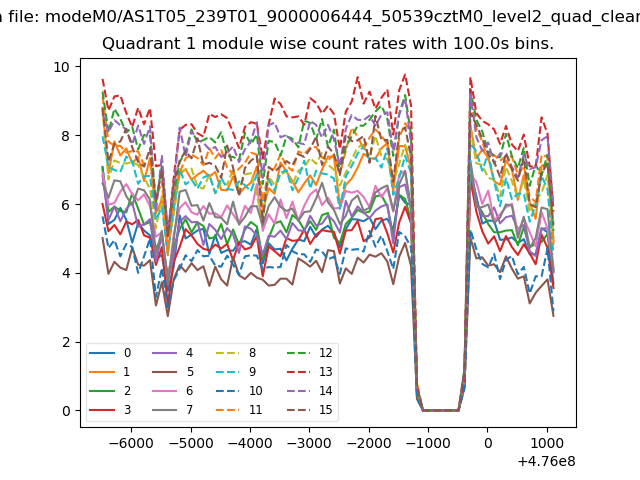
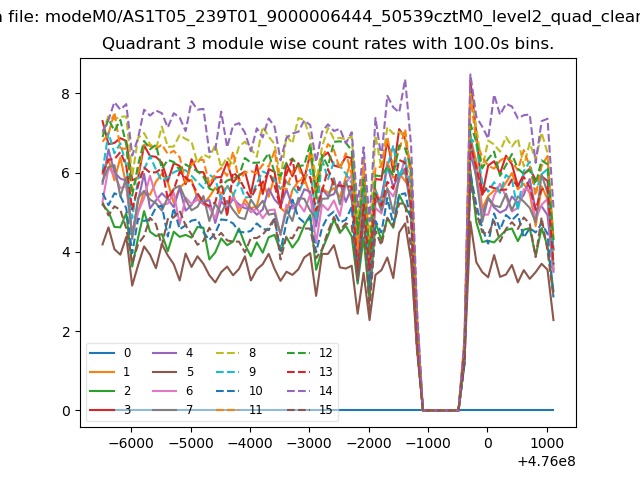
| Module-wise count rates for Quadrant A Data is divided into 100 sec bins |
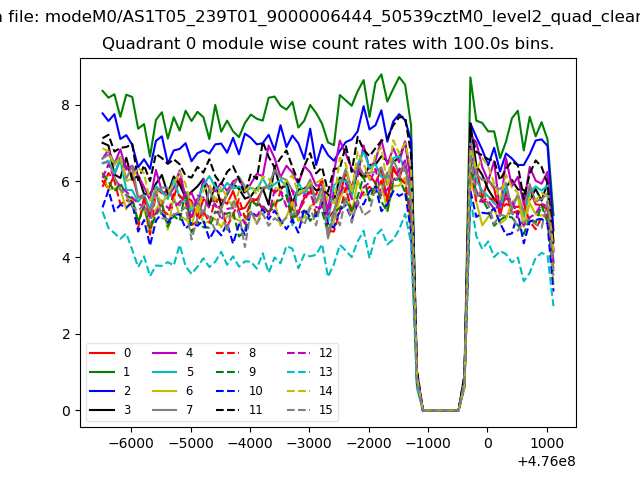 |
 |
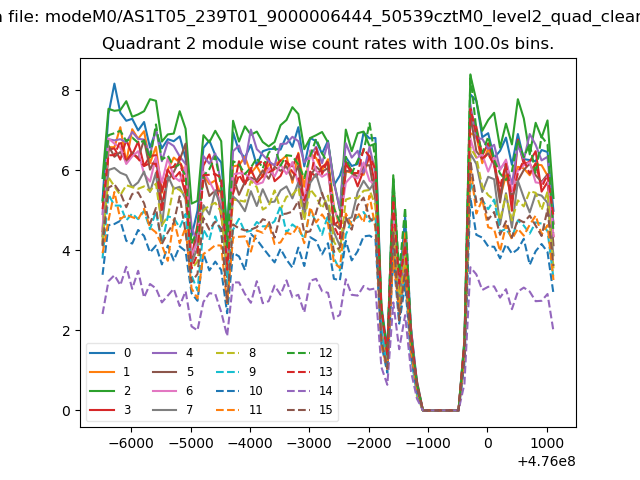
| Module-wise count rates for Quadrant B Data is divided into 100 sec bins |
 |
 |
| Module-wise count rates for Quadrant C Data is divided into 100 sec bins |
 |
 |
| Module-wise count rates for Quadrant D Data is divided into 100 sec bins |
 |
 |
| Parameter | Plot |
|---|---|
| CZT HV Monitor | 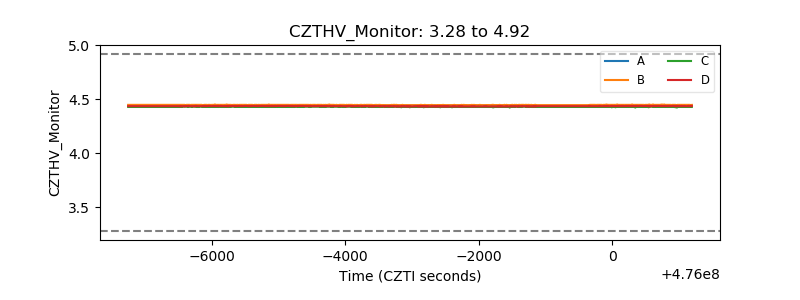 |
| D_VDD | 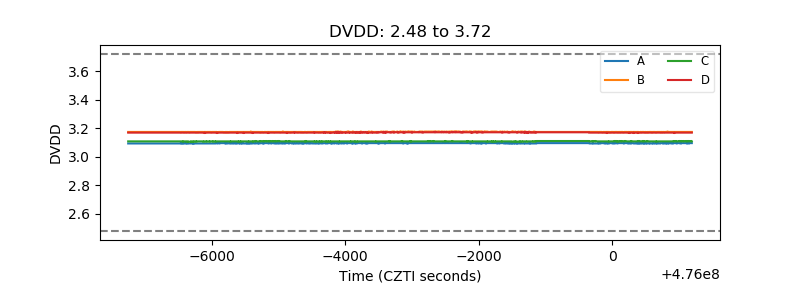 |
| Temperature 1 | 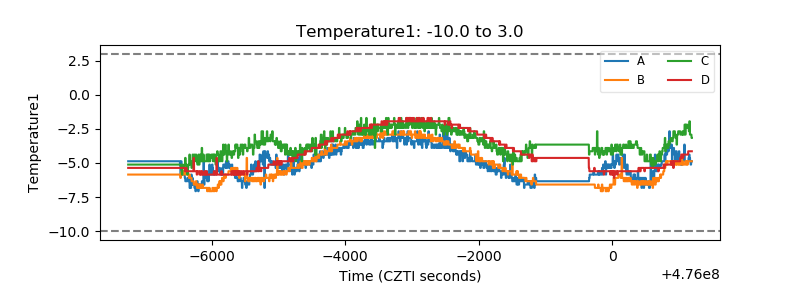 |
| Veto HV Monitor | 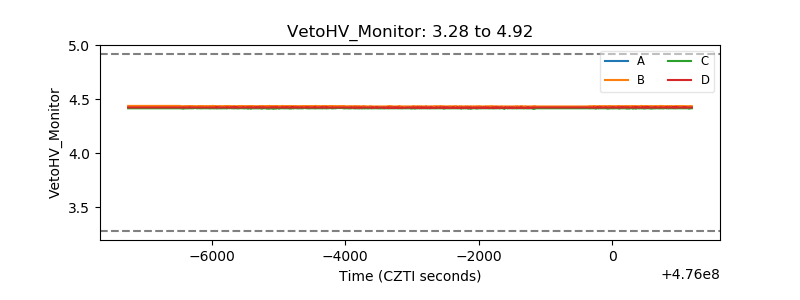 |
| Veto LLD | 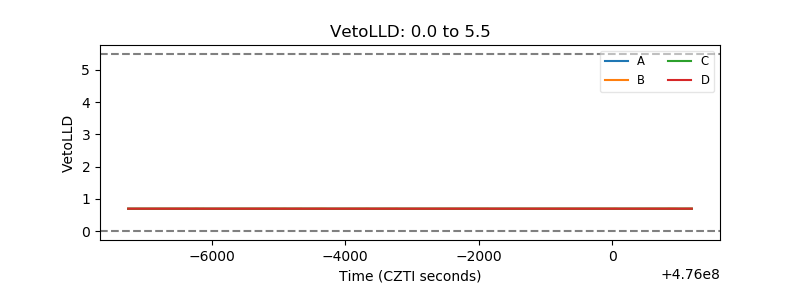 |
| Alpha Counter | 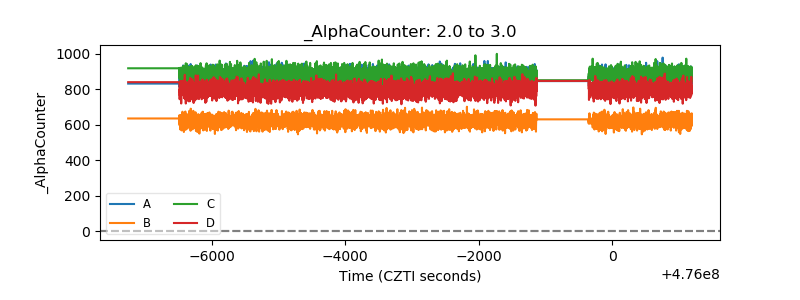 |
| _CPM_Rate | 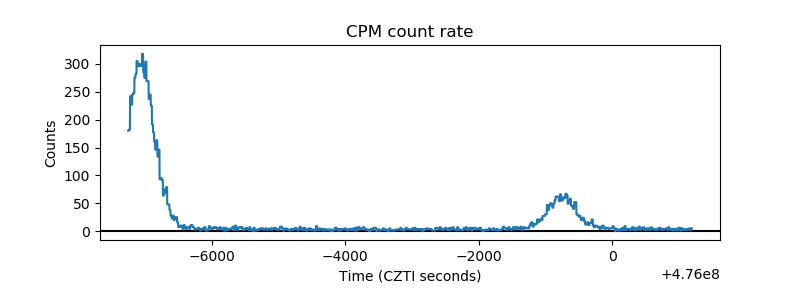 |
| CZT Counter | 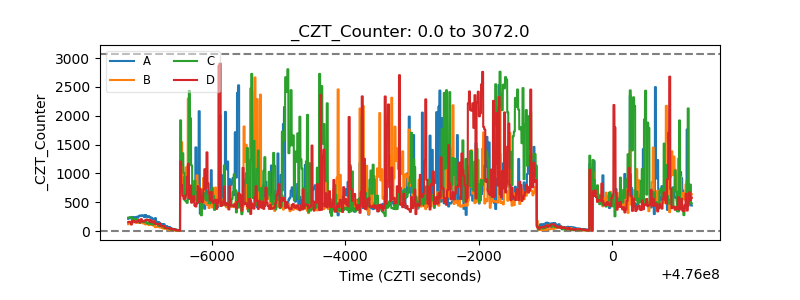 |
| +2.5 Volts monitor | 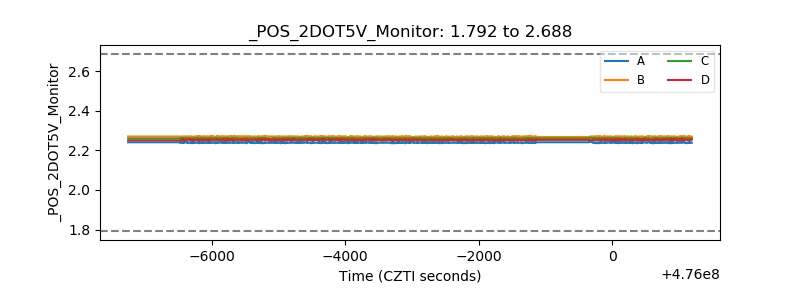 |
| +5 Volts monitor |  |
| _ROLL_ROT | 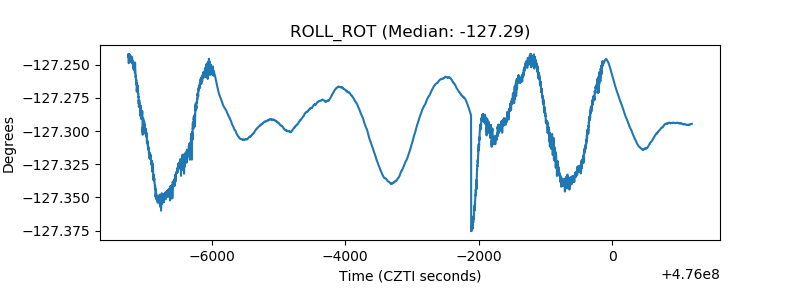 |
| _Roll_DEC | 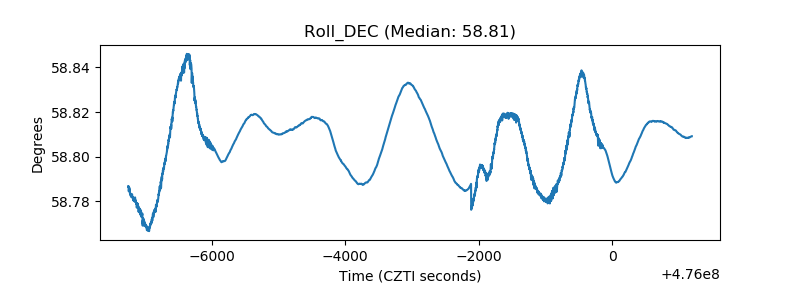 |
| _Roll_RA | 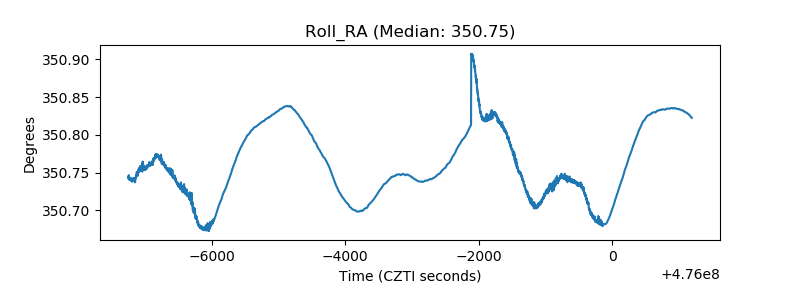 |
| Veto Counter | 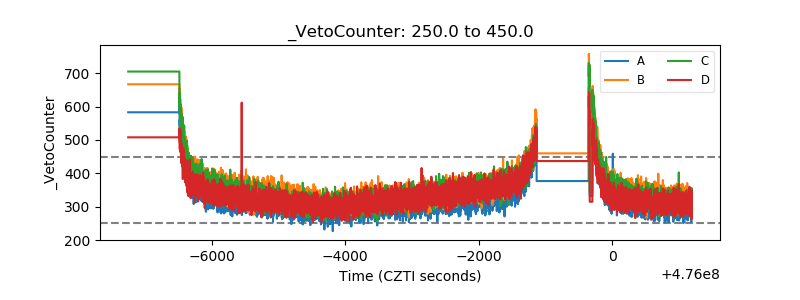 |