| Param | Original file | Final file |
|---|---|---|
| Filename | modeM0/AS1T05_239T01_9000006444_50540cztM0_level2.fits | modeM0/AS1T05_239T01_9000006444_50540cztM0_level2_quad_clean.evt |
| Size (bytes) | 703,592,640 | 96,422,400 |
| Size | 671.0 MB | 92.0 MB |
| Events in quadrant A | 6,418,329 | 601,856 |
| Events in quadrant B | 6,359,853 | 658,084 |
| Events in quadrant C | 6,684,424 | 556,967 |
| Events in quadrant D | 6,015,105 | 593,273 |
| Mode M0 | |||
|---|---|---|---|
| Quadrant | BADHDUFLAG | Total packets | Discarded packets |
| A | 0 | 24061 | 0 |
| B | 0 | 23894 | 0 |
| C | 0 | 25044 | 2 |
| D | 0 | 22999 | 0 |
| Mode SS | |||
|---|---|---|---|
| Quadrant | BADHDUFLAG | Total packets | Discarded packets |
| A | 0 | 146 | 0 |
| B | 0 | 146 | 0 |
| C | 0 | 146 | 0 |
| D | 0 | 146 | 0 |
| Quadrant | Total seconds | Saturated seconds | Saturation percentage |
|---|---|---|---|
| A | 7314 | 1074 | 14.684167% |
| B | 7315 | 1037 | 14.176350% |
| C | 7314 | 1392 | 19.031993% |
| D | 7314 | 539 | 7.369428% |
Noise dominated data is calculated using 1-second bins in cleaned event files. If a bin has >2000 counts, and if more than 50% of those come from <1% of pixels, then it is considered to be noise-dominated and hence unusable.
| Quadrant | # 1 sec bins | Bins with >0 counts | Bins with >2000 counts | High rate bins dominated by noise | Noise dominated (total time) | Noise dominated (detector-on time) | Marked lightcurve |
|---|---|---|---|---|---|---|---|
| A | 7314 | 7314 | 539 | 539 | 7.37% | 7.37% | 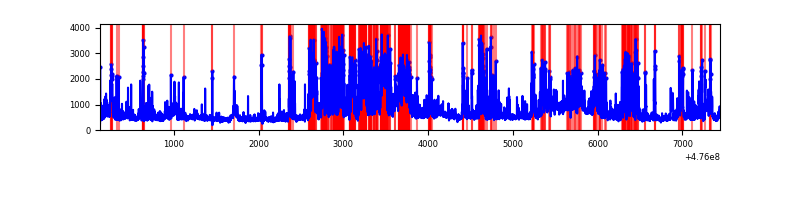 |
| B | 7315 | 7315 | 535 | 535 | 7.31% | 7.31% | 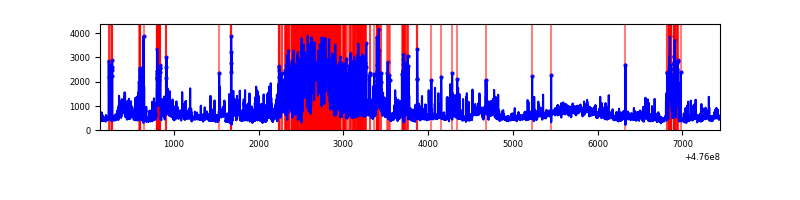 |
| C | 7314 | 7314 | 584 | 584 | 7.98% | 7.98% | 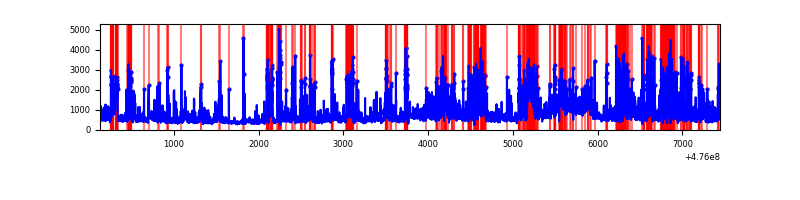 |
| D | 7314 | 7314 | 414 | 414 | 5.66% | 5.66% | 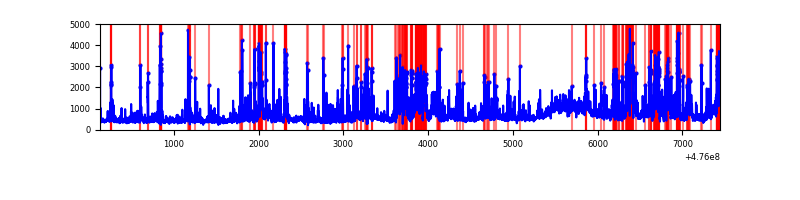 |
Top three noisy pixels from each quadrant. If the there are fewer than three noisy pixels in the level2.evt file, extra rows are filled as -1
| Pixel properties | Quadrant properties | ||||||
|---|---|---|---|---|---|---|---|
| Quadrant | DetID | PixID | Counts | Sigma | Mean | Median | Sigma |
| A | 12 | 250 | 1331003 | 6948.3 | 777 | 756 | 191.4 |
| A | 3 | 130 | 579824 | 3024.65 | 777 | 756 | 191.4 |
| A | 8 | 247 | 454410 | 2369.58 | 777 | 756 | 191.4 |
| B | 4 | 170 | 1488175 | 9019.94 | 770 | 743 | 164.9 |
| B | 1 | 223 | 817948 | 4955.62 | 770 | 743 | 164.9 |
| B | 0 | 229 | 327028 | 1978.63 | 770 | 743 | 164.9 |
| C | 4 | 12 | 682477 | 3402.11 | 720 | 715 | 200.4 |
| C | 15 | 196 | 644174 | 3210.97 | 720 | 715 | 200.4 |
| C | 12 | 252 | 345652 | 1721.3 | 720 | 715 | 200.4 |
| D | 6 | 42 | 892262 | 4220.51 | 766 | 738 | 211.2 |
| D | 8 | 246 | 494991 | 2339.81 | 766 | 738 | 211.2 |
| D | 2 | 249 | 294735 | 1391.79 | 766 | 738 | 211.2 |
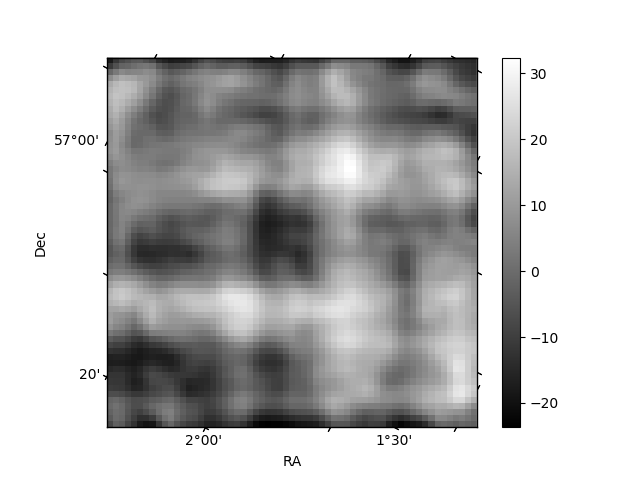
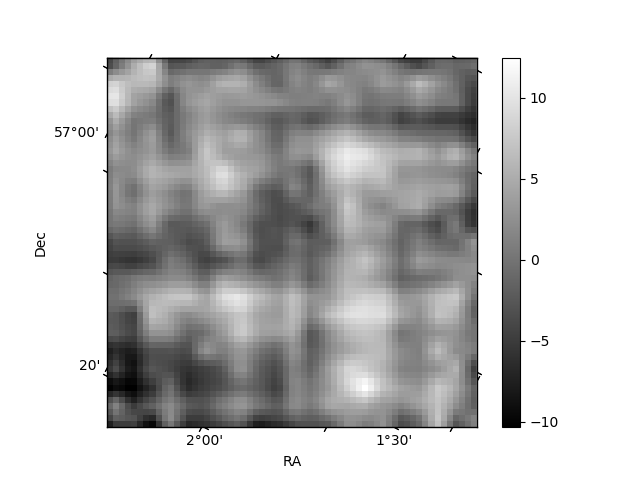
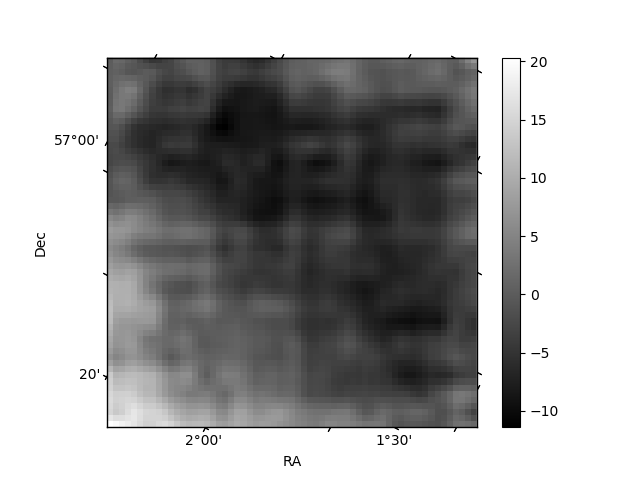
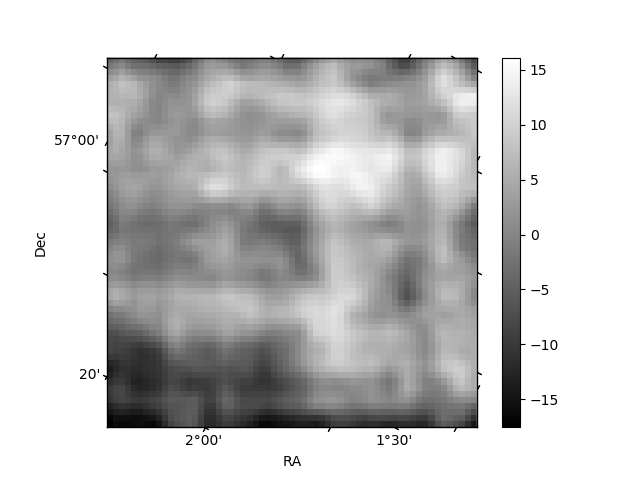
Histogram calculated using DETX and DETY for each event in the final _common_clean file
| Quadrant A | 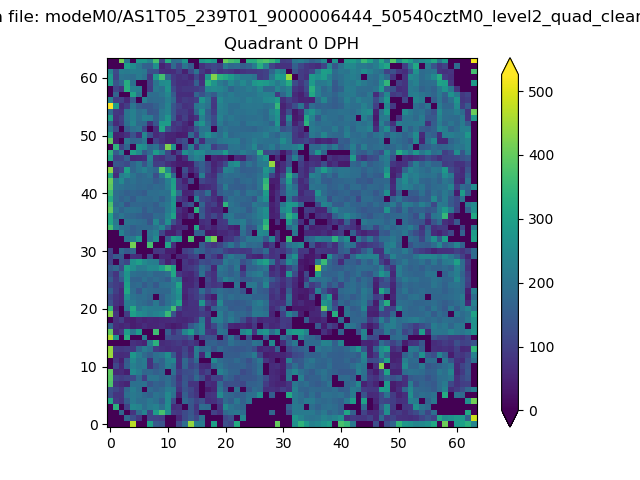 |
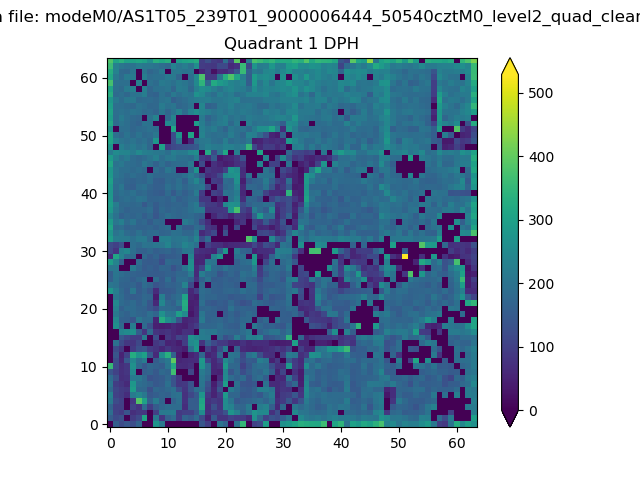 |
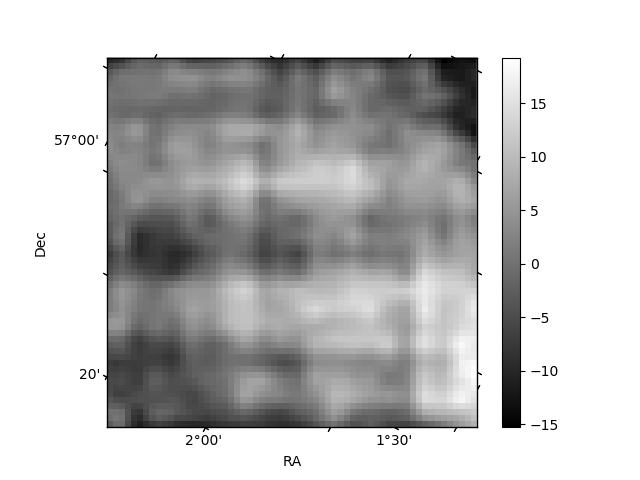
Quadrant B |
|---|---|---|---|
| Quadrant D | 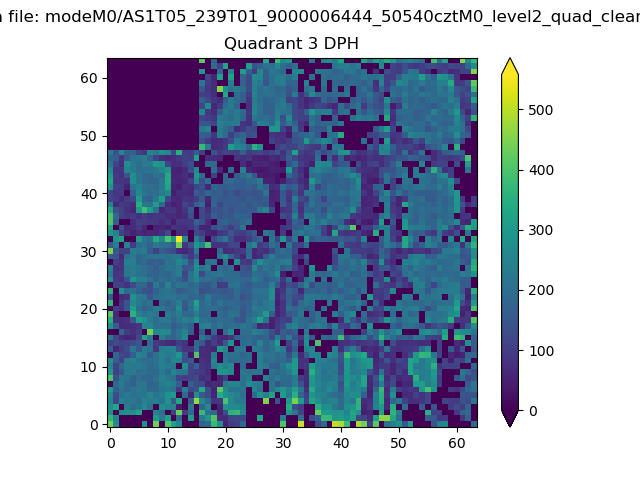 |
 |
Quadrant C |
| Plot type | Count rate plots | Images |
|---|---|---|
| Comparison with Poisson distribution Blue bars denote a histogram of data divided into 1 sec bins. Red curve is a Poisson curve with rate = median count rate of data. |
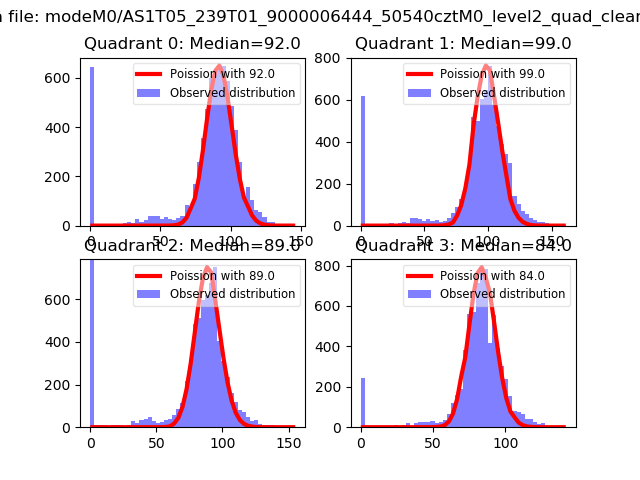 |
 |
| Quadrant-wise count rates Data is divided into 100 sec bins |
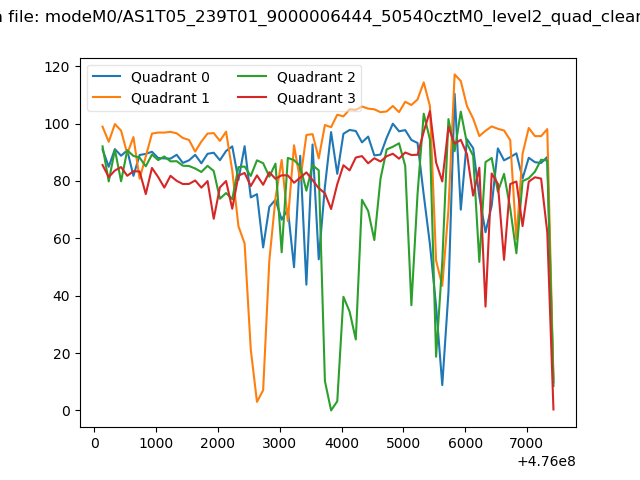 |
|
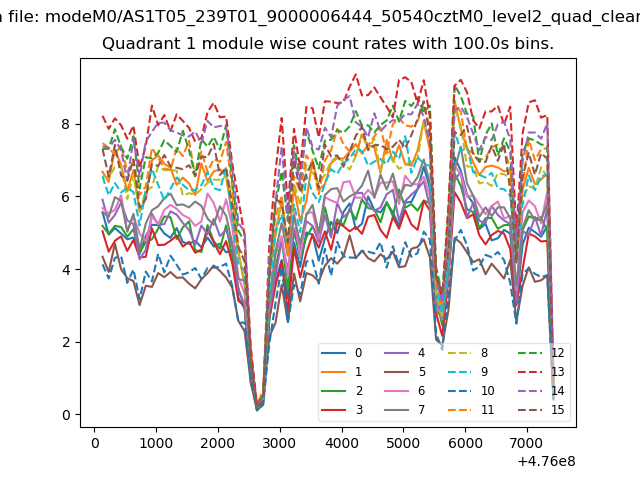
| Module-wise count rates for Quadrant A Data is divided into 100 sec bins |
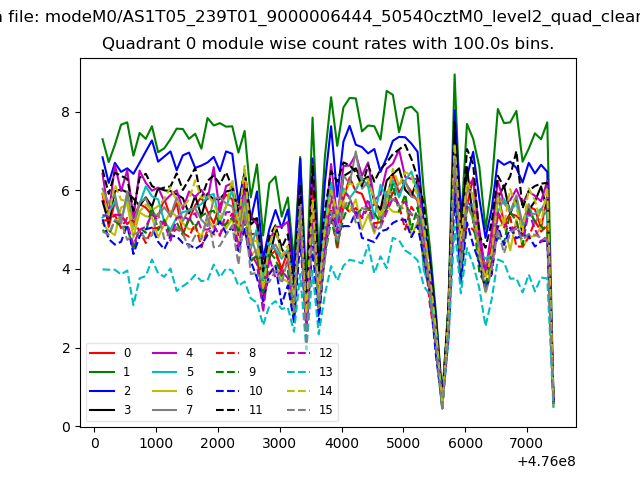 |
 |
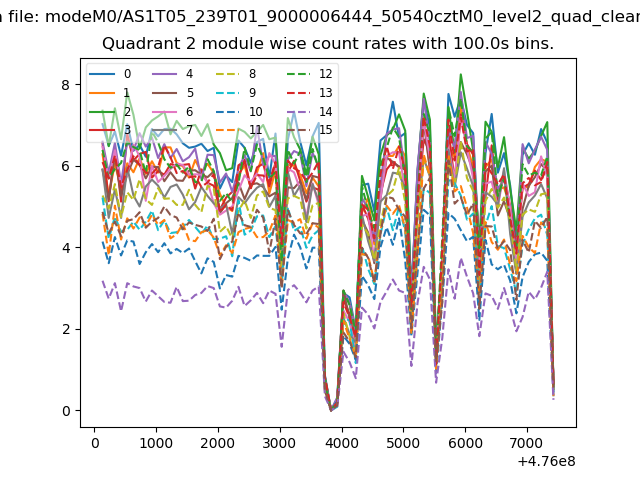
| Module-wise count rates for Quadrant B Data is divided into 100 sec bins |
 |
 |
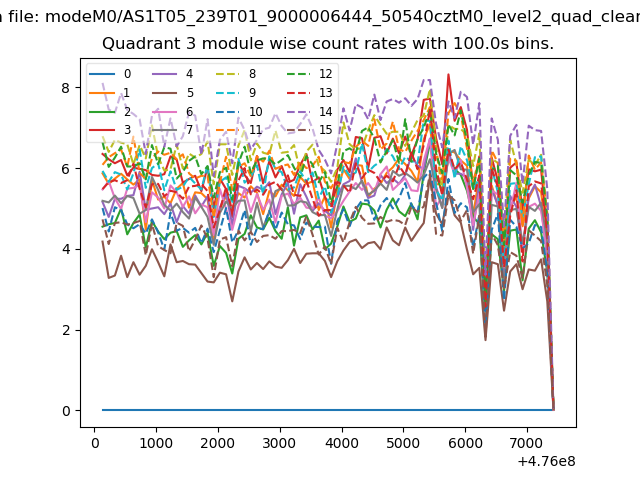
| Module-wise count rates for Quadrant C Data is divided into 100 sec bins |
 |
 |
| Module-wise count rates for Quadrant D Data is divided into 100 sec bins |
 |
 |
| Parameter | Plot |
|---|---|
| CZT HV Monitor | 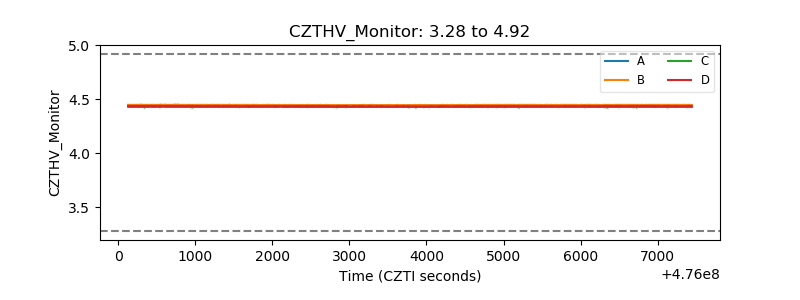 |
| D_VDD | 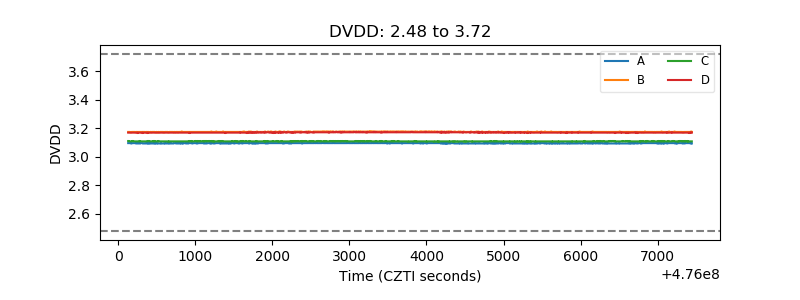 |
| Temperature 1 | 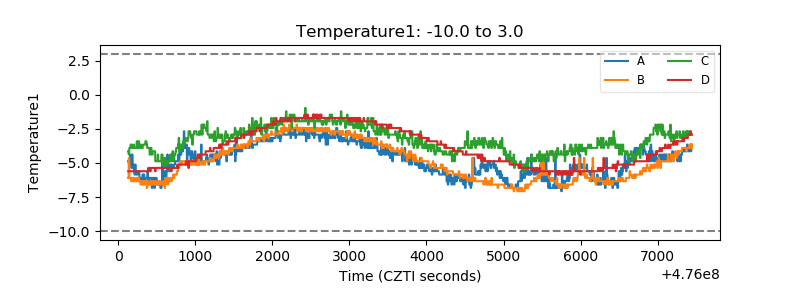 |
| Veto HV Monitor | 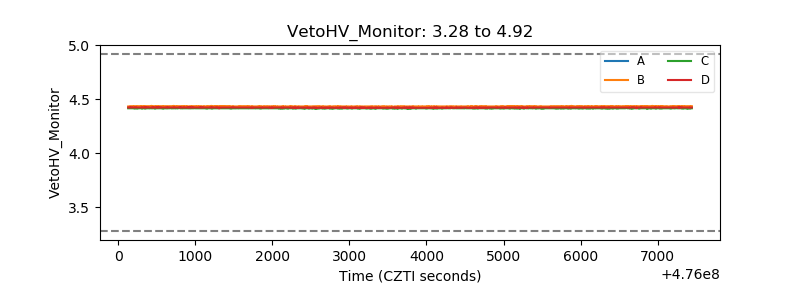 |
| Veto LLD | 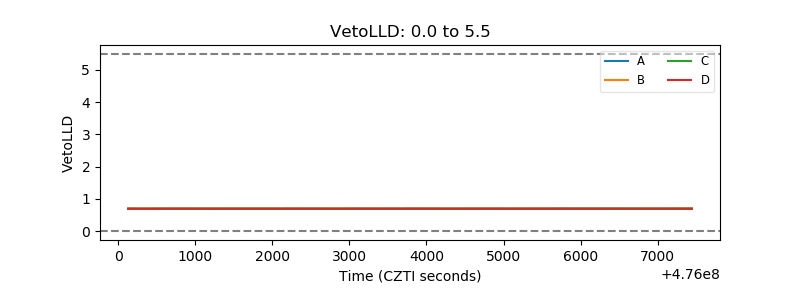 |
| Alpha Counter | 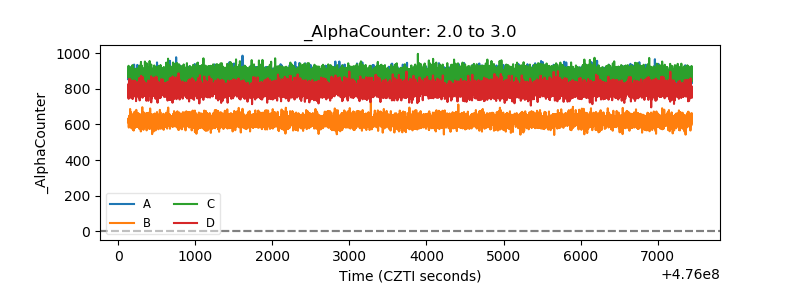 |
| _CPM_Rate | 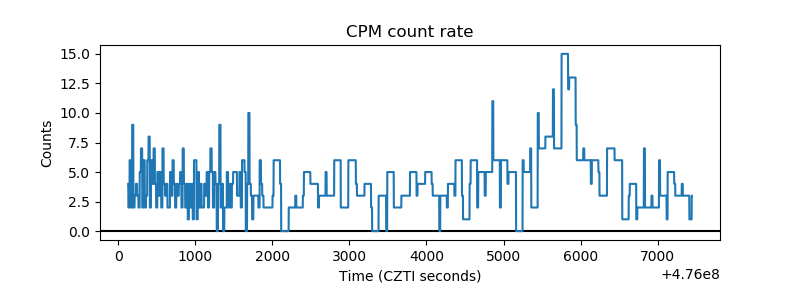 |
| CZT Counter | 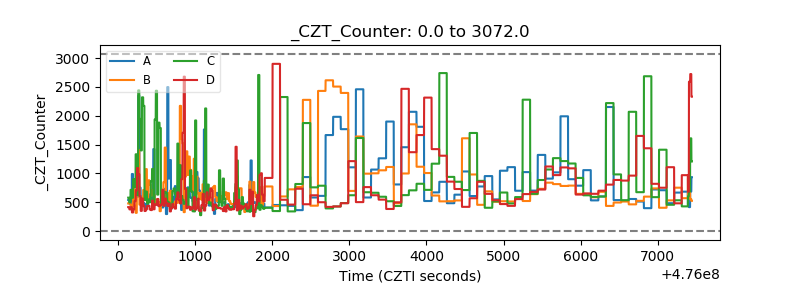 |
| +2.5 Volts monitor |  |
| +5 Volts monitor | 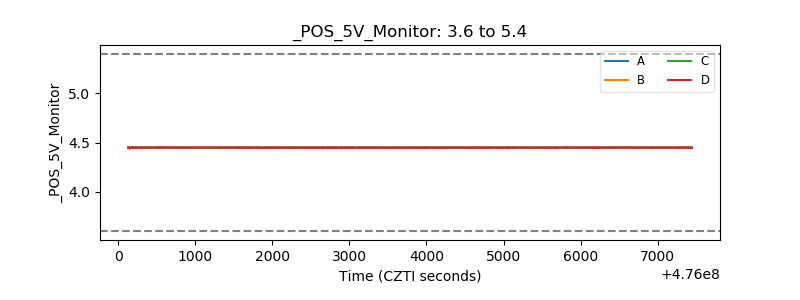 |
| _ROLL_ROT | 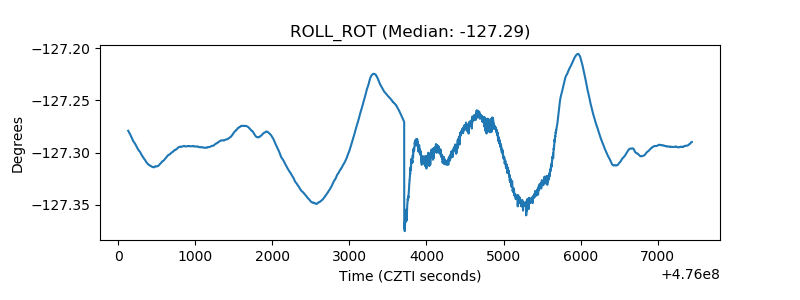 |
| _Roll_DEC | 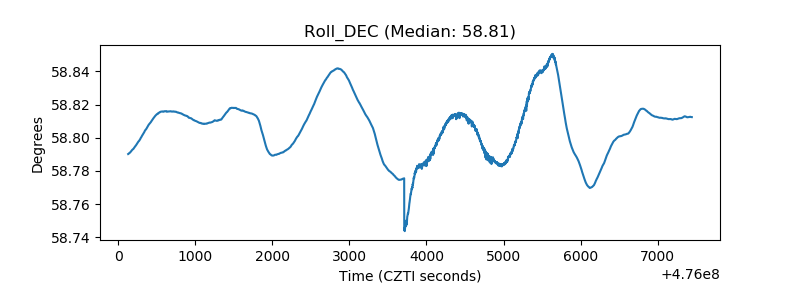 |
| _Roll_RA | 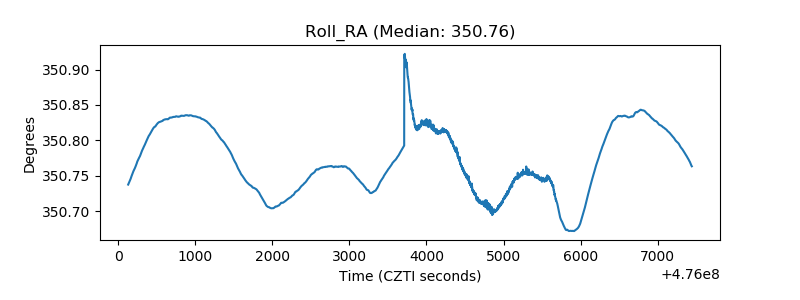 |
| Veto Counter | 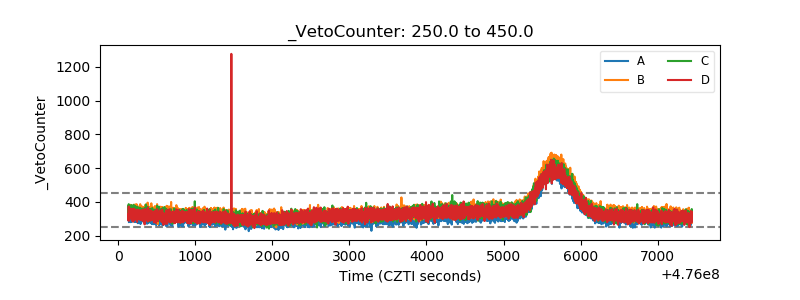 |