| Param | Original file | Final file |
|---|---|---|
| Filename | modeM0/AS1T05_239T01_9000006444_50541cztM0_level2.fits | modeM0/AS1T05_239T01_9000006444_50541cztM0_level2_quad_clean.evt |
| Size (bytes) | 950,207,040 | 92,272,320 |
| Size | 906.2 MB | 88.0 MB |
| Events in quadrant A | 6,222,237 | 644,660 |
| Events in quadrant B | 4,440,084 | 736,910 |
| Events in quadrant C | 11,991,446 | 448,571 |
| Events in quadrant D | 11,945,744 | 445,597 |
| Mode M0 | |||
|---|---|---|---|
| Quadrant | BADHDUFLAG | Total packets | Discarded packets |
| A | 0 | 23523 | 0 |
| B | 0 | 18254 | 0 |
| C | 0 | 40839 | 0 |
| D | 0 | 40666 | 5 |
| Mode SS | |||
|---|---|---|---|
| Quadrant | BADHDUFLAG | Total packets | Discarded packets |
| A | 0 | 148 | 0 |
| B | 0 | 148 | 0 |
| C | 0 | 148 | 0 |
| D | 0 | 148 | 0 |
| Quadrant | Total seconds | Saturated seconds | Saturation percentage |
|---|---|---|---|
| A | 7442 | 659 | 8.855146% |
| B | 7442 | 203 | 2.727761% |
| C | 7442 | 2755 | 37.019618% |
| D | 7441 | 2411 | 32.401559% |
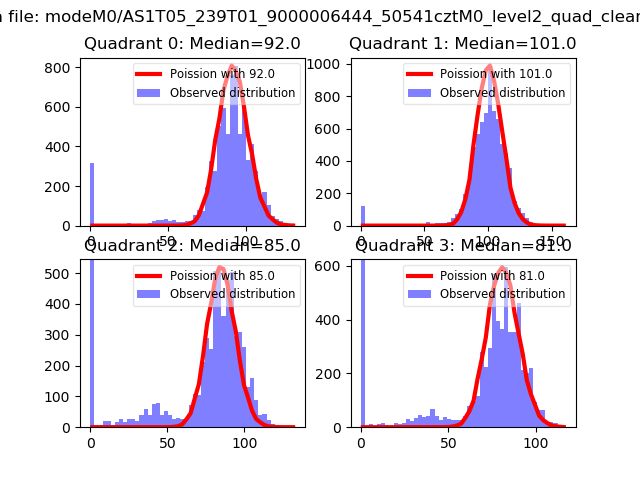
Noise dominated data is calculated using 1-second bins in cleaned event files. If a bin has >2000 counts, and if more than 50% of those come from <1% of pixels, then it is considered to be noise-dominated and hence unusable.
| Quadrant | # 1 sec bins | Bins with >0 counts | Bins with >2000 counts | High rate bins dominated by noise | Noise dominated (total time) | Noise dominated (detector-on time) | Marked lightcurve |
|---|---|---|---|---|---|---|---|
| A | 7442 | 7442 | 389 | 389 | 5.23% | 5.23% | 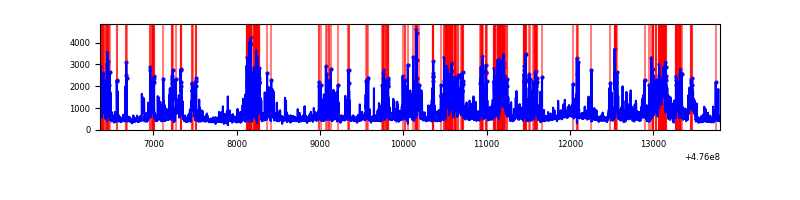 |
| B | 7442 | 7442 | 135 | 135 | 1.81% | 1.81% | 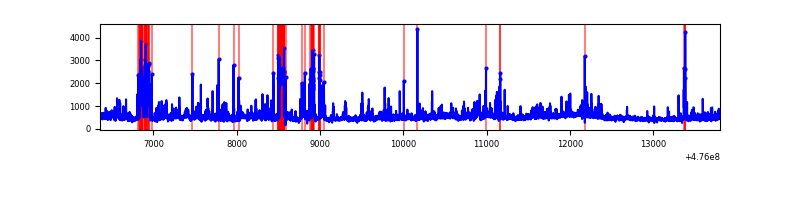 |
| C | 7442 | 7442 | 2370 | 2370 | 31.85% | 31.85% | 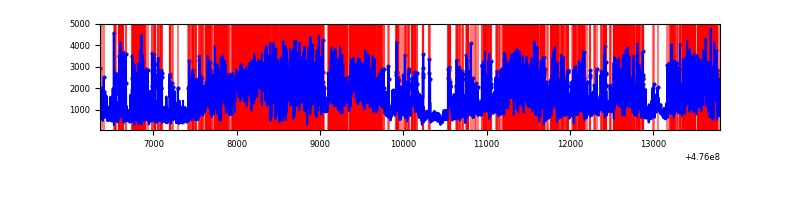 |
| D | 7440 | 7440 | 2316 | 2316 | 31.13% | 31.13% | 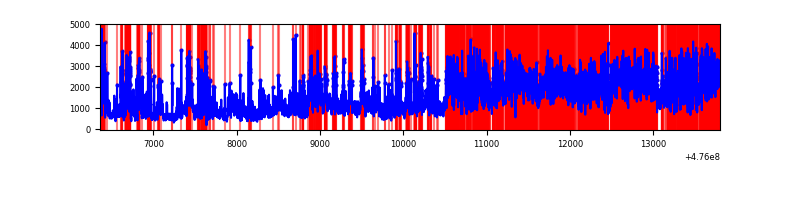 |
Top three noisy pixels from each quadrant. If the there are fewer than three noisy pixels in the level2.evt file, extra rows are filled as -1
| Pixel properties | Quadrant properties | ||||||
|---|---|---|---|---|---|---|---|
| Quadrant | DetID | PixID | Counts | Sigma | Mean | Median | Sigma |
| A | 12 | 250 | 2104574 | 11028.77 | 764 | 745 | 190.8 |
| A | 4 | 3 | 207037 | 1081.43 | 764 | 745 | 190.8 |
| A | 3 | 130 | 127957 | 666.88 | 764 | 745 | 190.8 |
| B | 4 | 170 | 340334 | 2074.01 | 771 | 745 | 163.7 |
| B | 0 | 229 | 228185 | 1389.07 | 771 | 745 | 163.7 |
| B | 5 | 172 | 197525 | 1201.82 | 771 | 745 | 163.7 |
| C | 15 | 157 | 1754089 | 9510.87 | 651 | 644 | 184.4 |
| C | 15 | 196 | 1460591 | 7918.9 | 651 | 644 | 184.4 |
| C | 4 | 12 | 1383780 | 7502.27 | 651 | 644 | 184.4 |
| D | 7 | 61 | 2859316 | 15851.38 | 649 | 628 | 180.3 |
| D | 6 | 42 | 2856767 | 15837.25 | 649 | 628 | 180.3 |
| D | 14 | 67 | 829646 | 4596.89 | 649 | 628 | 180.3 |
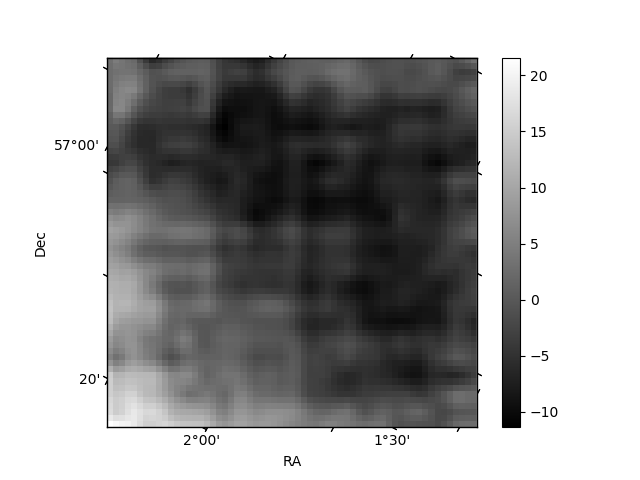
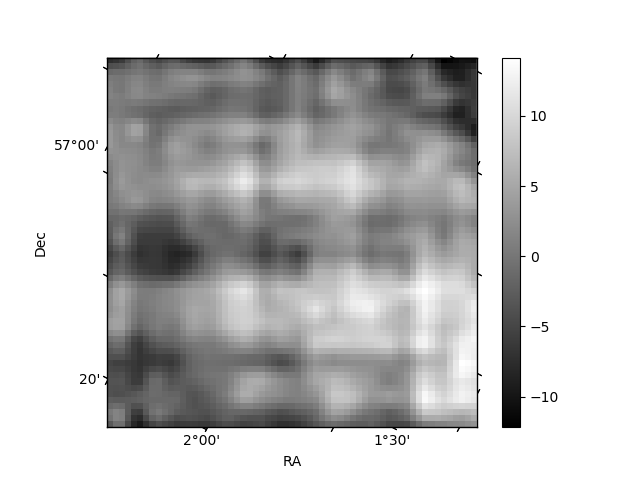
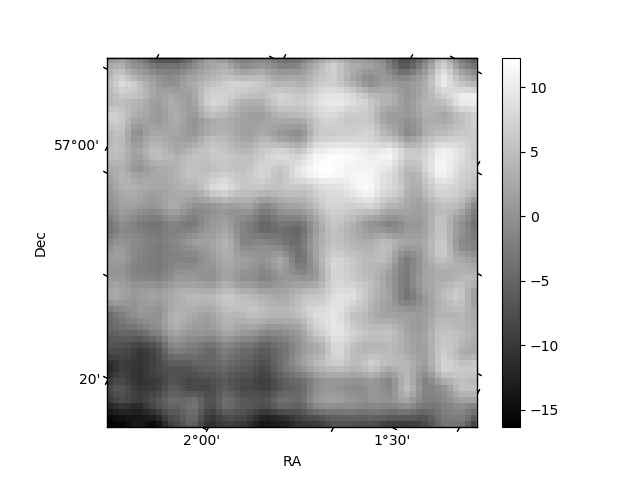
Histogram calculated using DETX and DETY for each event in the final _common_clean file
| Quadrant A | 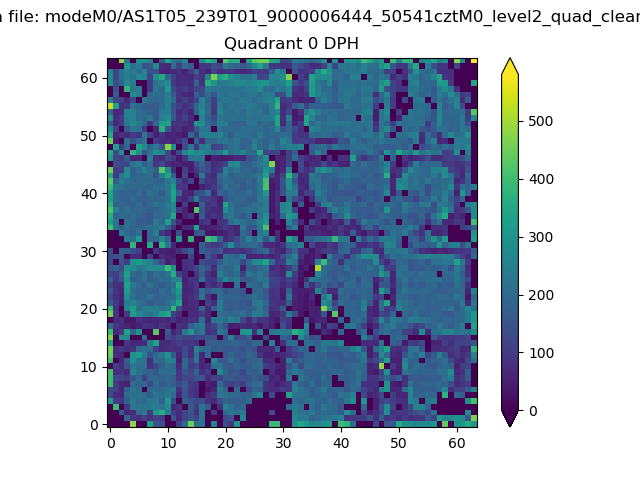 |
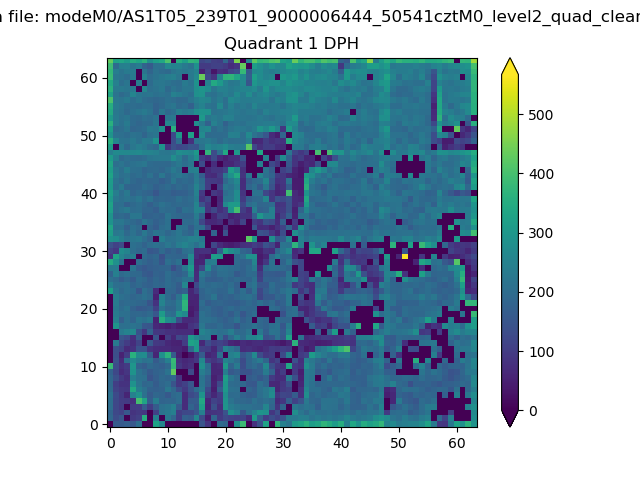 |
Quadrant B |
|---|---|---|---|
| Quadrant D |  |
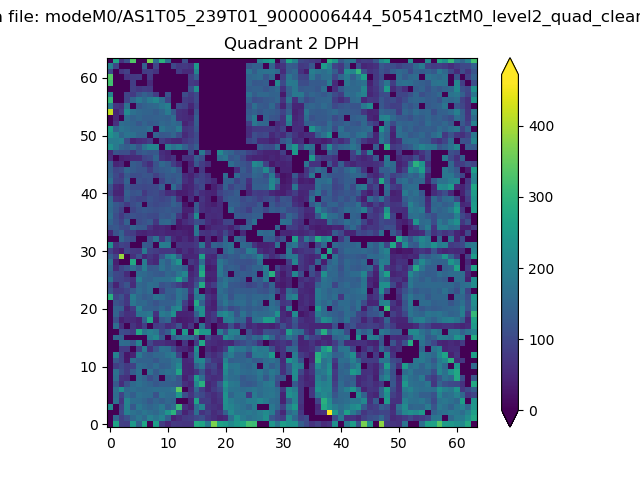 |
Quadrant C |
| Plot type | Count rate plots | Images |
|---|---|---|
| Comparison with Poisson distribution Blue bars denote a histogram of data divided into 1 sec bins. Red curve is a Poisson curve with rate = median count rate of data. |
 |
 |
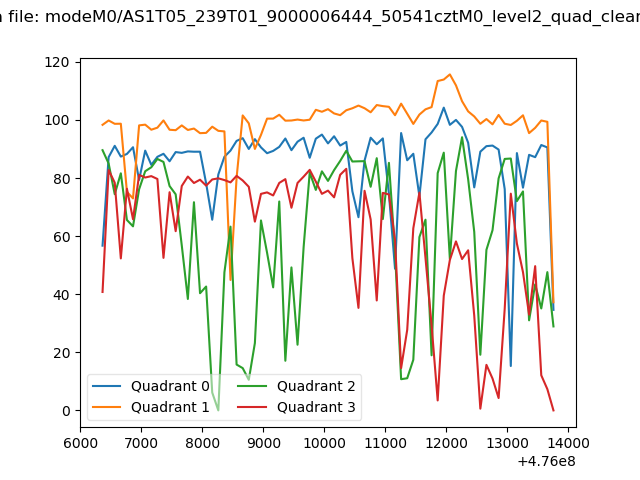
| Quadrant-wise count rates Data is divided into 100 sec bins |
 |
|
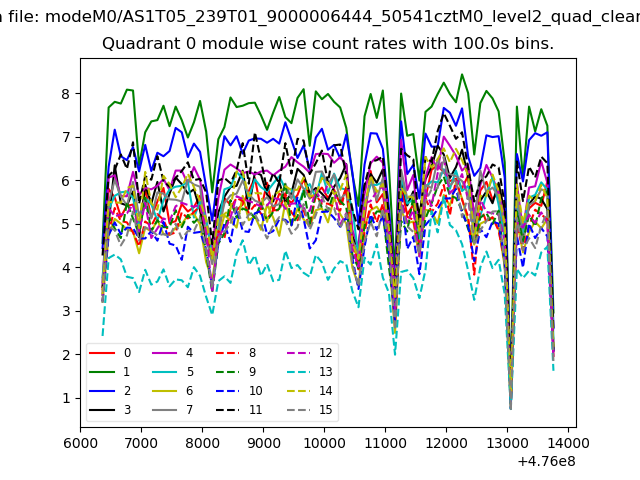
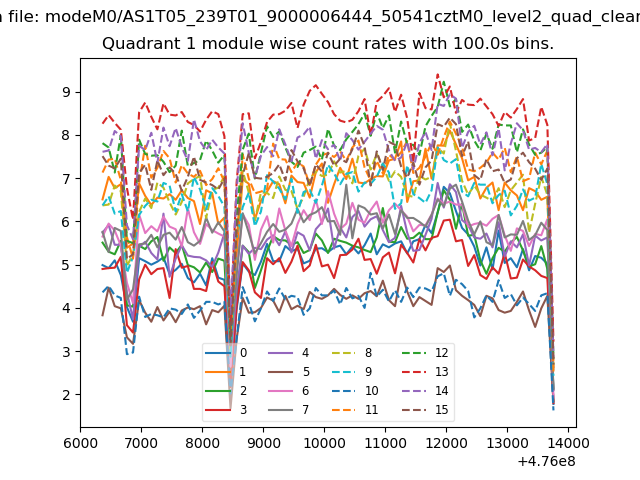
| Module-wise count rates for Quadrant A Data is divided into 100 sec bins |
 |
 |
| Module-wise count rates for Quadrant B Data is divided into 100 sec bins |
 |
 |
| Module-wise count rates for Quadrant C Data is divided into 100 sec bins |
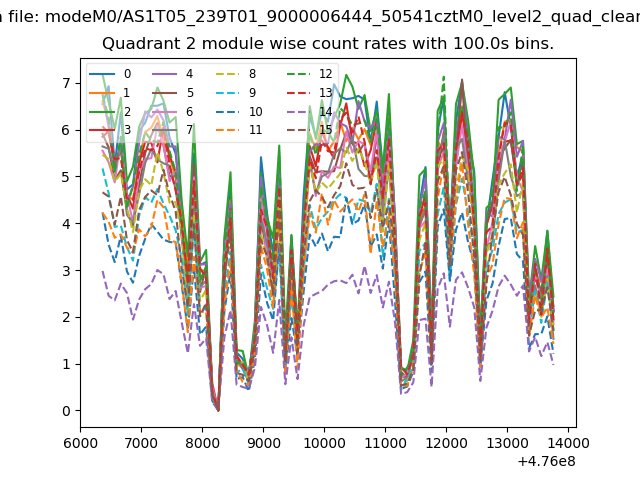 |
 |
| Module-wise count rates for Quadrant D Data is divided into 100 sec bins |
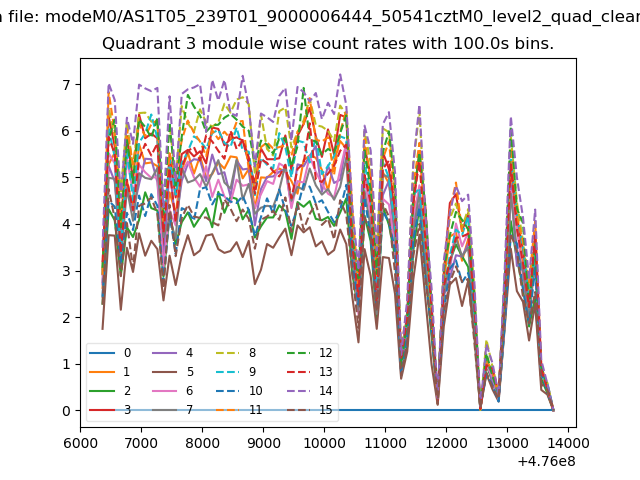 |
 |
| Parameter | Plot |
|---|---|
| CZT HV Monitor | 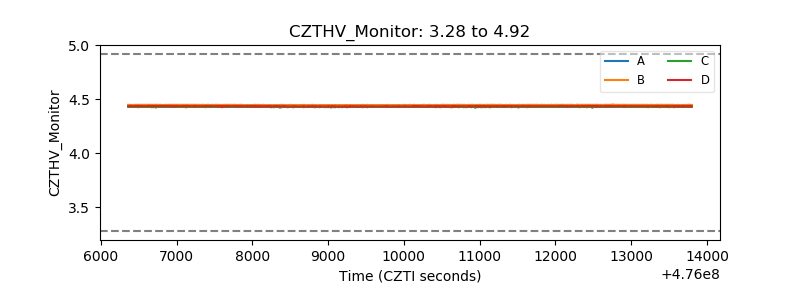 |
| D_VDD | 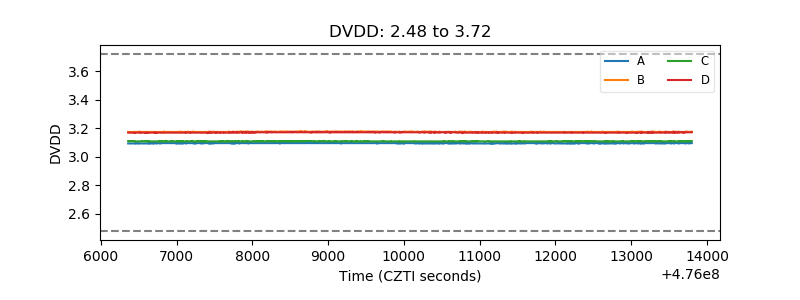 |
| Temperature 1 | 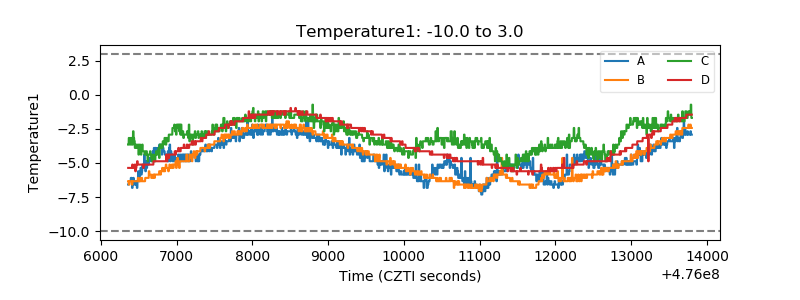 |
| Veto HV Monitor | 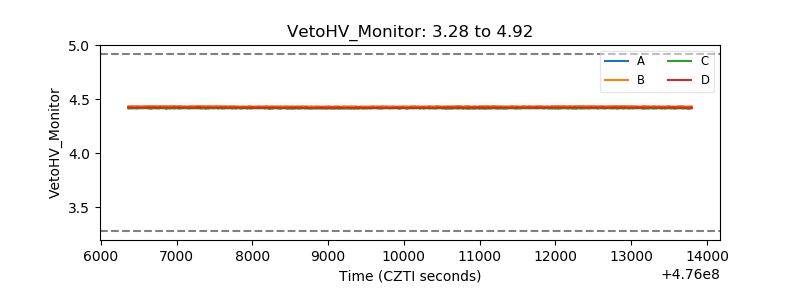 |
| Veto LLD | 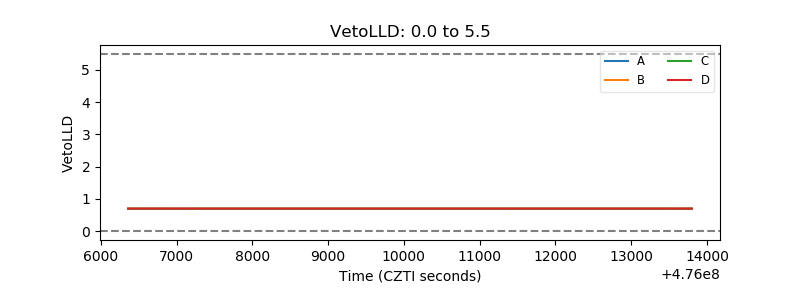 |
| Alpha Counter | 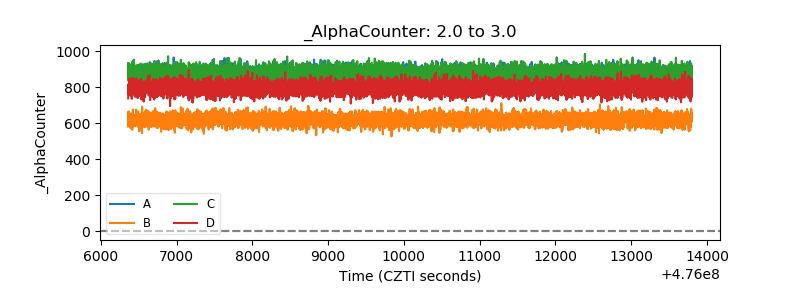 |
| _CPM_Rate | 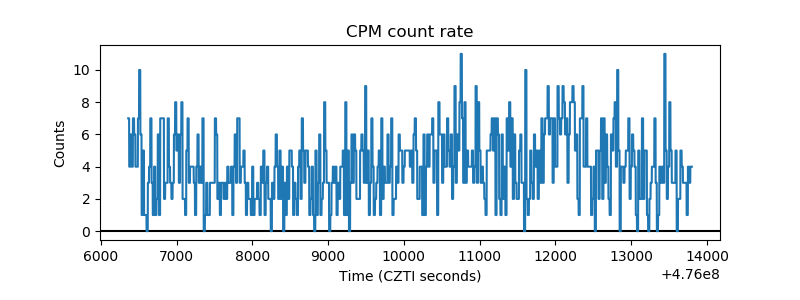 |
| CZT Counter | 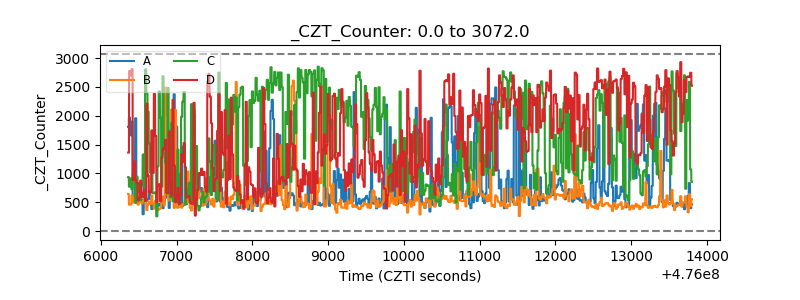 |
| +2.5 Volts monitor | 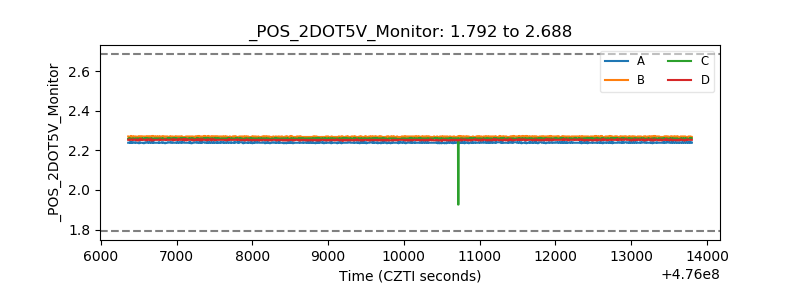 |
| +5 Volts monitor |  |
| _ROLL_ROT | 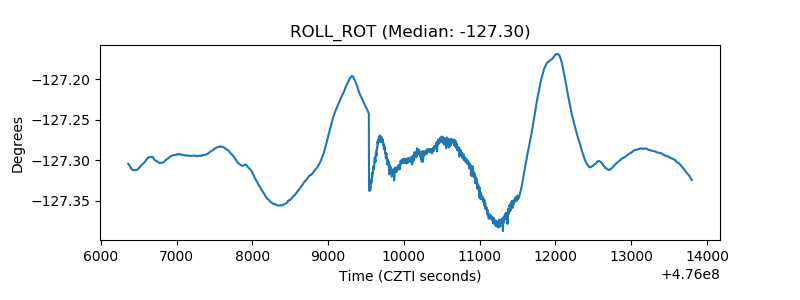 |
| _Roll_DEC | 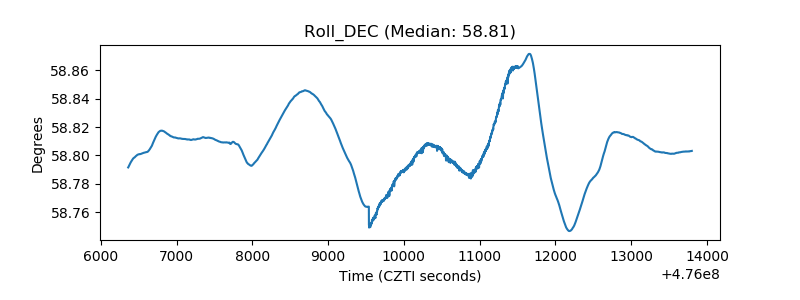 |
| _Roll_RA | 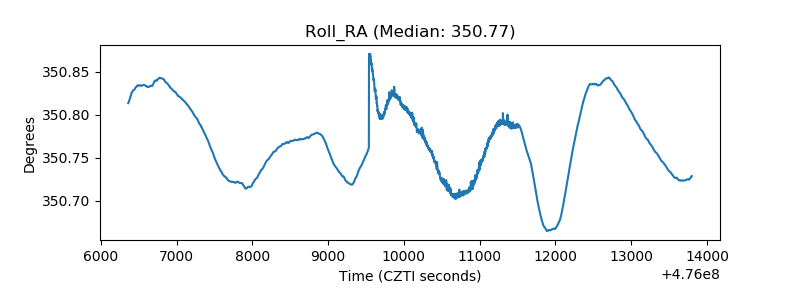 |
| Veto Counter | 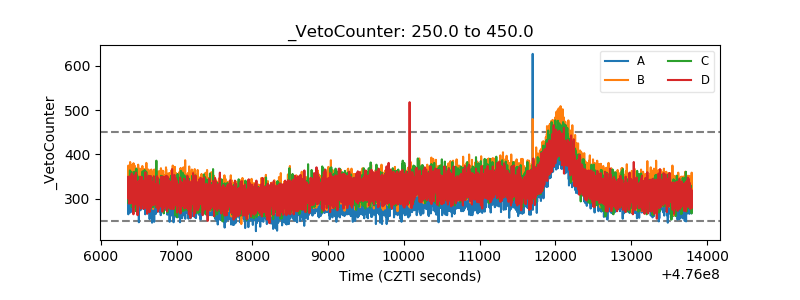 |