| Param | Original file | Final file |
|---|---|---|
| Filename | modeM0/AS1T05_239T01_9000006444_50542cztM0_level2.fits | modeM0/AS1T05_239T01_9000006444_50542cztM0_level2_quad_clean.evt |
| Size (bytes) | 1,133,789,760 | 73,082,880 |
| Size | 1.1 GB | 69.7 MB |
| Events in quadrant A | 5,735,943 | 638,325 |
| Events in quadrant B | 3,956,236 | 732,909 |
| Events in quadrant C | 15,157,452 | 167,847 |
| Events in quadrant D | 16,555,883 | 165,332 |
| Mode M0 | |||
|---|---|---|---|
| Quadrant | BADHDUFLAG | Total packets | Discarded packets |
| A | 0 | 21881 | 0 |
| B | 0 | 16624 | 0 |
| C | 0 | 50036 | 4 |
| D | 0 | 54152 | 0 |
| Mode SS | |||
|---|---|---|---|
| Quadrant | BADHDUFLAG | Total packets | Discarded packets |
| A | 0 | 146 | 0 |
| B | 0 | 146 | 0 |
| C | 0 | 146 | 0 |
| D | 0 | 146 | 0 |
| Quadrant | Total seconds | Saturated seconds | Saturation percentage |
|---|---|---|---|
| A | 7295 | 508 | 6.963674% |
| B | 7295 | 90 | 1.233722% |
| C | 7294 | 5655 | 77.529476% |
| D | 7294 | 5591 | 76.652043% |
Noise dominated data is calculated using 1-second bins in cleaned event files. If a bin has >2000 counts, and if more than 50% of those come from <1% of pixels, then it is considered to be noise-dominated and hence unusable.
| Quadrant | # 1 sec bins | Bins with >0 counts | Bins with >2000 counts | High rate bins dominated by noise | Noise dominated (total time) | Noise dominated (detector-on time) | Marked lightcurve |
|---|---|---|---|---|---|---|---|
| A | 7295 | 7295 | 348 | 348 | 4.77% | 4.77% | 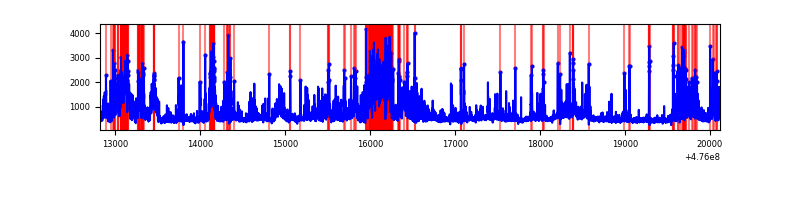 |
| B | 7295 | 7295 | 53 | 53 | 0.73% | 0.73% | 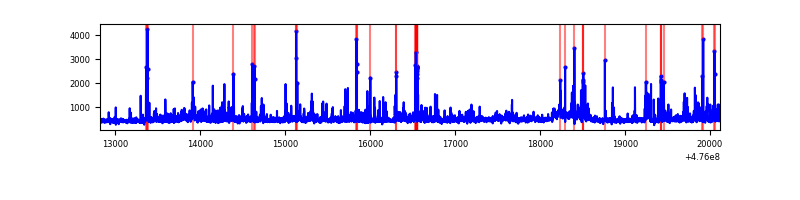 |
| C | 7294 | 7294 | 4558 | 4558 | 62.49% | 62.49% | 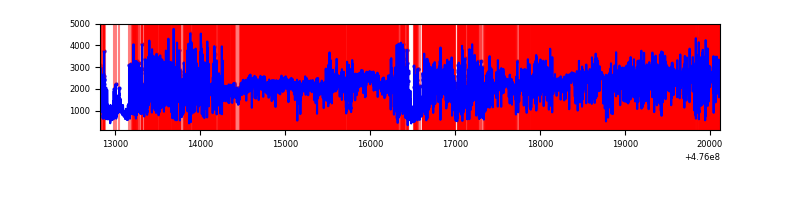 |
| D | 7293 | 7293 | 5300 | 5300 | 72.67% | 72.67% | 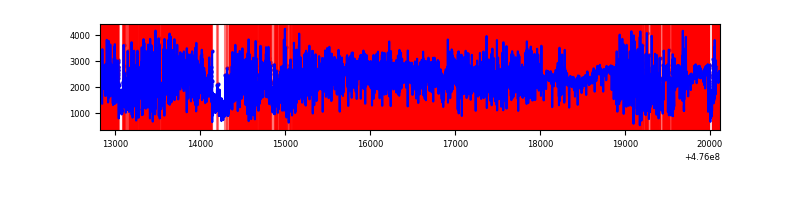 |
Top three noisy pixels from each quadrant. If the there are fewer than three noisy pixels in the level2.evt file, extra rows are filled as -1
| Pixel properties | Quadrant properties | ||||||
|---|---|---|---|---|---|---|---|
| Quadrant | DetID | PixID | Counts | Sigma | Mean | Median | Sigma |
| A | 12 | 250 | 1251135 | 6604.69 | 757 | 738 | 189.3 |
| A | 3 | 130 | 448504 | 2365.13 | 757 | 738 | 189.3 |
| A | 4 | 3 | 175699 | 924.16 | 757 | 738 | 189.3 |
| B | 4 | 170 | 166629 | 1012.71 | 763 | 738 | 163.8 |
| B | 8 | 128 | 104115 | 631.08 | 763 | 738 | 163.8 |
| B | 4 | 206 | 81825 | 495.01 | 763 | 738 | 163.8 |
| C | 15 | 157 | 3902836 | 35871.03 | 386 | 384 | 108.8 |
| C | 4 | 12 | 1654828 | 15207.52 | 386 | 384 | 108.8 |
| C | 15 | 174 | 1109454 | 10194.48 | 386 | 384 | 108.8 |
| D | 7 | 61 | 6286528 | 49255.58 | 445 | 429 | 127.6 |
| D | 15 | 184 | 2886146 | 22611.43 | 445 | 429 | 127.6 |
| D | 6 | 42 | 1582280 | 12394.81 | 445 | 429 | 127.6 |
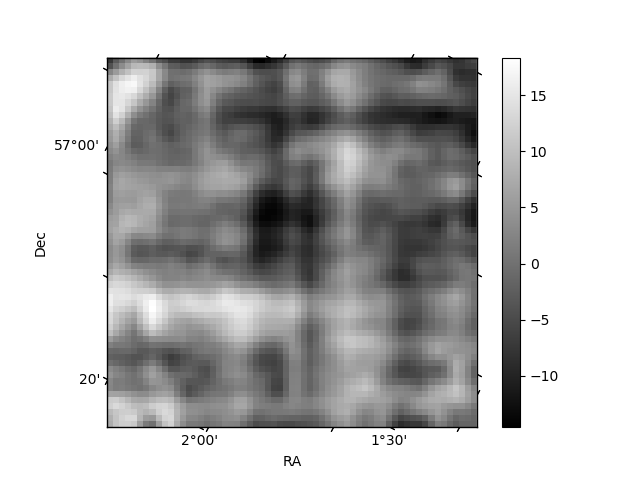
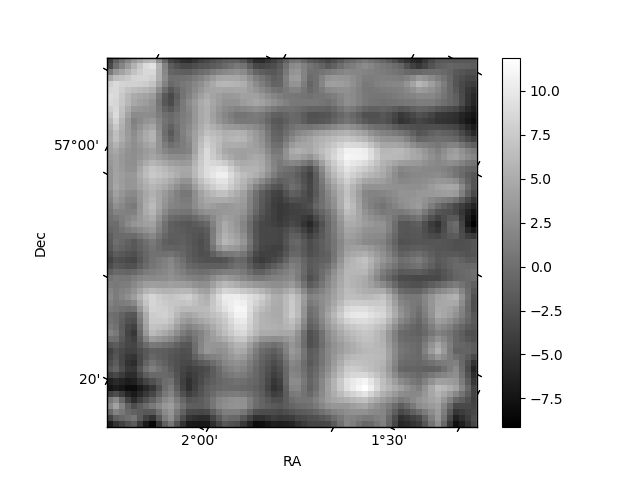
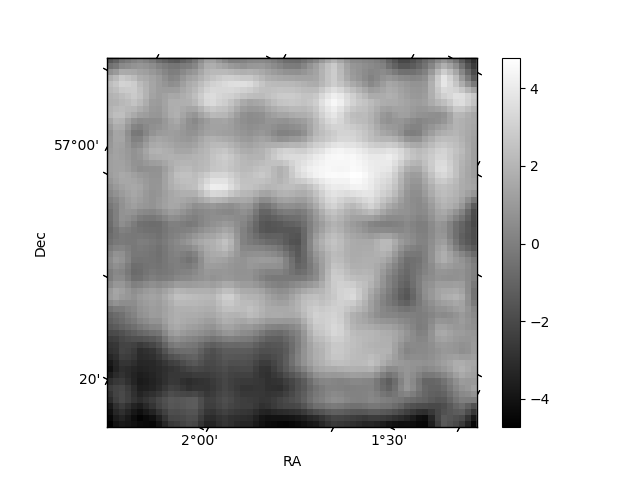
Histogram calculated using DETX and DETY for each event in the final _common_clean file
| Quadrant A | 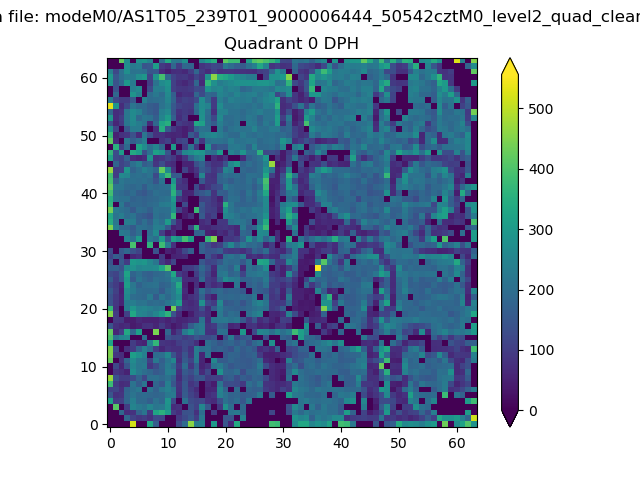 |
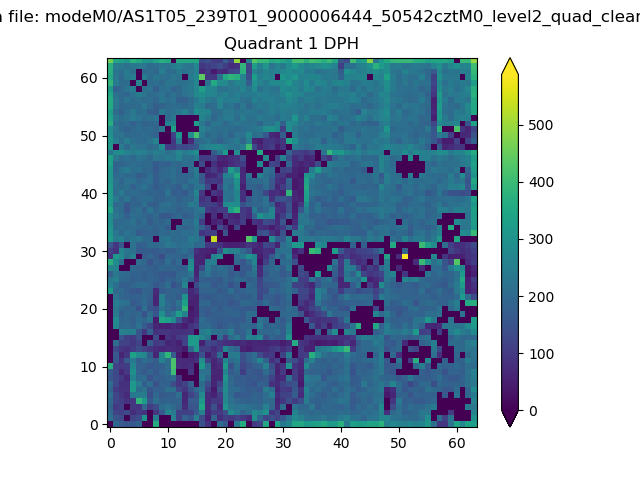 |
Quadrant B |
|---|---|---|---|
| Quadrant D |  |
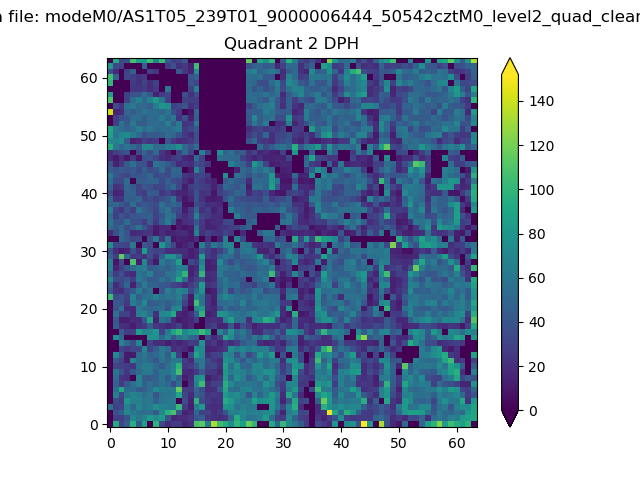 |
Quadrant C |
| Plot type | Count rate plots | Images |
|---|---|---|
| Comparison with Poisson distribution Blue bars denote a histogram of data divided into 1 sec bins. Red curve is a Poisson curve with rate = median count rate of data. |
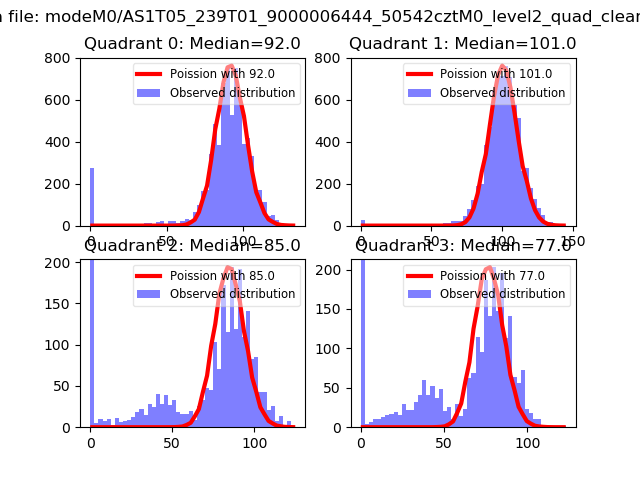 |
 |
| Quadrant-wise count rates Data is divided into 100 sec bins |
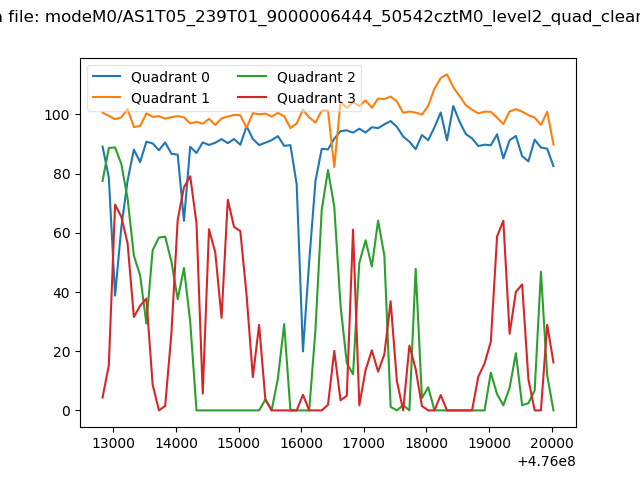 |
|
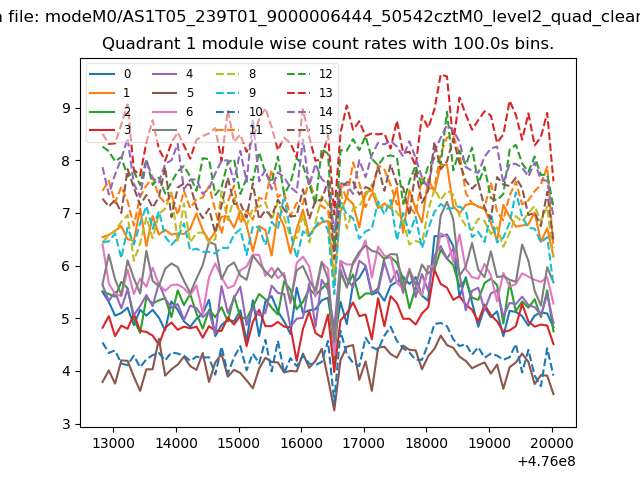
| Module-wise count rates for Quadrant A Data is divided into 100 sec bins |
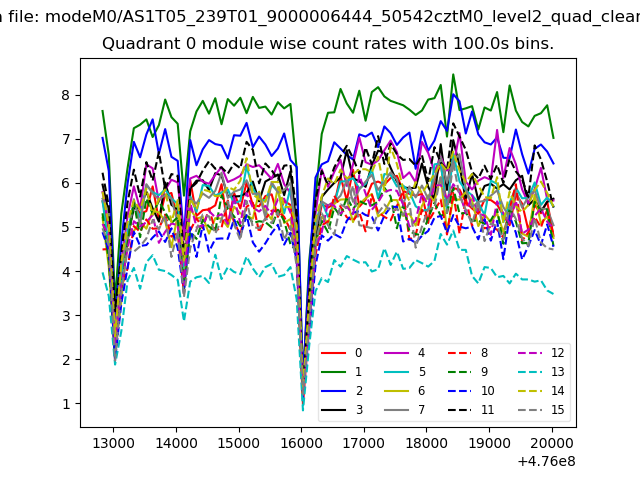 |
 |
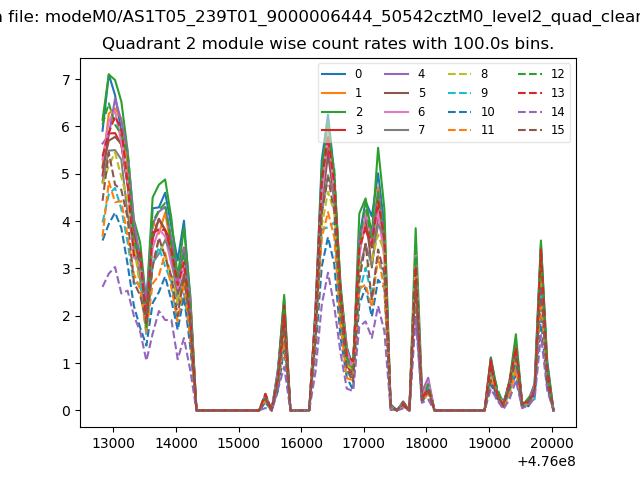
| Module-wise count rates for Quadrant B Data is divided into 100 sec bins |
 |
 |
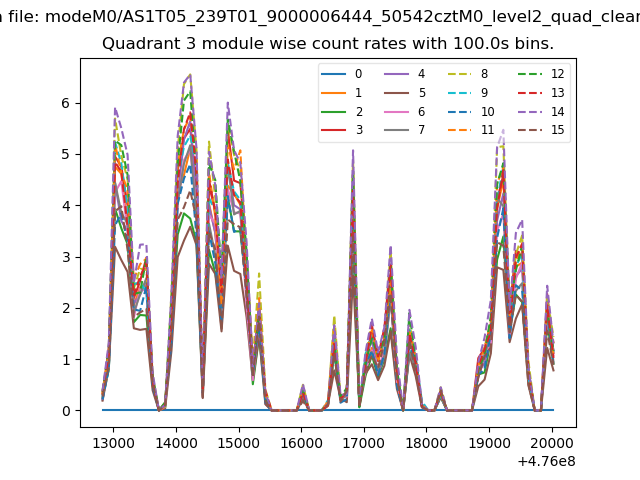
| Module-wise count rates for Quadrant C Data is divided into 100 sec bins |
 |
 |
| Module-wise count rates for Quadrant D Data is divided into 100 sec bins |
 |
 |
| Parameter | Plot |
|---|---|
| CZT HV Monitor | 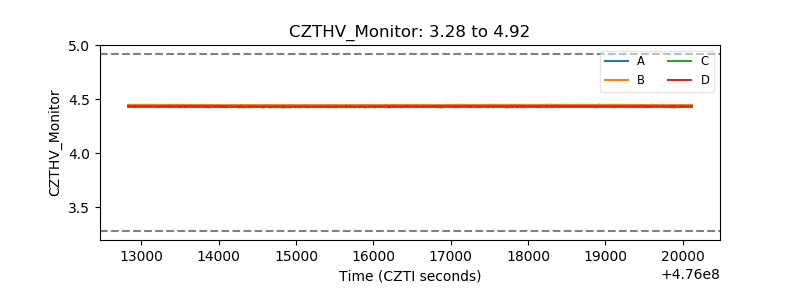 |
| D_VDD | 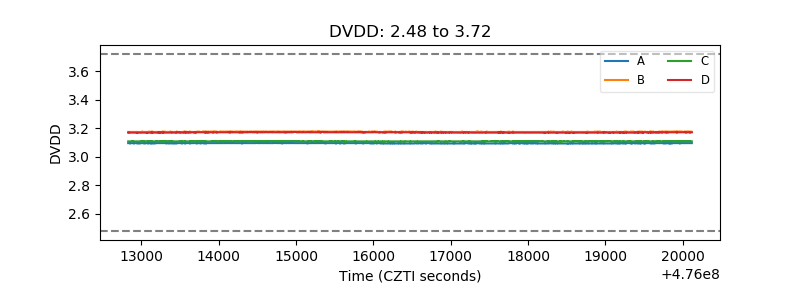 |
| Temperature 1 | 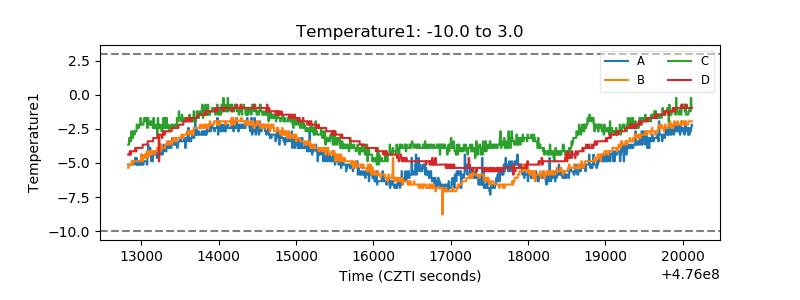 |
| Veto HV Monitor | 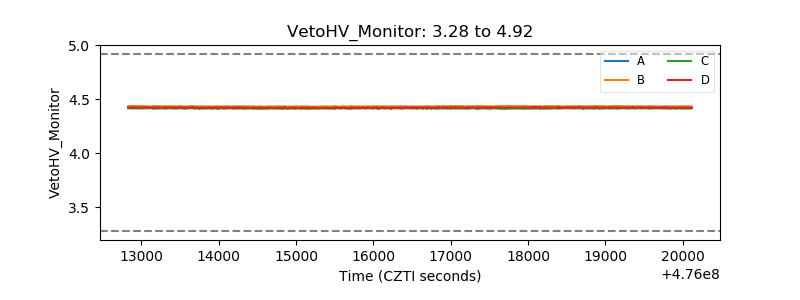 |
| Veto LLD | 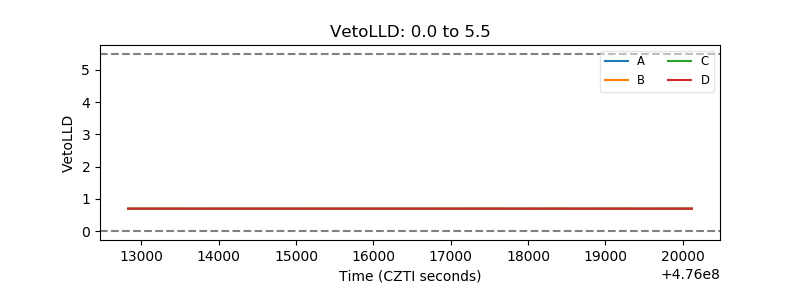 |
| Alpha Counter | 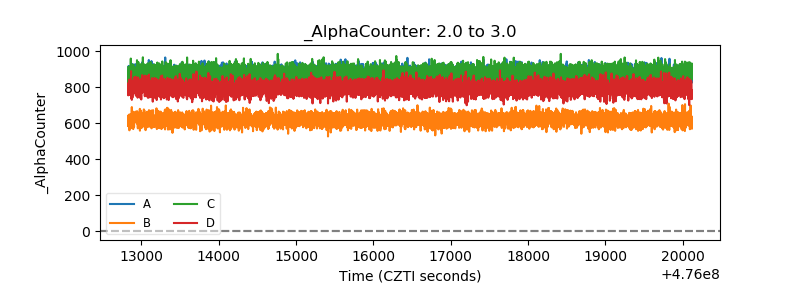 |
| _CPM_Rate | 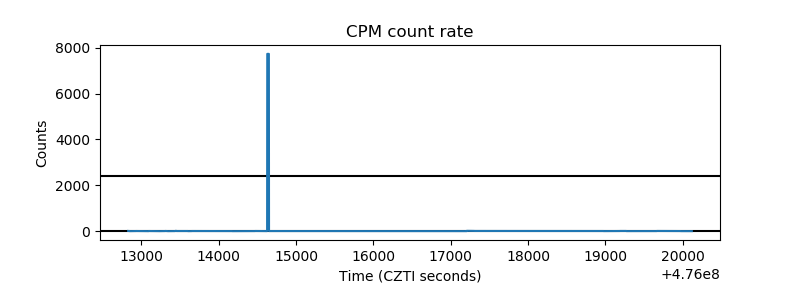 |
| CZT Counter | 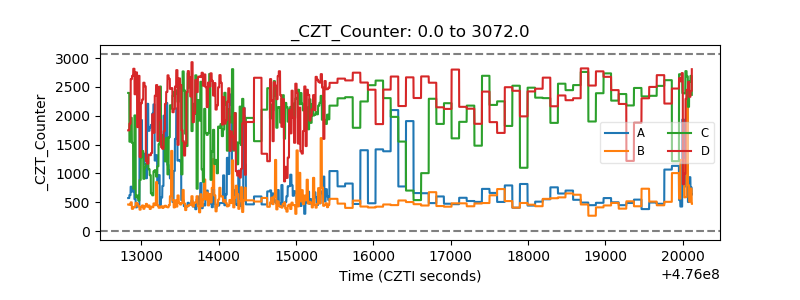 |
| +2.5 Volts monitor | 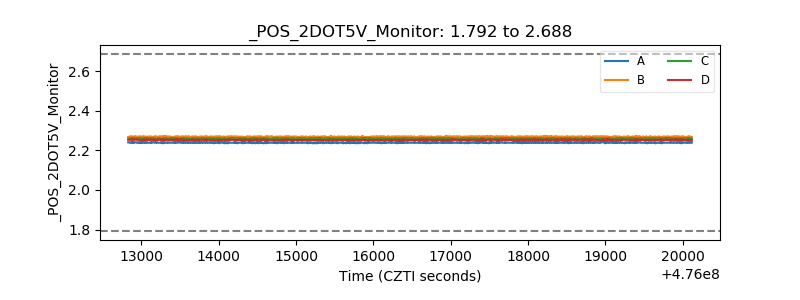 |
| +5 Volts monitor |  |
| _ROLL_ROT | 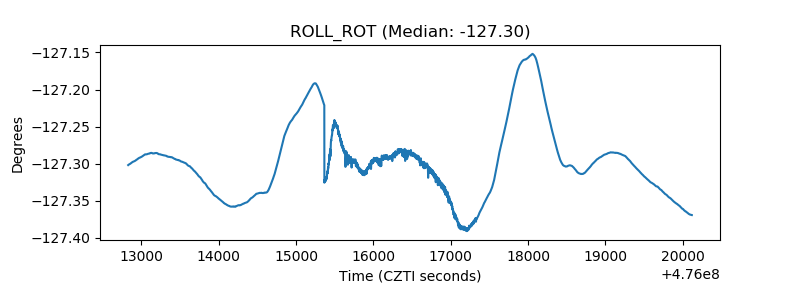 |
| _Roll_DEC | 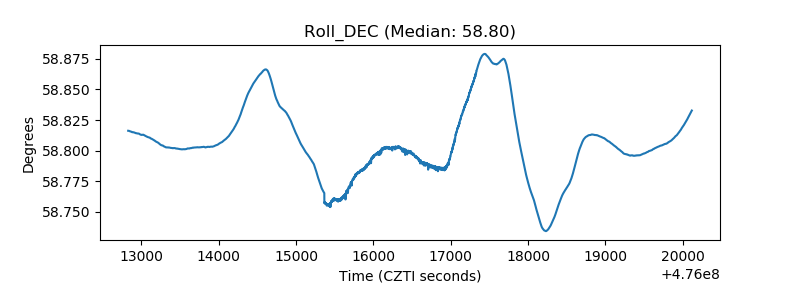 |
| _Roll_RA | 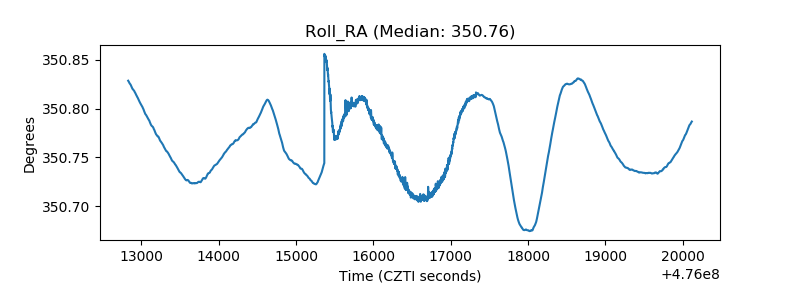 |
| Veto Counter | 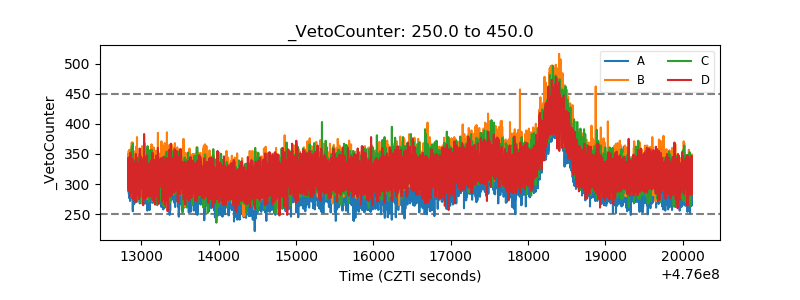 |