| Param | Original file | Final file |
|---|---|---|
| Filename | modeM0/AS1T05_239T01_9000006444_50545cztM0_level2.fits | modeM0/AS1T05_239T01_9000006444_50545cztM0_level2_quad_clean.evt |
| Size (bytes) | 2,772,898,560 | 186,531,840 |
| Size | 2.6 GB | 177.9 MB |
| Events in quadrant A | 17,423,366 | 1,444,062 |
| Events in quadrant B | 13,494,125 | 1,729,033 |
| Events in quadrant C | 34,346,288 | 618,613 |
| Events in quadrant D | 35,957,553 | 580,463 |
| Mode M0 | |||
|---|---|---|---|
| Quadrant | BADHDUFLAG | Total packets | Discarded packets |
| A | 0 | 64243 | 2 |
| B | 0 | 52717 | 2 |
| C | 0 | 114714 | 6 |
| D | 0 | 119436 | 2 |
| Mode M9 | |||
|---|---|---|---|
| Quadrant | BADHDUFLAG | Total packets | Discarded packets |
| A | 0 | 9 | 0 |
| B | 0 | 9 | 0 |
| C | 0 | 9 | 0 |
| D | 0 | 9 | 0 |
| Mode SS | |||
|---|---|---|---|
| Quadrant | BADHDUFLAG | Total packets | Discarded packets |
| A | 0 | 374 | 0 |
| B | 0 | 374 | 0 |
| C | 0 | 374 | 0 |
| D | 0 | 374 | 0 |
| Quadrant | Total seconds | Saturated seconds | Saturation percentage |
|---|---|---|---|
| A | 18487 | 2710 | 14.658950% |
| B | 18488 | 1298 | 7.020770% |
| C | 18487 | 12154 | 65.743495% |
| D | 18487 | 11928 | 64.521015% |
Noise dominated data is calculated using 1-second bins in cleaned event files. If a bin has >2000 counts, and if more than 50% of those come from <1% of pixels, then it is considered to be noise-dominated and hence unusable.
| Quadrant | # 1 sec bins | Bins with >0 counts | Bins with >2000 counts | High rate bins dominated by noise | Noise dominated (total time) | Noise dominated (detector-on time) | Marked lightcurve |
|---|---|---|---|---|---|---|---|
| A | 19397 | 18488 | 1765 | 1765 | 9.10% | 9.55% | 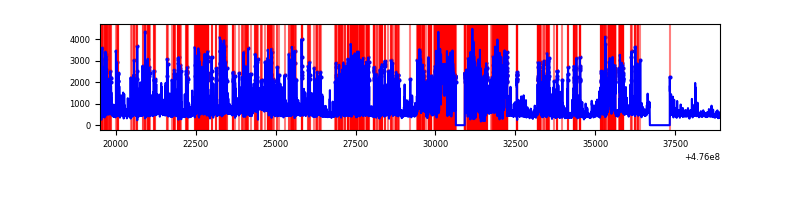 |
| B | 19398 | 18489 | 769 | 769 | 3.96% | 4.16% | 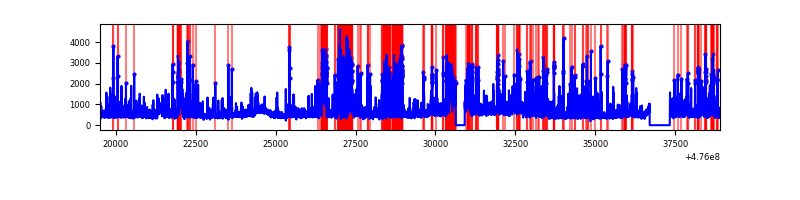 |
| C | 19396 | 18488 | 9948 | 9948 | 51.29% | 53.81% | 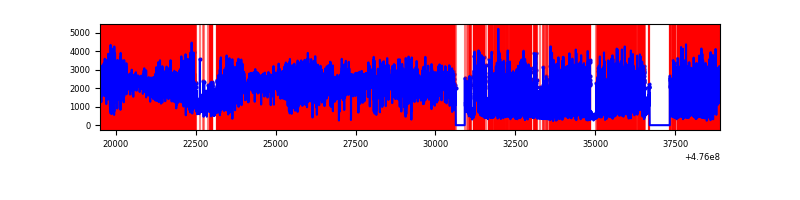 |
| D | 19397 | 18488 | 11075 | 11075 | 57.10% | 59.90% | 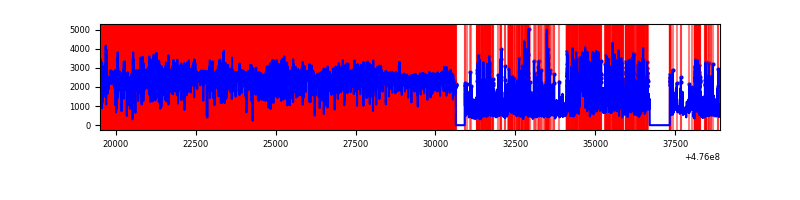 |
Top three noisy pixels from each quadrant. If the there are fewer than three noisy pixels in the level2.evt file, extra rows are filled as -1
| Pixel properties | Quadrant properties | ||||||
|---|---|---|---|---|---|---|---|
| Quadrant | DetID | PixID | Counts | Sigma | Mean | Median | Sigma |
| A | 4 | 249 | 3843916 | 8445.38 | 1835 | 1791 | 454.9 |
| A | 12 | 250 | 1918606 | 4213.35 | 1835 | 1791 | 454.9 |
| A | 4 | 156 | 1176009 | 2581.05 | 1835 | 1791 | 454.9 |
| B | 4 | 170 | 2892364 | 7076.82 | 1932 | 1866 | 408.4 |
| B | 0 | 229 | 375828 | 915.57 | 1932 | 1866 | 408.4 |
| B | 4 | 206 | 319616 | 777.95 | 1932 | 1866 | 408.4 |
| C | 15 | 178 | 5783642 | 16853.13 | 1205 | 1192 | 343.1 |
| C | 0 | 225 | 4162399 | 12127.97 | 1205 | 1192 | 343.1 |
| C | 15 | 157 | 3522313 | 10262.42 | 1205 | 1192 | 343.1 |
| D | 7 | 61 | 10961215 | 32279.75 | 1189 | 1146 | 339.5 |
| D | 15 | 184 | 9862682 | 29044.34 | 1189 | 1146 | 339.5 |
| D | 6 | 42 | 1497388 | 4406.75 | 1189 | 1146 | 339.5 |
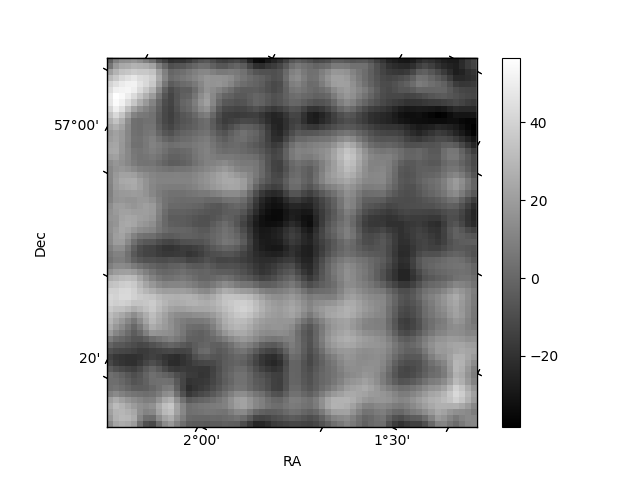
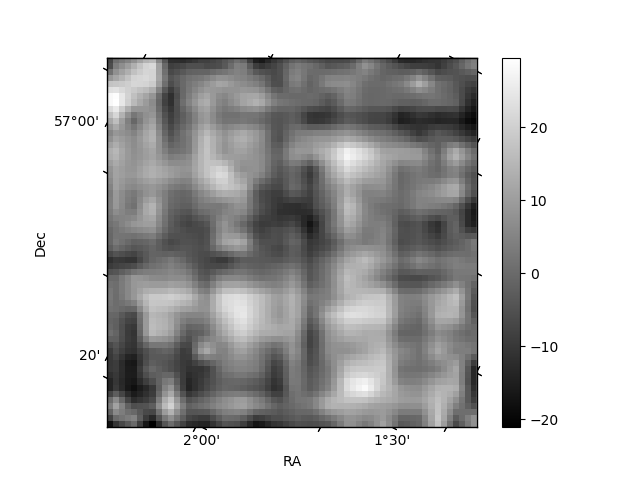
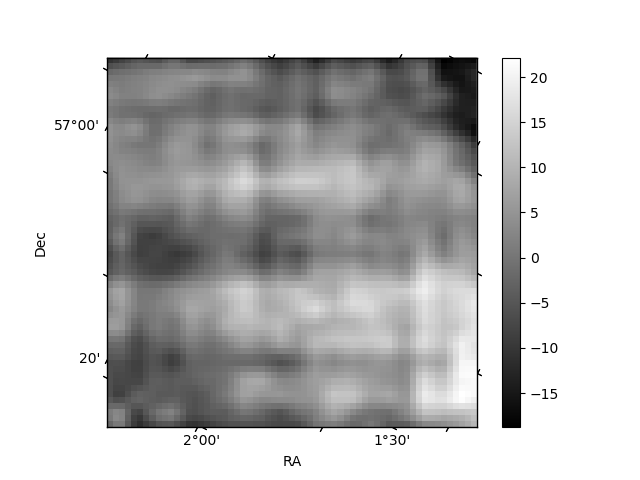
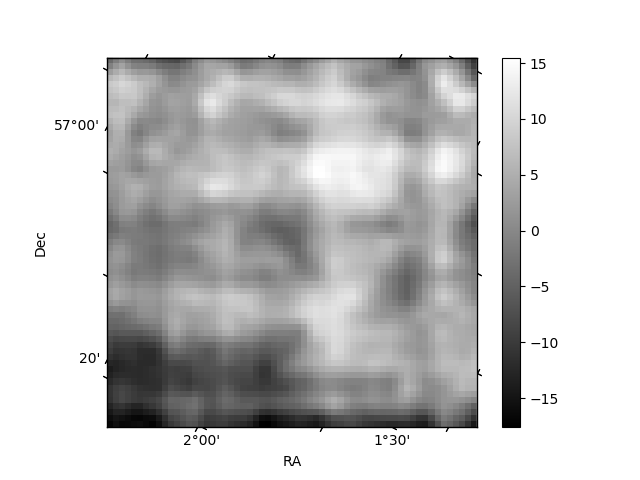
Histogram calculated using DETX and DETY for each event in the final _common_clean file
| Quadrant A | 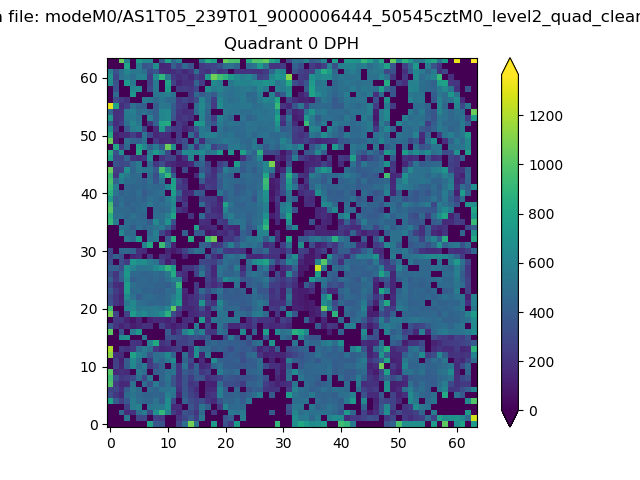 |
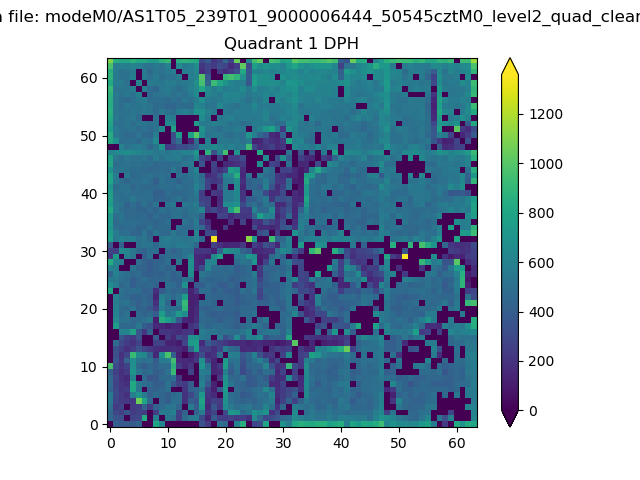 |
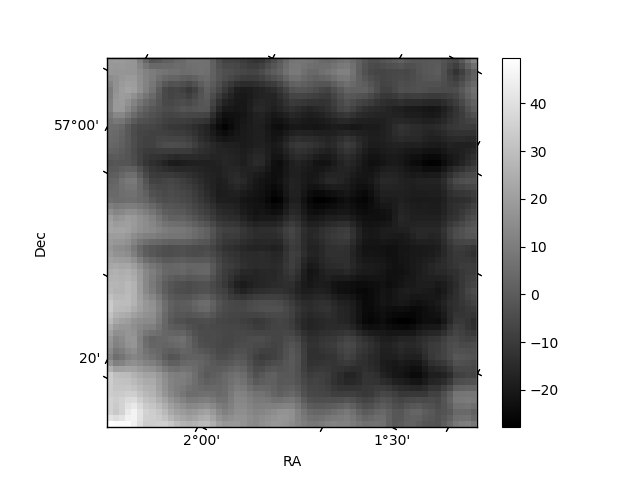
Quadrant B |
|---|---|---|---|
| Quadrant D | 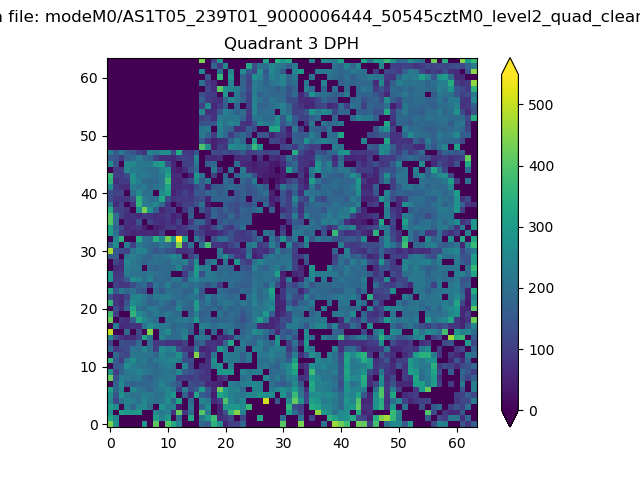 |
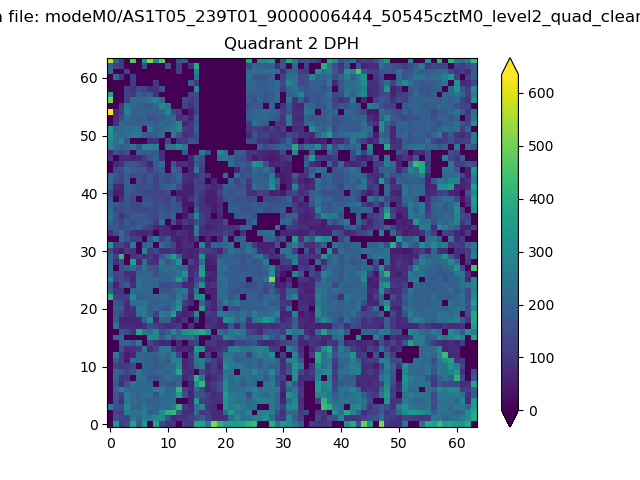 |
Quadrant C |
| Plot type | Count rate plots | Images |
|---|---|---|
| Comparison with Poisson distribution Blue bars denote a histogram of data divided into 1 sec bins. Red curve is a Poisson curve with rate = median count rate of data. |
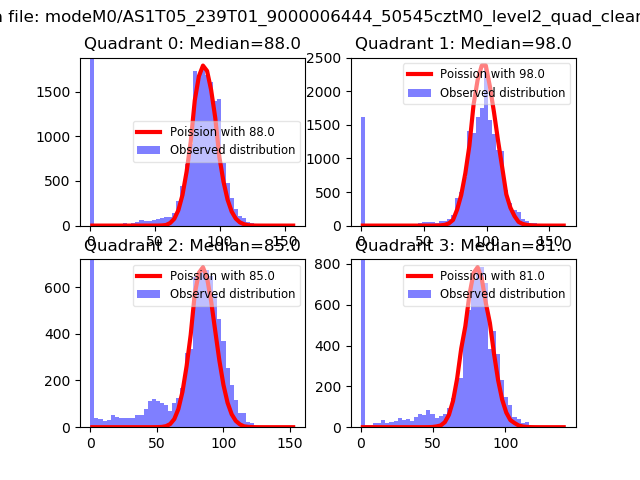 |
 |
| Quadrant-wise count rates Data is divided into 100 sec bins |
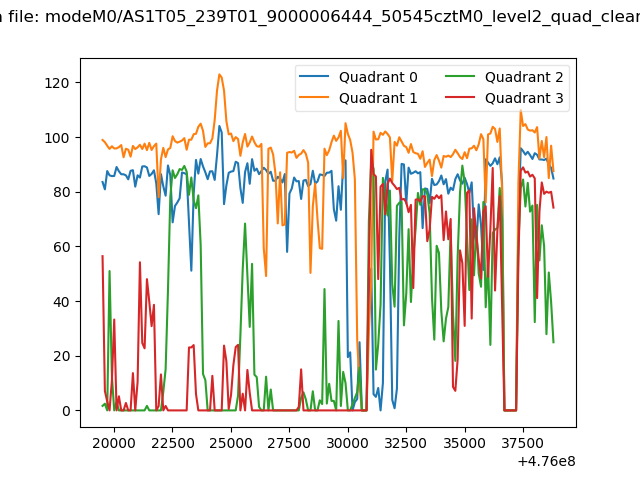 |
|
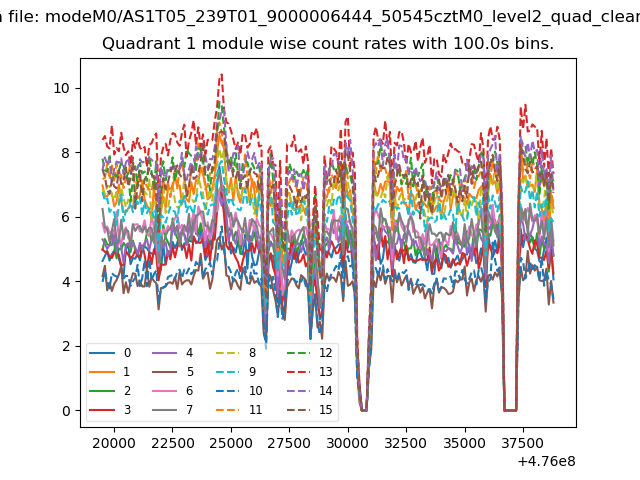
| Module-wise count rates for Quadrant A Data is divided into 100 sec bins |
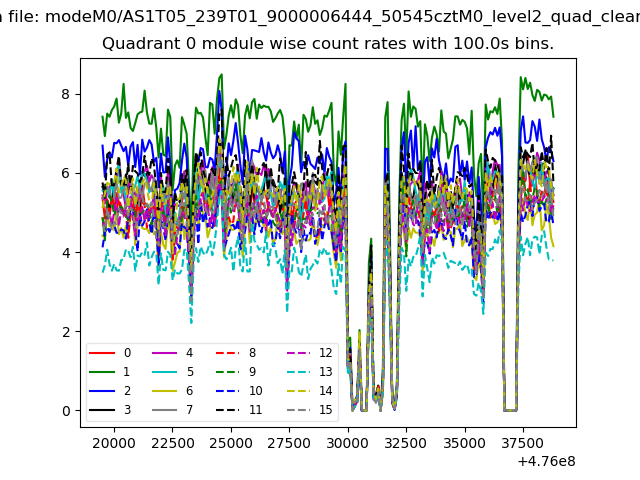 |
 |
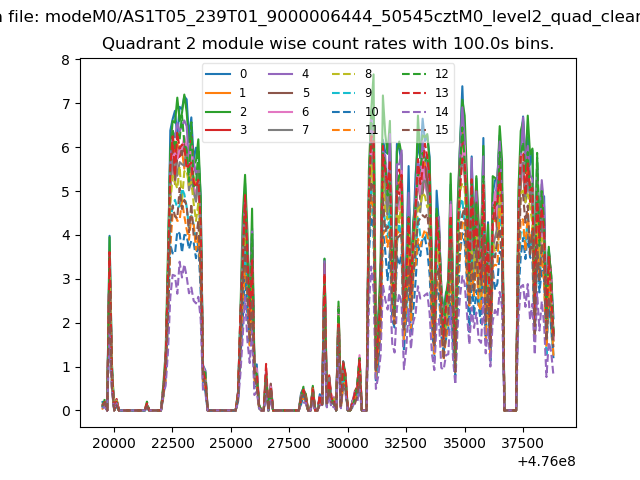
| Module-wise count rates for Quadrant B Data is divided into 100 sec bins |
 |
 |
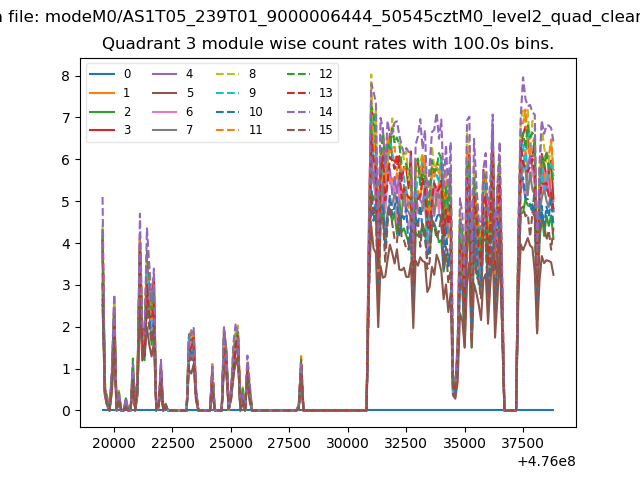
| Module-wise count rates for Quadrant C Data is divided into 100 sec bins |
 |
 |
| Module-wise count rates for Quadrant D Data is divided into 100 sec bins |
 |
 |
| Parameter | Plot |
|---|---|
| CZT HV Monitor | 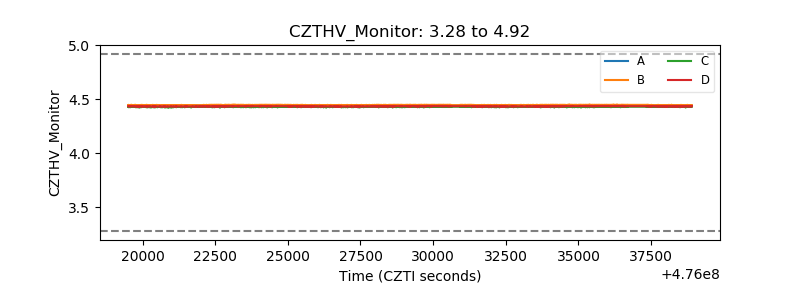 |
| D_VDD | 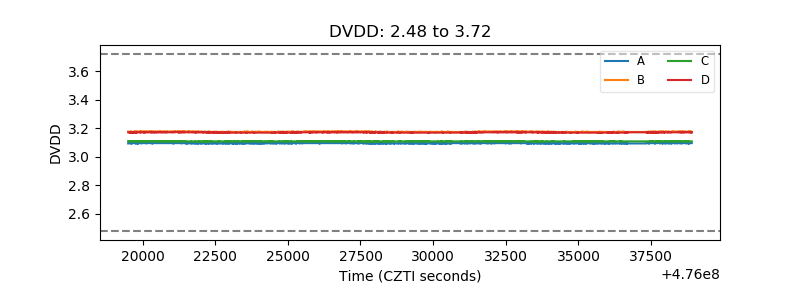 |
| Temperature 1 | 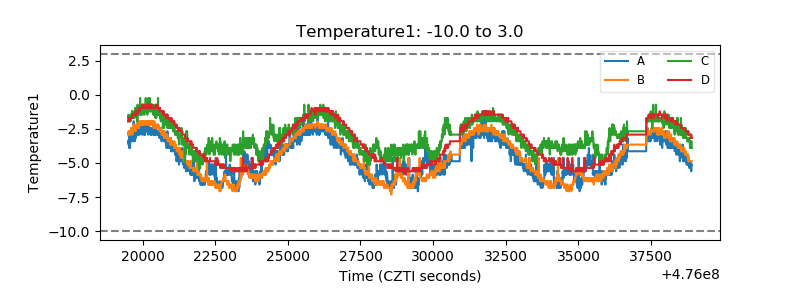 |
| Veto HV Monitor | 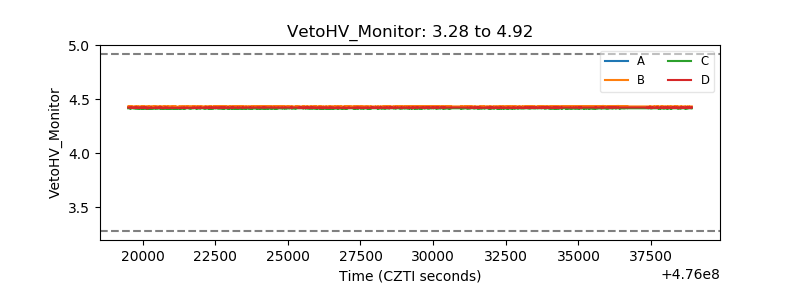 |
| Veto LLD | 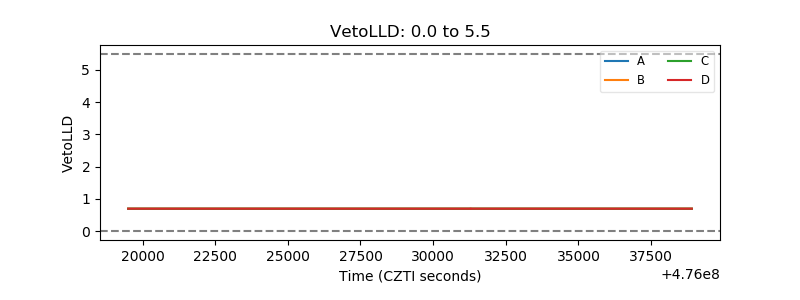 |
| Alpha Counter | 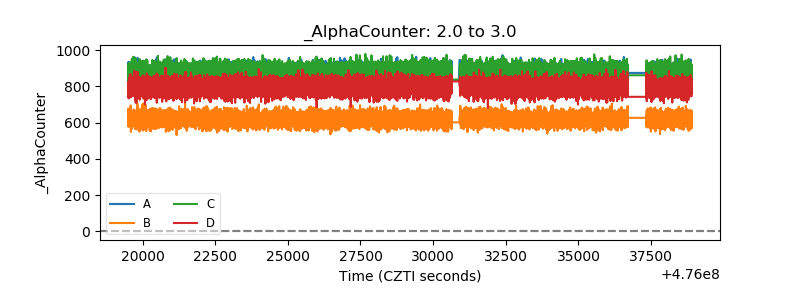 |
| _CPM_Rate | 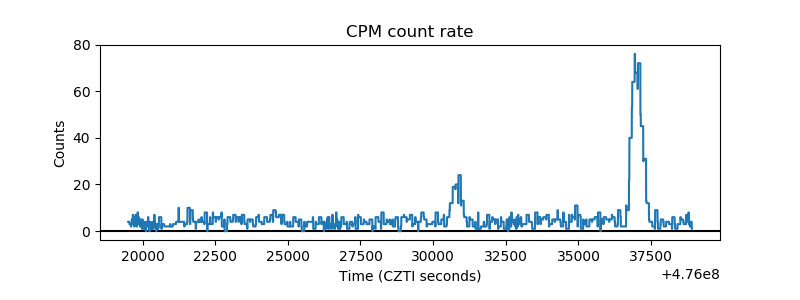 |
| CZT Counter | 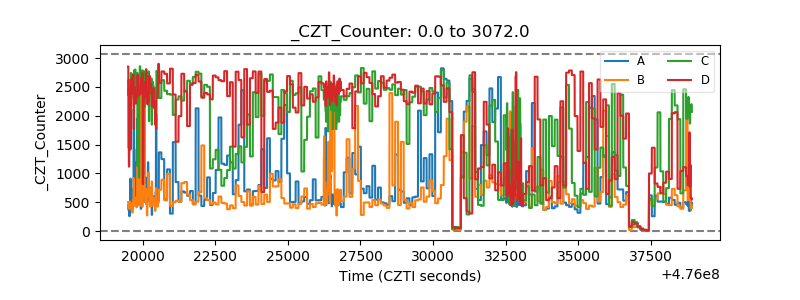 |
| +2.5 Volts monitor | 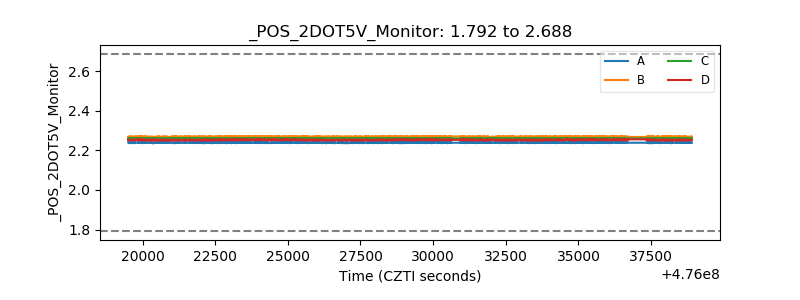 |
| +5 Volts monitor | 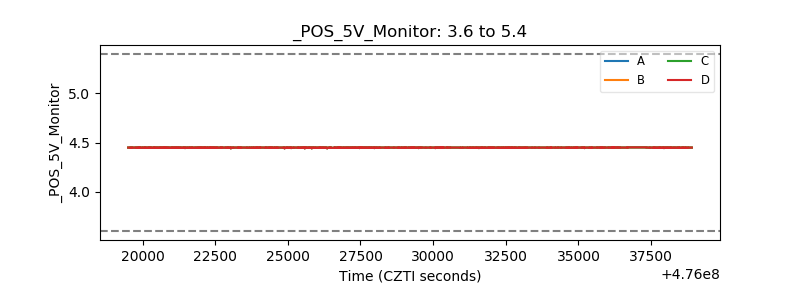 |
| _ROLL_ROT | 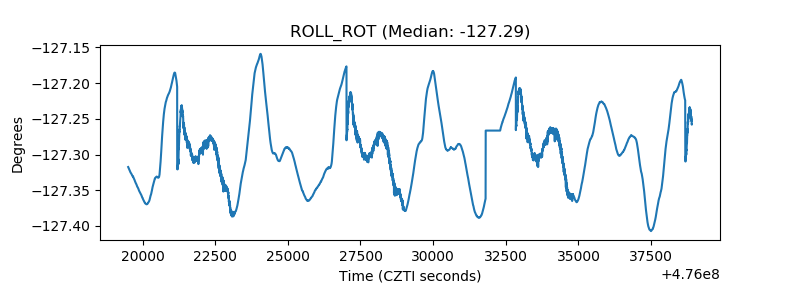 |
| _Roll_DEC | 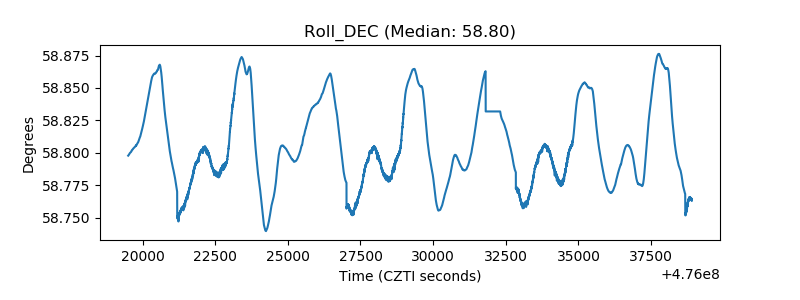 |
| _Roll_RA | 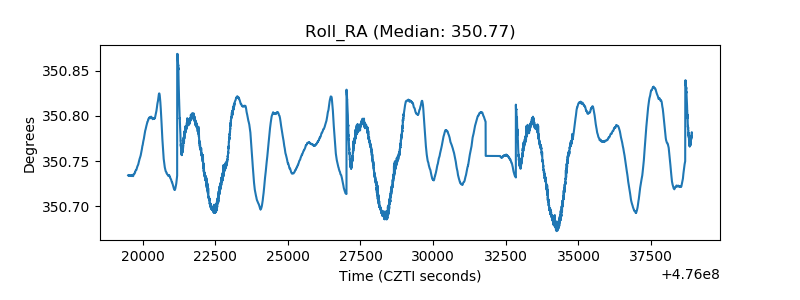 |
| Veto Counter | 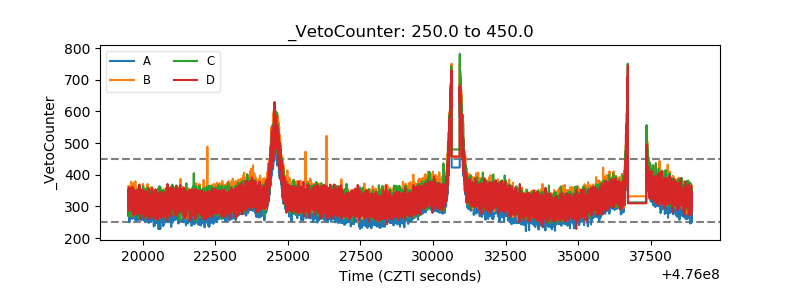 |