| Param | Original file | Final file |
|---|---|---|
| Filename | modeM0/AS1T05_239T01_9000006444_50546cztM0_level2.fits | modeM0/AS1T05_239T01_9000006444_50546cztM0_level2_quad_clean.evt |
| Size (bytes) | 742,495,680 | 88,395,840 |
| Size | 708.1 MB | 84.3 MB |
| Events in quadrant A | 4,922,699 | 604,936 |
| Events in quadrant B | 4,027,681 | 690,325 |
| Events in quadrant C | 10,017,361 | 414,294 |
| Events in quadrant D | 7,985,364 | 487,692 |
| Mode M0 | |||
|---|---|---|---|
| Quadrant | BADHDUFLAG | Total packets | Discarded packets |
| A | 0 | 19263 | 2 |
| B | 0 | 16819 | 2 |
| C | 0 | 34467 | 2 |
| D | 0 | 28498 | 2 |
| Mode M9 | |||
|---|---|---|---|
| Quadrant | BADHDUFLAG | Total packets | Discarded packets |
| A | 0 | 8 | 0 |
| B | 0 | 8 | 0 |
| C | 0 | 8 | 0 |
| D | 0 | 8 | 0 |
| Mode SS | |||
|---|---|---|---|
| Quadrant | BADHDUFLAG | Total packets | Discarded packets |
| A | 0 | 142 | 0 |
| B | 0 | 142 | 0 |
| C | 0 | 140 | 0 |
| D | 0 | 140 | 0 |
| Quadrant | Total seconds | Saturated seconds | Saturation percentage |
|---|---|---|---|
| A | 6865 | 430 | 6.263656% |
| B | 6866 | 136 | 1.980775% |
| C | 6866 | 2576 | 37.518206% |
| D | 6865 | 1213 | 17.669337% |
Noise dominated data is calculated using 1-second bins in cleaned event files. If a bin has >2000 counts, and if more than 50% of those come from <1% of pixels, then it is considered to be noise-dominated and hence unusable.
| Quadrant | # 1 sec bins | Bins with >0 counts | Bins with >2000 counts | High rate bins dominated by noise | Noise dominated (total time) | Noise dominated (detector-on time) | Marked lightcurve |
|---|---|---|---|---|---|---|---|
| A | 7715 | 6866 | 369 | 369 | 4.78% | 5.37% | 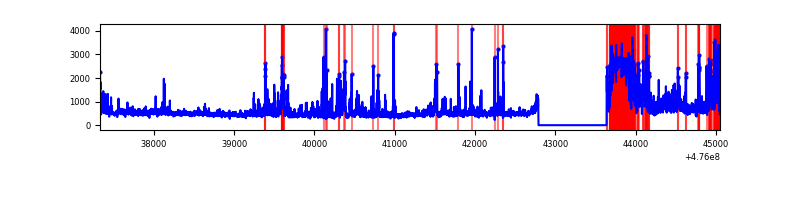 |
| B | 7716 | 6867 | 90 | 90 | 1.17% | 1.31% | 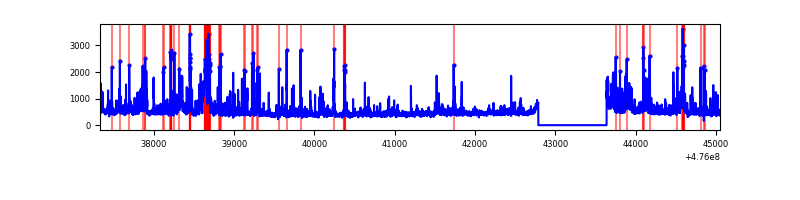 |
| C | 7716 | 6866 | 2008 | 2008 | 26.02% | 29.25% | 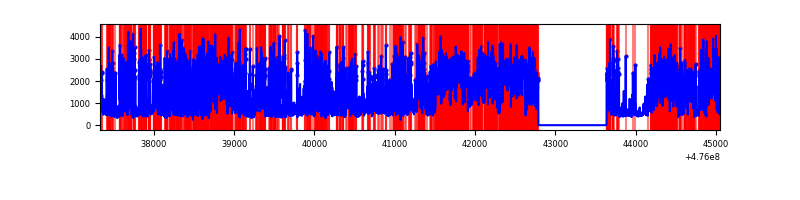 |
| D | 7715 | 6866 | 1192 | 1192 | 15.45% | 17.36% | 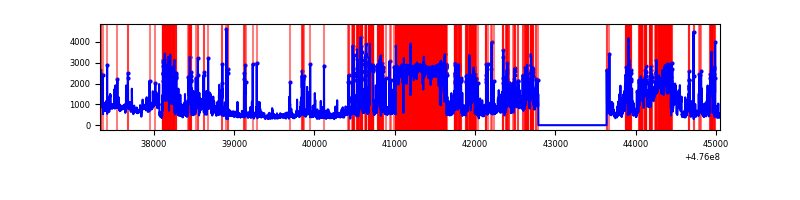 |
Top three noisy pixels from each quadrant. If the there are fewer than three noisy pixels in the level2.evt file, extra rows are filled as -1
| Pixel properties | Quadrant properties | ||||||
|---|---|---|---|---|---|---|---|
| Quadrant | DetID | PixID | Counts | Sigma | Mean | Median | Sigma |
| A | 3 | 130 | 1027818 | 5830.92 | 705 | 687 | 176.2 |
| A | 12 | 250 | 333607 | 1889.95 | 705 | 687 | 176.2 |
| A | 3 | 14 | 230473 | 1304.47 | 705 | 687 | 176.2 |
| B | 5 | 172 | 278911 | 1802.98 | 721 | 697 | 154.3 |
| B | 7 | 0 | 246551 | 1593.27 | 721 | 697 | 154.3 |
| B | 0 | 229 | 96864 | 623.22 | 721 | 697 | 154.3 |
| C | 15 | 178 | 2503210 | 15163.56 | 594 | 591 | 165.0 |
| C | 15 | 157 | 1169217 | 7080.79 | 594 | 591 | 165.0 |
| C | 15 | 213 | 902134 | 5462.52 | 594 | 591 | 165.0 |
| D | 15 | 184 | 1667238 | 9357.31 | 649 | 629 | 178.1 |
| D | 8 | 246 | 1425073 | 7997.66 | 649 | 629 | 178.1 |
| D | 6 | 42 | 544327 | 3052.64 | 649 | 629 | 178.1 |
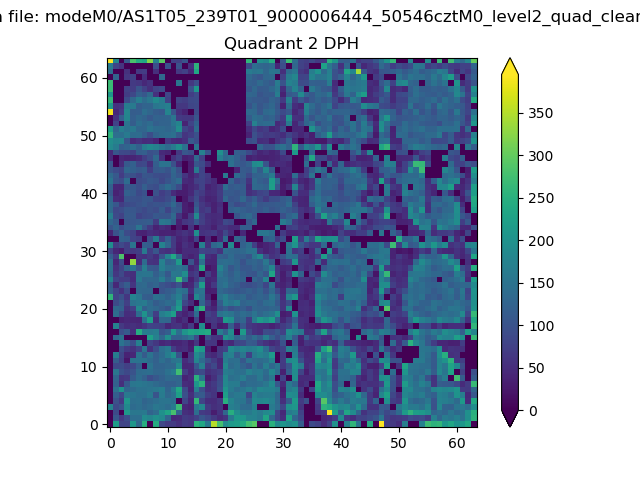
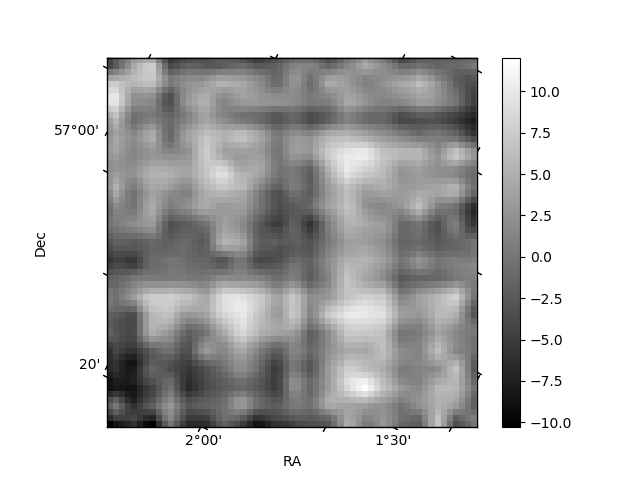
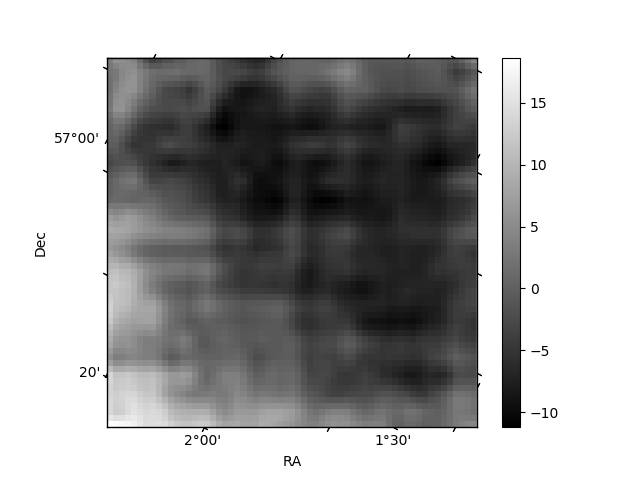
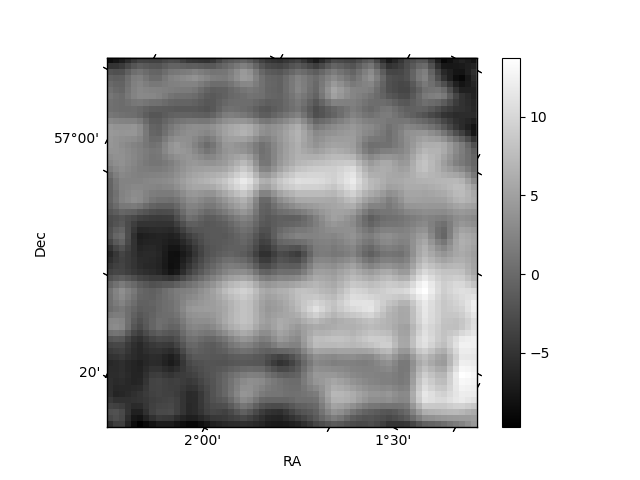
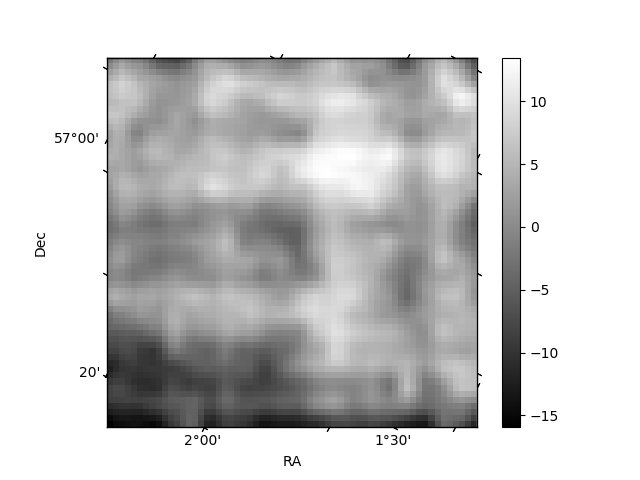
Histogram calculated using DETX and DETY for each event in the final _common_clean file
| Quadrant A | 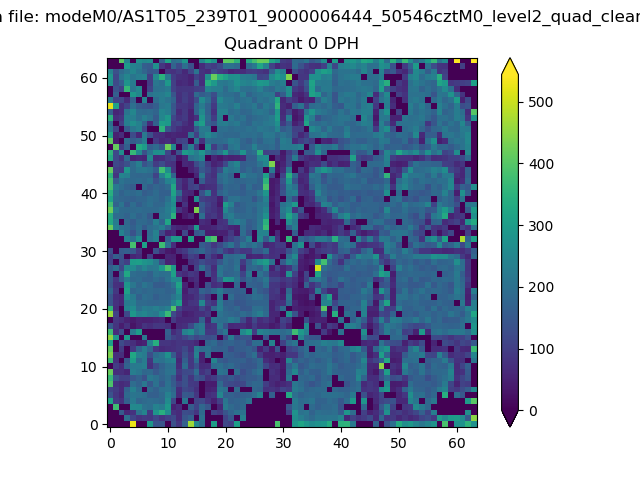 |
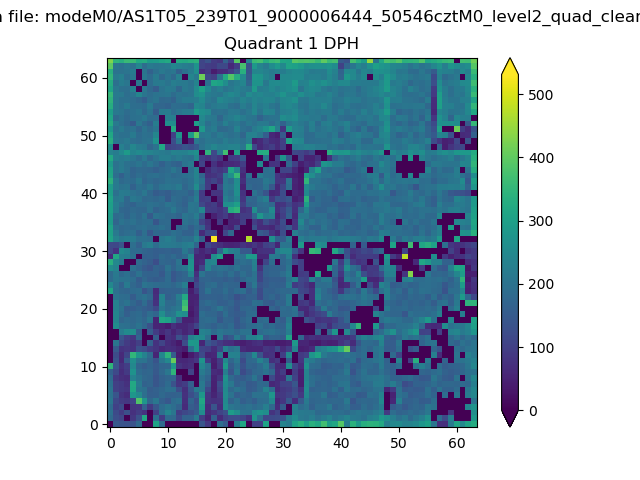 |
Quadrant B |
|---|---|---|---|
| Quadrant D | 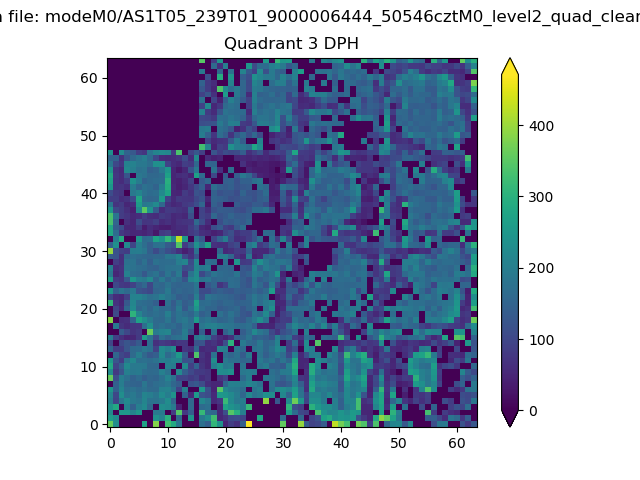 |
 |
Quadrant C |
| Plot type | Count rate plots | Images |
|---|---|---|
| Comparison with Poisson distribution Blue bars denote a histogram of data divided into 1 sec bins. Red curve is a Poisson curve with rate = median count rate of data. |
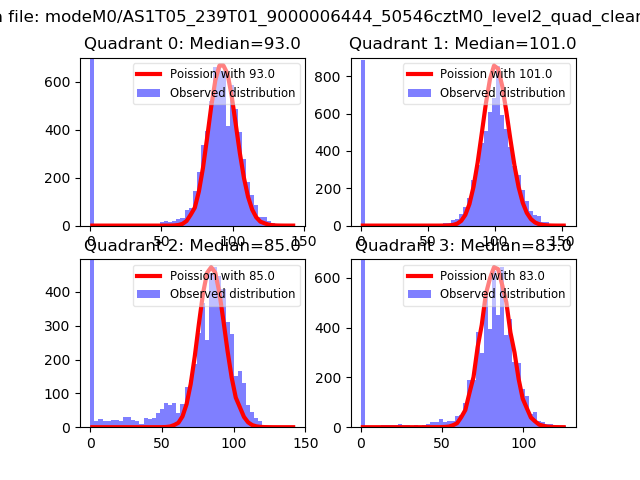 |
 |
| Quadrant-wise count rates Data is divided into 100 sec bins |
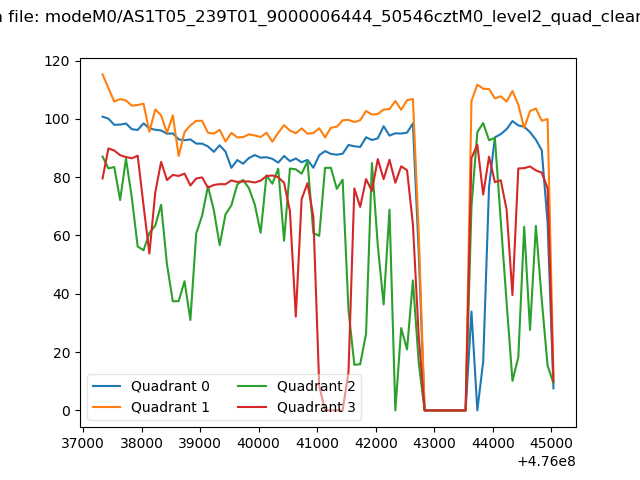 |
|
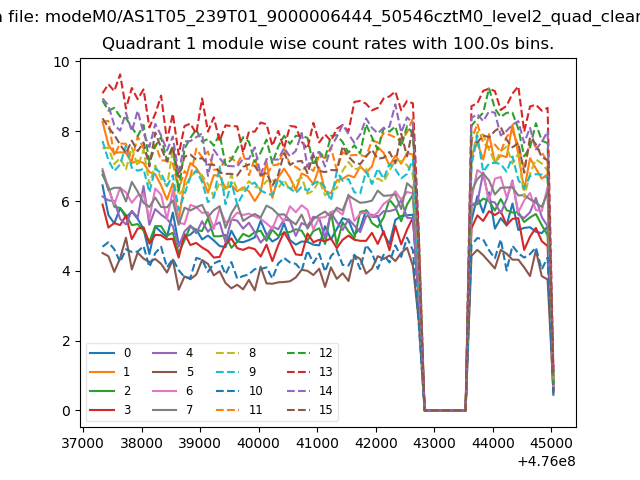
| Module-wise count rates for Quadrant A Data is divided into 100 sec bins |
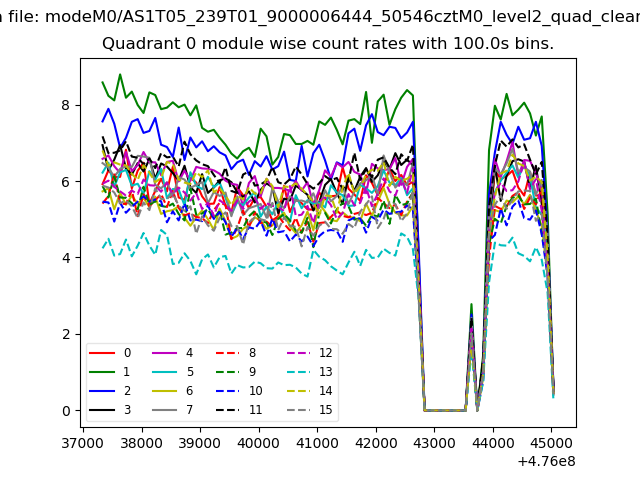 |
 |
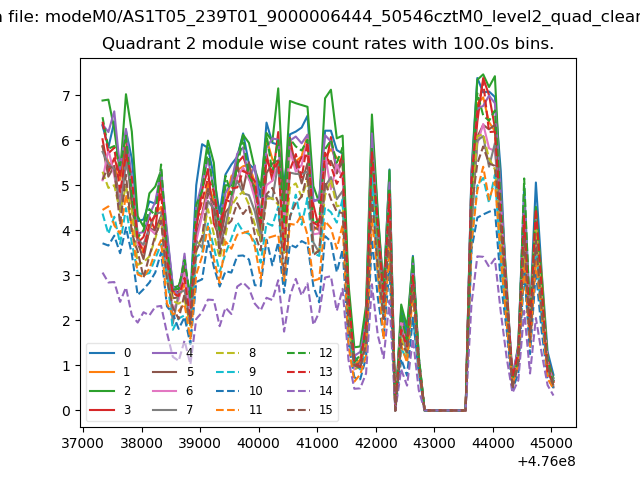
| Module-wise count rates for Quadrant B Data is divided into 100 sec bins |
 |
 |
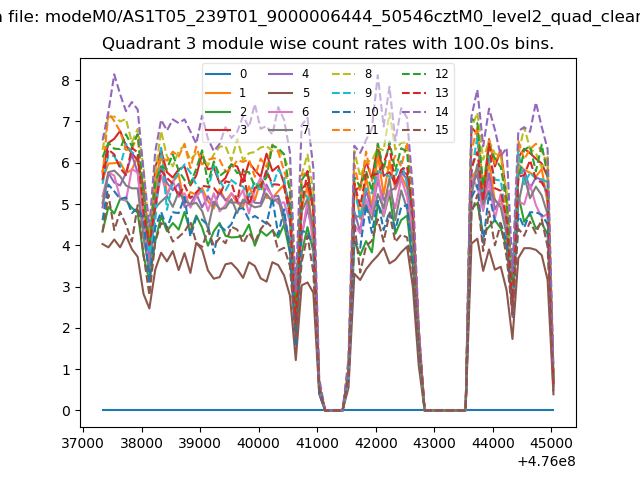
| Module-wise count rates for Quadrant C Data is divided into 100 sec bins |
 |
 |
| Module-wise count rates for Quadrant D Data is divided into 100 sec bins |
 |
 |
| Parameter | Plot |
|---|---|
| CZT HV Monitor | 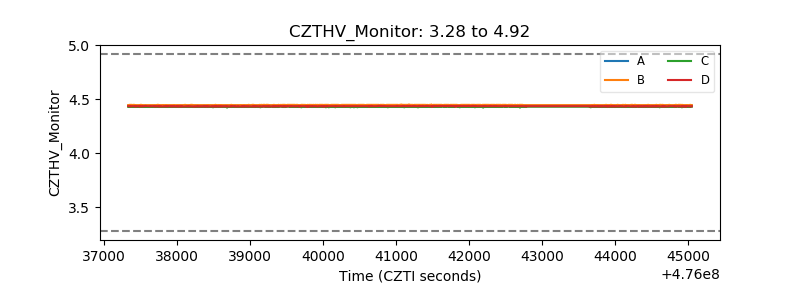 |
| D_VDD | 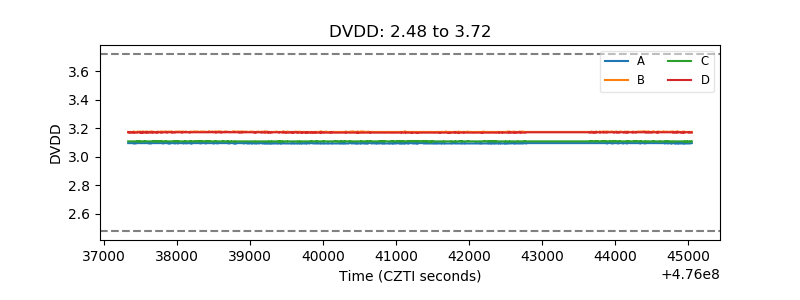 |
| Temperature 1 | 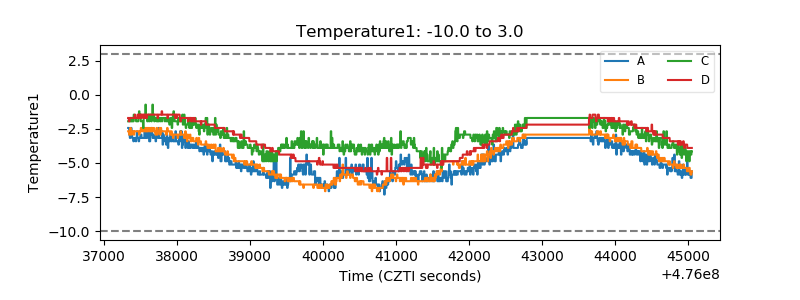 |
| Veto HV Monitor | 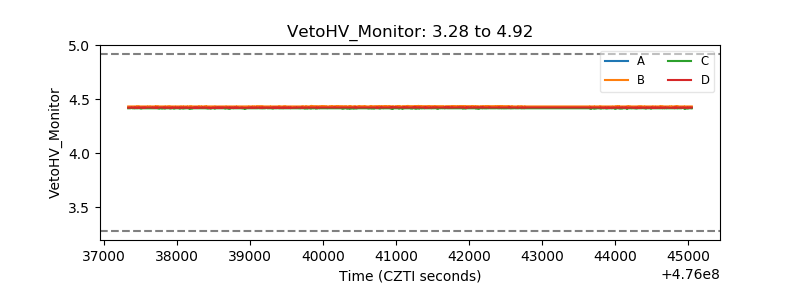 |
| Veto LLD | 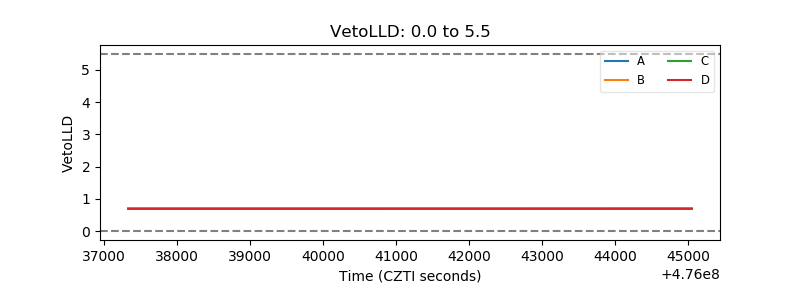 |
| Alpha Counter | 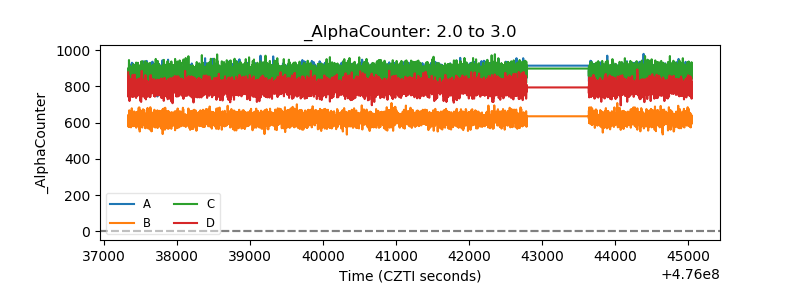 |
| _CPM_Rate | 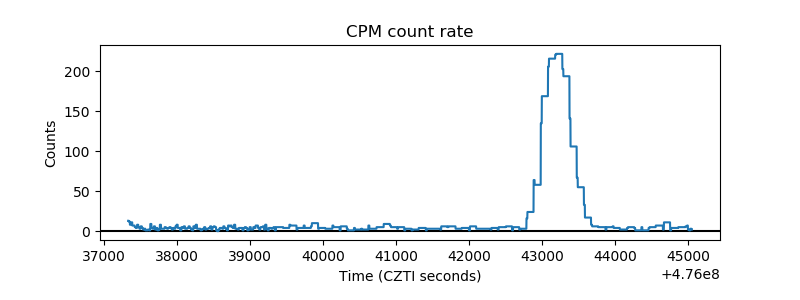 |
| CZT Counter | 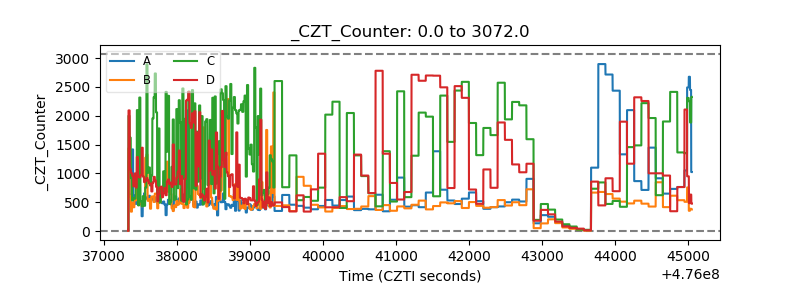 |
| +2.5 Volts monitor |  |
| +5 Volts monitor | 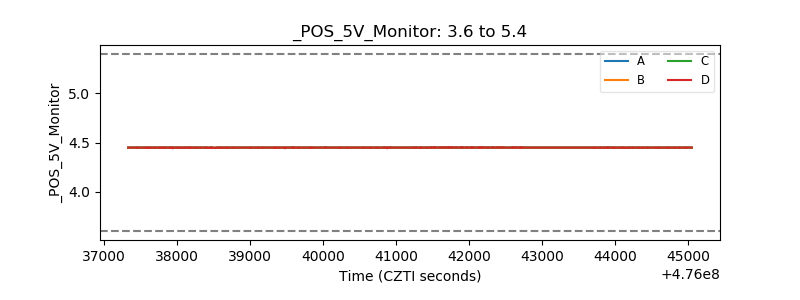 |
| _ROLL_ROT | 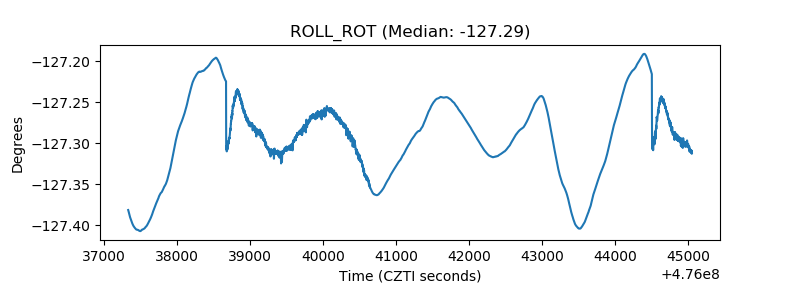 |
| _Roll_DEC | 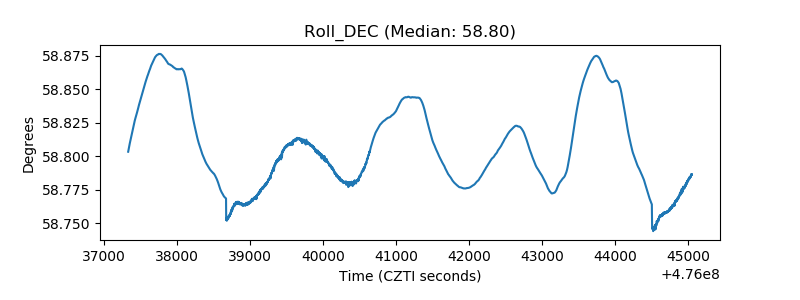 |
| _Roll_RA | 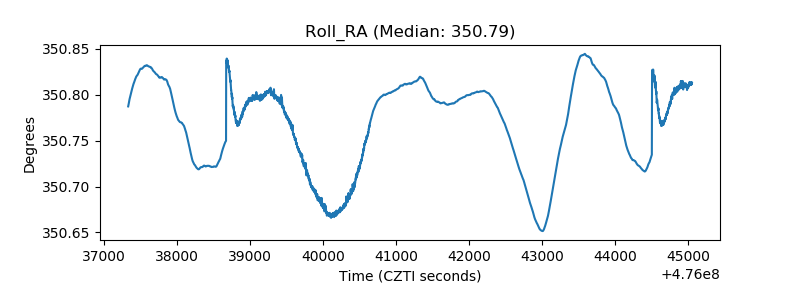 |
| Veto Counter | 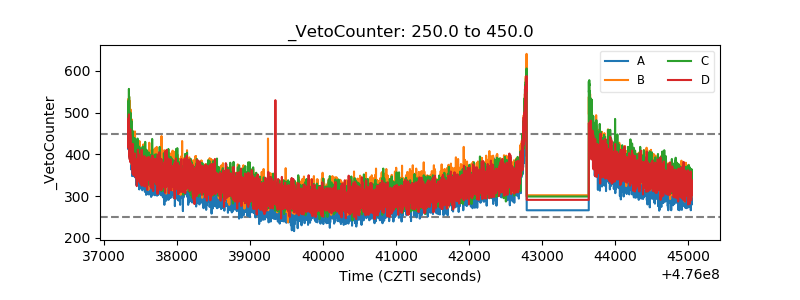 |