| Param | Original file | Final file |
|---|---|---|
| Filename | modeM0/AS1T05_239T01_9000006444_50547cztM0_level2.fits | modeM0/AS1T05_239T01_9000006444_50547cztM0_level2_quad_clean.evt |
| Size (bytes) | 755,449,920 | 86,345,280 |
| Size | 720.5 MB | 82.3 MB |
| Events in quadrant A | 6,945,623 | 553,636 |
| Events in quadrant B | 4,381,740 | 667,688 |
| Events in quadrant C | 10,291,356 | 371,381 |
| Events in quadrant D | 5,822,330 | 550,552 |
| Mode M0 | |||
|---|---|---|---|
| Quadrant | BADHDUFLAG | Total packets | Discarded packets |
| A | 0 | 25188 | 1 |
| B | 0 | 17768 | 1 |
| C | 0 | 35208 | 7 |
| D | 0 | 22016 | 1 |
| Mode M9 | |||
|---|---|---|---|
| Quadrant | BADHDUFLAG | Total packets | Discarded packets |
| A | 0 | 10 | 0 |
| B | 0 | 10 | 0 |
| C | 0 | 10 | 0 |
| D | 0 | 10 | 0 |
| Mode SS | |||
|---|---|---|---|
| Quadrant | BADHDUFLAG | Total packets | Discarded packets |
| A | 0 | 136 | 0 |
| B | 0 | 136 | 0 |
| C | 0 | 136 | 0 |
| D | 0 | 136 | 0 |
| Quadrant | Total seconds | Saturated seconds | Saturation percentage |
|---|---|---|---|
| A | 6758 | 1014 | 15.004439% |
| B | 6758 | 270 | 3.995265% |
| C | 6757 | 3006 | 44.487198% |
| D | 6758 | 451 | 6.673572% |
Noise dominated data is calculated using 1-second bins in cleaned event files. If a bin has >2000 counts, and if more than 50% of those come from <1% of pixels, then it is considered to be noise-dominated and hence unusable.
| Quadrant | # 1 sec bins | Bins with >0 counts | Bins with >2000 counts | High rate bins dominated by noise | Noise dominated (total time) | Noise dominated (detector-on time) | Marked lightcurve |
|---|---|---|---|---|---|---|---|
| A | 7758 | 6759 | 928 | 928 | 11.96% | 13.73% | 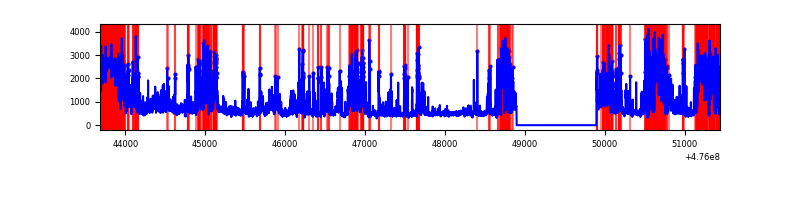 |
| B | 7758 | 6759 | 191 | 191 | 2.46% | 2.83% | 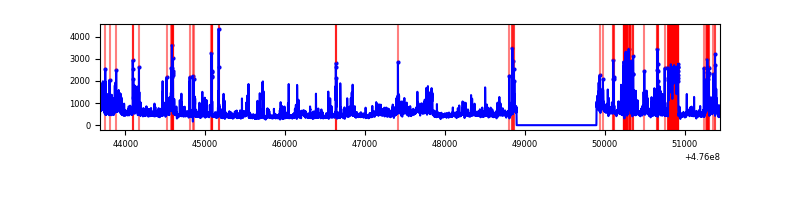 |
| C | 7756 | 6756 | 2205 | 2205 | 28.43% | 32.64% | 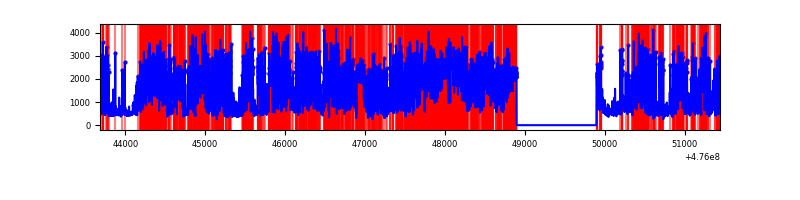 |
| D | 7758 | 6759 | 475 | 475 | 6.12% | 7.03% | 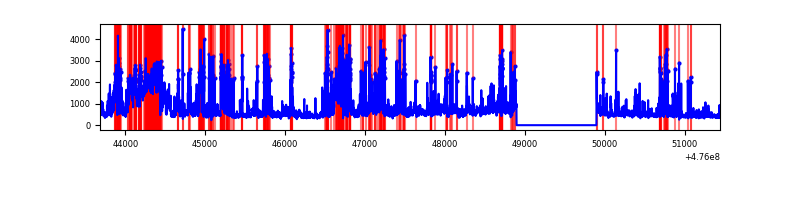 |
Top three noisy pixels from each quadrant. If the there are fewer than three noisy pixels in the level2.evt file, extra rows are filled as -1
| Pixel properties | Quadrant properties | ||||||
|---|---|---|---|---|---|---|---|
| Quadrant | DetID | PixID | Counts | Sigma | Mean | Median | Sigma |
| A | 3 | 130 | 1760887 | 10706.65 | 664 | 647 | 164.4 |
| A | 8 | 247 | 900175 | 5471.38 | 664 | 647 | 164.4 |
| A | 12 | 250 | 657168 | 3993.29 | 664 | 647 | 164.4 |
| B | 7 | 0 | 297498 | 1983.94 | 704 | 680 | 149.6 |
| B | 15 | 54 | 230421 | 1535.59 | 704 | 680 | 149.6 |
| B | 4 | 170 | 181925 | 1211.45 | 704 | 680 | 149.6 |
| C | 15 | 178 | 3893055 | 26053.5 | 533 | 528 | 149.4 |
| C | 4 | 12 | 1045027 | 6991.05 | 533 | 528 | 149.4 |
| C | 0 | 208 | 959218 | 6416.71 | 533 | 528 | 149.4 |
| D | 8 | 246 | 986243 | 5101.85 | 683 | 657 | 193.2 |
| D | 6 | 42 | 666456 | 3446.48 | 683 | 657 | 193.2 |
| D | 7 | 61 | 422359 | 2182.92 | 683 | 657 | 193.2 |
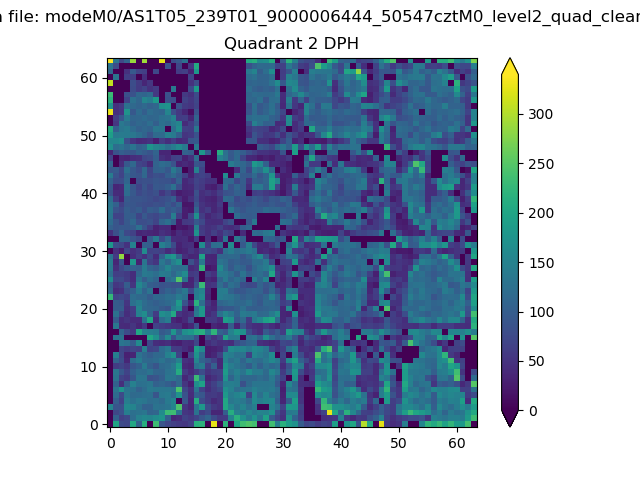
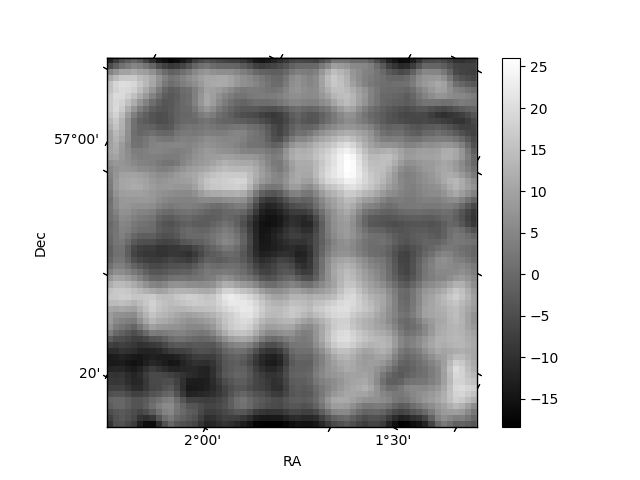
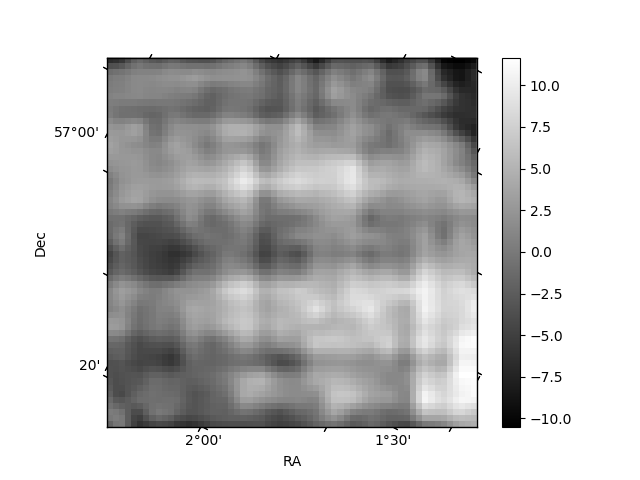
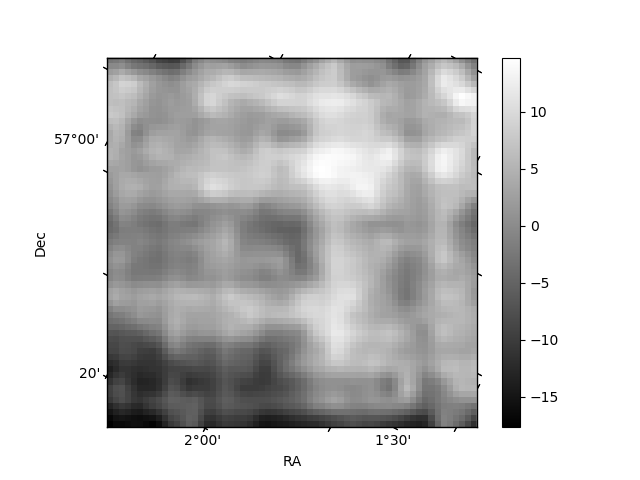
Histogram calculated using DETX and DETY for each event in the final _common_clean file
| Quadrant A | 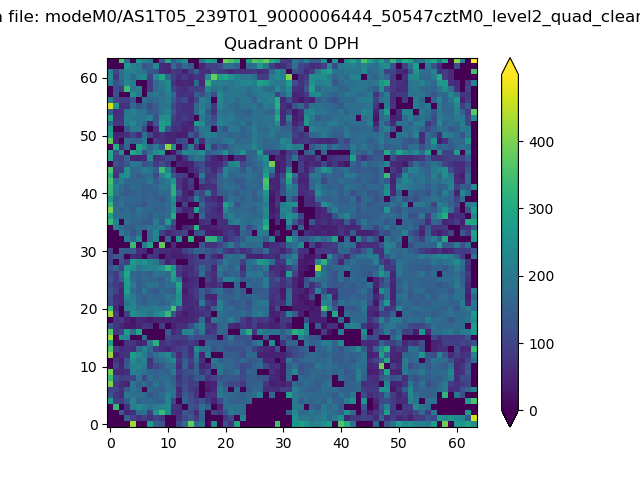 |
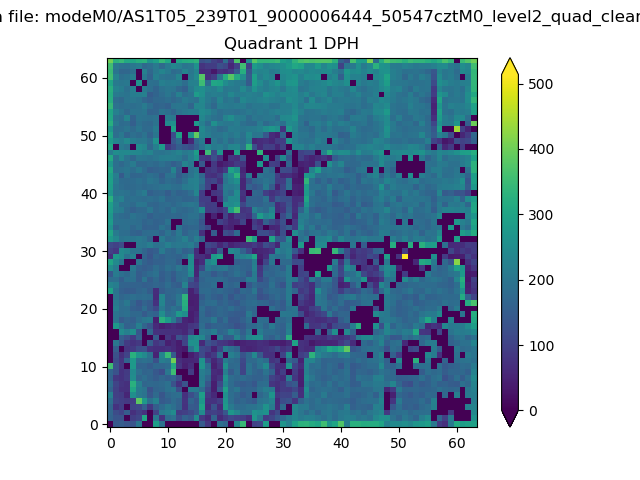 |
Quadrant B |
|---|---|---|---|
| Quadrant D | 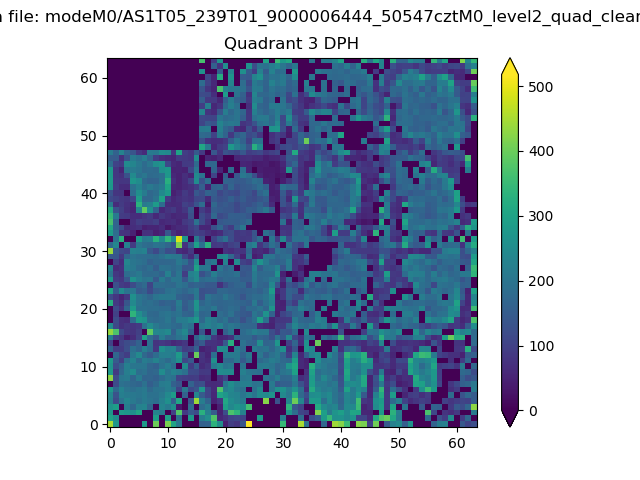 |
 |
Quadrant C |
| Plot type | Count rate plots | Images |
|---|---|---|
| Comparison with Poisson distribution Blue bars denote a histogram of data divided into 1 sec bins. Red curve is a Poisson curve with rate = median count rate of data. |
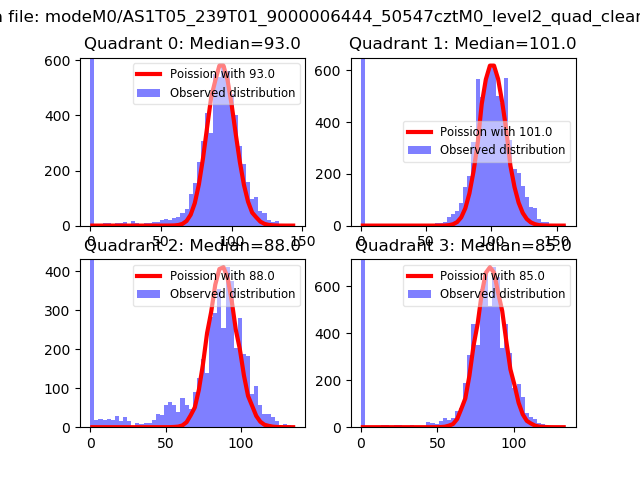 |
 |
| Quadrant-wise count rates Data is divided into 100 sec bins |
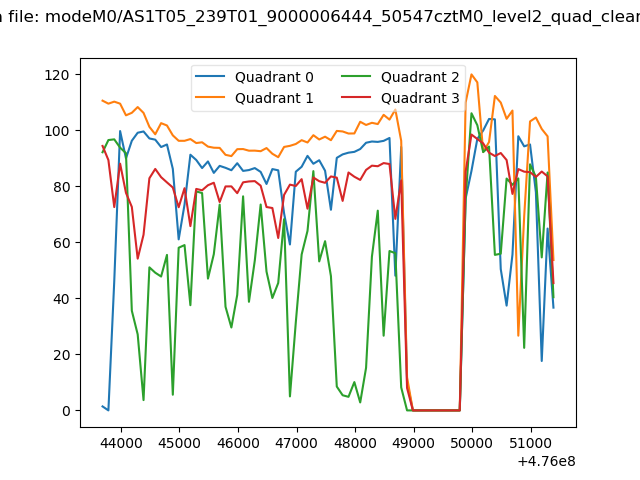 |
|
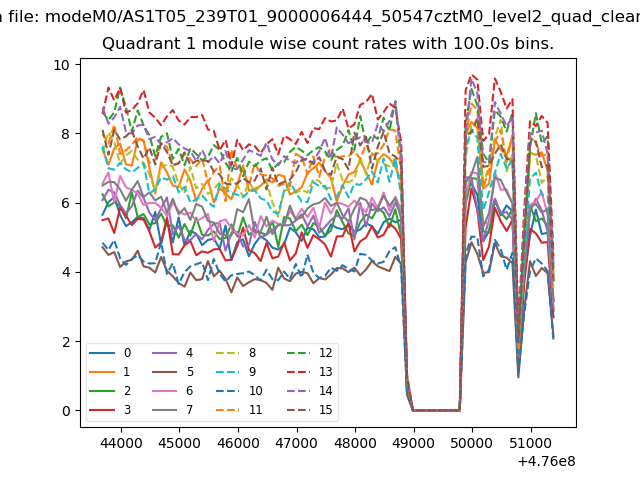
| Module-wise count rates for Quadrant A Data is divided into 100 sec bins |
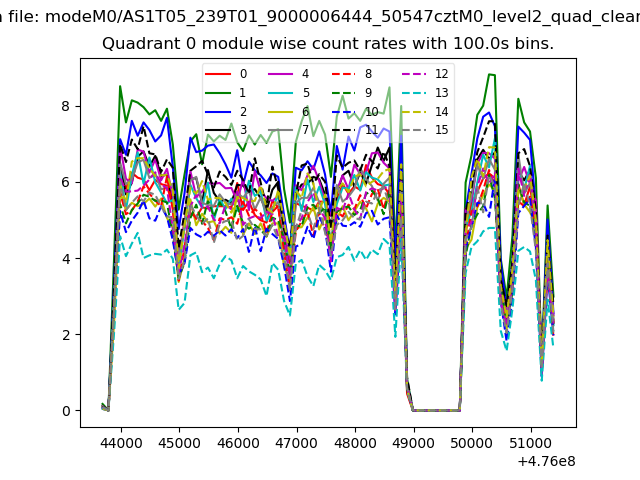 |
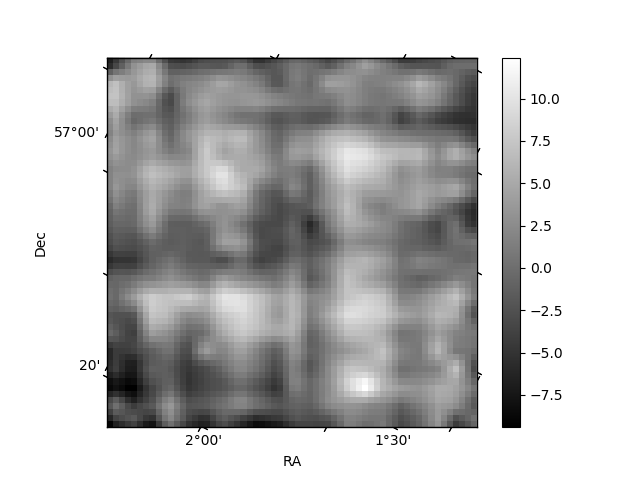 |
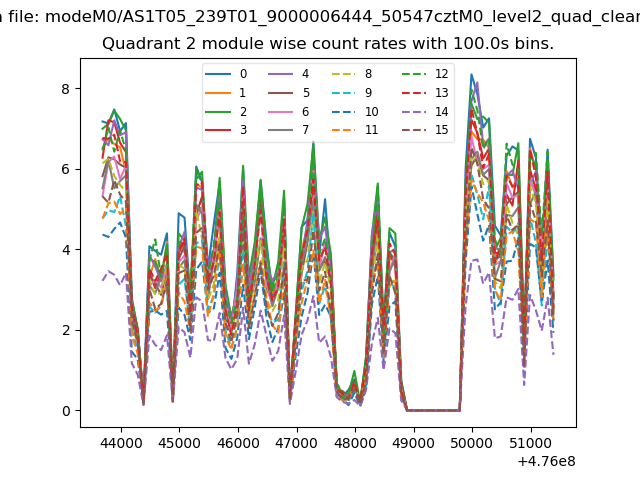
| Module-wise count rates for Quadrant B Data is divided into 100 sec bins |
 |
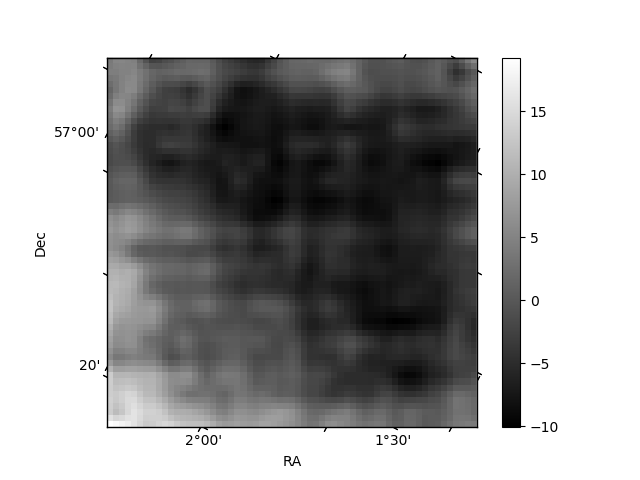 |
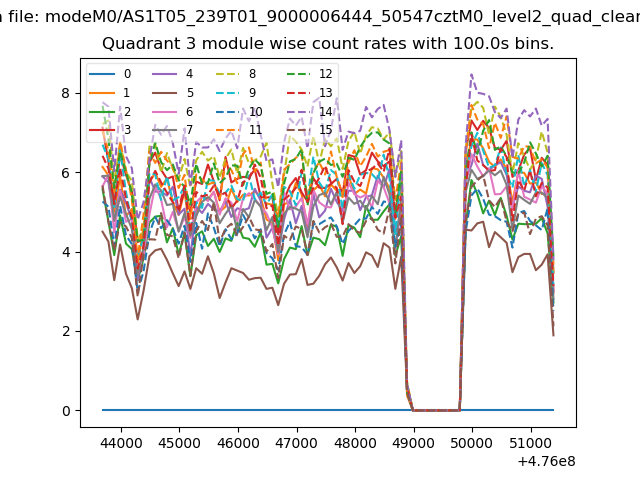
| Module-wise count rates for Quadrant C Data is divided into 100 sec bins |
 |
 |
| Module-wise count rates for Quadrant D Data is divided into 100 sec bins |
 |
 |
| Parameter | Plot |
|---|---|
| CZT HV Monitor | 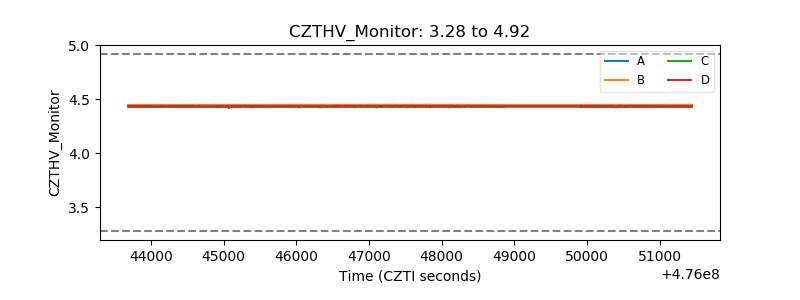 |
| D_VDD | 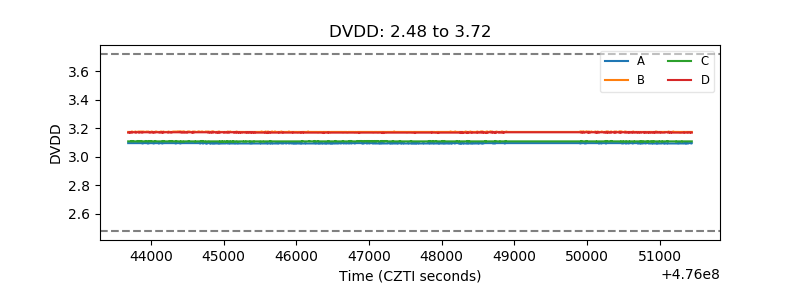 |
| Temperature 1 | 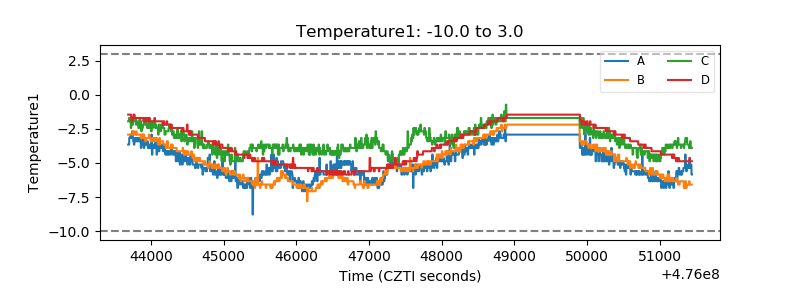 |
| Veto HV Monitor |  |
| Veto LLD | 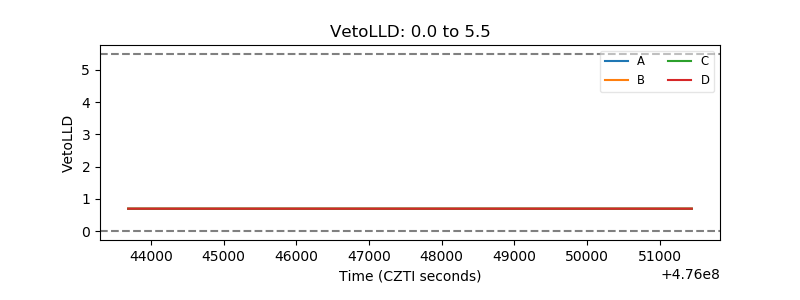 |
| Alpha Counter | 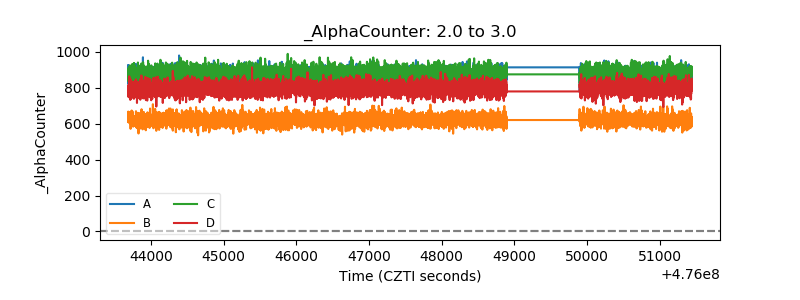 |
| _CPM_Rate | 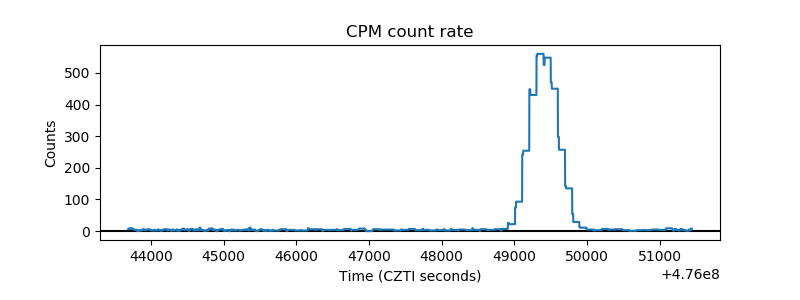 |
| CZT Counter | 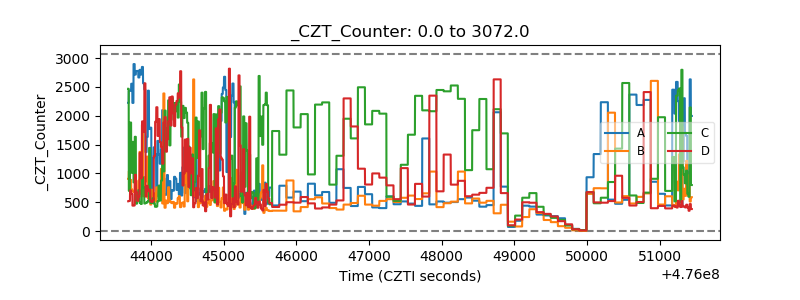 |
| +2.5 Volts monitor | 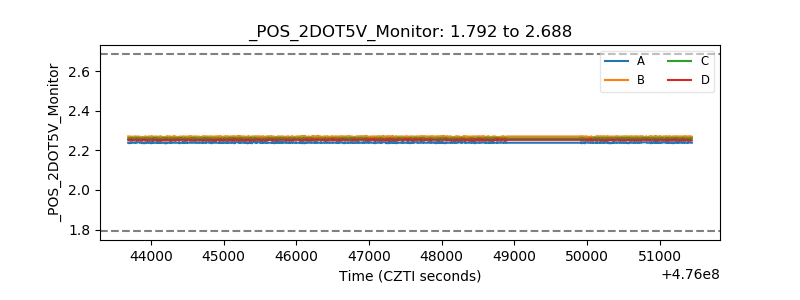 |
| +5 Volts monitor |  |
| _ROLL_ROT | 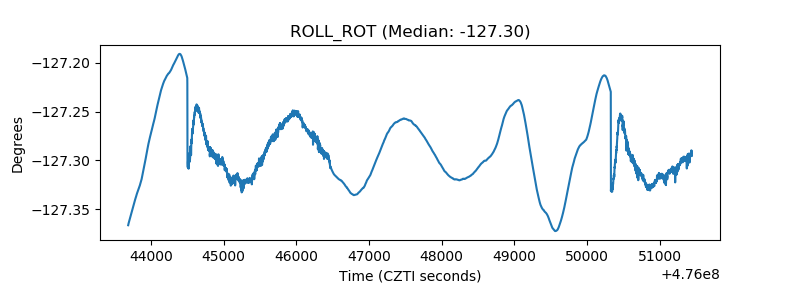 |
| _Roll_DEC | 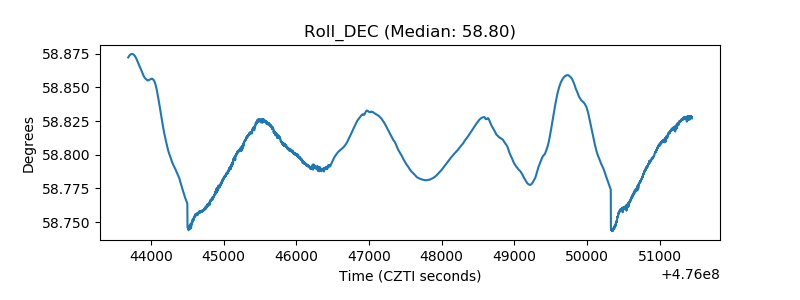 |
| _Roll_RA | 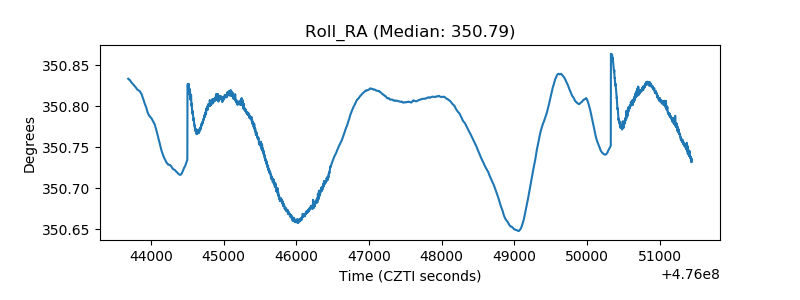 |
| Veto Counter | 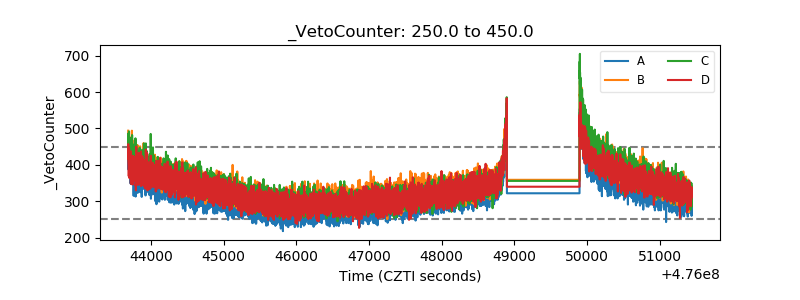 |