| Param | Original file | Final file |
|---|---|---|
| Filename | modeM0/AS1T05_239T01_9000006444_50549cztM0_level2.fits | modeM0/AS1T05_239T01_9000006444_50549cztM0_level2_quad_clean.evt |
| Size (bytes) | 741,674,880 | 87,912,000 |
| Size | 707.3 MB | 83.8 MB |
| Events in quadrant A | 6,860,094 | 557,545 |
| Events in quadrant B | 4,264,049 | 671,143 |
| Events in quadrant C | 10,453,619 | 418,070 |
| Events in quadrant D | 5,363,455 | 552,999 |
| Mode M0 | |||
|---|---|---|---|
| Quadrant | BADHDUFLAG | Total packets | Discarded packets |
| A | 0 | 24864 | 1 |
| B | 0 | 17288 | 1 |
| C | 0 | 35619 | 1 |
| D | 0 | 20557 | 1 |
| Mode M9 | |||
|---|---|---|---|
| Quadrant | BADHDUFLAG | Total packets | Discarded packets |
| A | 0 | 12 | 0 |
| B | 0 | 12 | 0 |
| C | 0 | 12 | 0 |
| D | 0 | 12 | 0 |
| Mode SS | |||
|---|---|---|---|
| Quadrant | BADHDUFLAG | Total packets | Discarded packets |
| A | 0 | 132 | 0 |
| B | 0 | 132 | 0 |
| C | 0 | 132 | 0 |
| D | 0 | 132 | 0 |
| Quadrant | Total seconds | Saturated seconds | Saturation percentage |
|---|---|---|---|
| A | 6630 | 1001 | 15.098039% |
| B | 6630 | 303 | 4.570136% |
| C | 6630 | 2532 | 38.190045% |
| D | 6631 | 358 | 5.398884% |
Noise dominated data is calculated using 1-second bins in cleaned event files. If a bin has >2000 counts, and if more than 50% of those come from <1% of pixels, then it is considered to be noise-dominated and hence unusable.
| Quadrant | # 1 sec bins | Bins with >0 counts | Bins with >2000 counts | High rate bins dominated by noise | Noise dominated (total time) | Noise dominated (detector-on time) | Marked lightcurve |
|---|---|---|---|---|---|---|---|
| A | 7770 | 6631 | 965 | 965 | 12.42% | 14.55% | 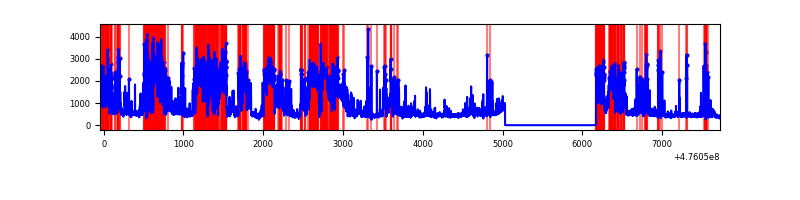 |
| B | 7770 | 6630 | 223 | 223 | 2.87% | 3.36% | 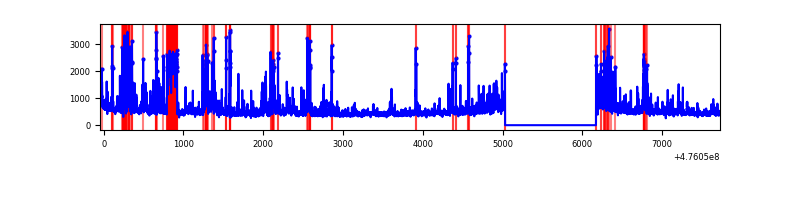 |
| C | 7770 | 6631 | 2133 | 2133 | 27.45% | 32.17% | 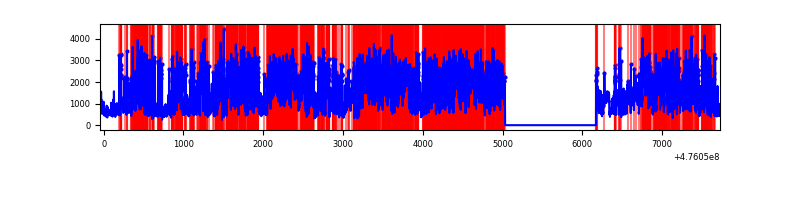 |
| D | 7771 | 6631 | 317 | 317 | 4.08% | 4.78% | 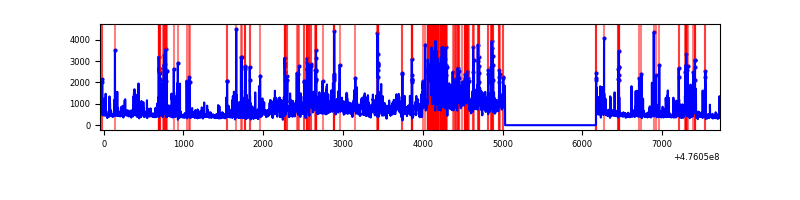 |
Top three noisy pixels from each quadrant. If the there are fewer than three noisy pixels in the level2.evt file, extra rows are filled as -1
| Pixel properties | Quadrant properties | ||||||
|---|---|---|---|---|---|---|---|
| Quadrant | DetID | PixID | Counts | Sigma | Mean | Median | Sigma |
| A | 12 | 80 | 1687607 | 9972.44 | 673 | 654 | 169.2 |
| A | 8 | 247 | 1092115 | 6452.19 | 673 | 654 | 169.2 |
| A | 3 | 130 | 541281 | 3195.92 | 673 | 654 | 169.2 |
| B | 7 | 0 | 337713 | 2286.48 | 694 | 670 | 147.4 |
| B | 15 | 54 | 229450 | 1552.03 | 694 | 670 | 147.4 |
| B | 4 | 170 | 138880 | 937.61 | 694 | 670 | 147.4 |
| C | 15 | 178 | 2484950 | 15511.76 | 580 | 577 | 160.2 |
| C | 10 | 69 | 2175828 | 13581.69 | 580 | 577 | 160.2 |
| C | 15 | 214 | 934282 | 5829.81 | 580 | 577 | 160.2 |
| D | 3 | 12 | 979715 | 5185.76 | 672 | 649 | 188.8 |
| D | 7 | 96 | 429618 | 2272.09 | 672 | 649 | 188.8 |
| D | 7 | 60 | 295176 | 1560.0 | 672 | 649 | 188.8 |
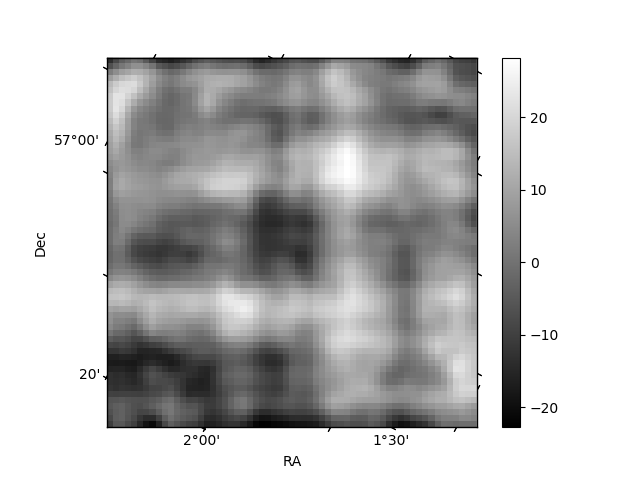
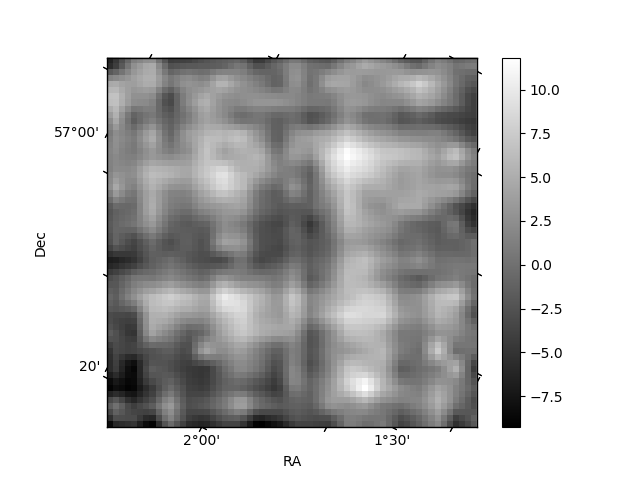
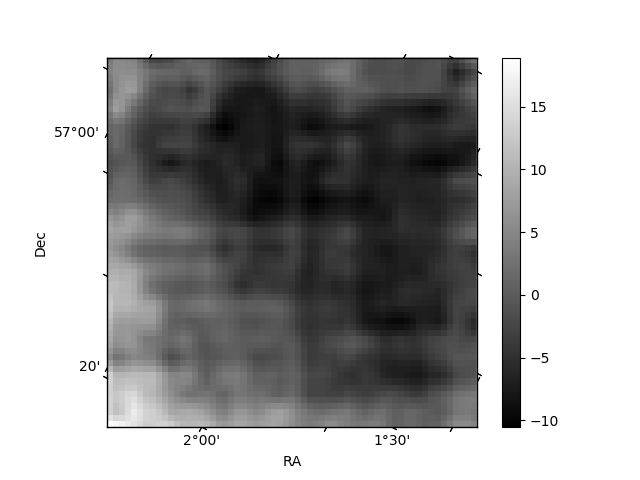
Histogram calculated using DETX and DETY for each event in the final _common_clean file
| Quadrant A | 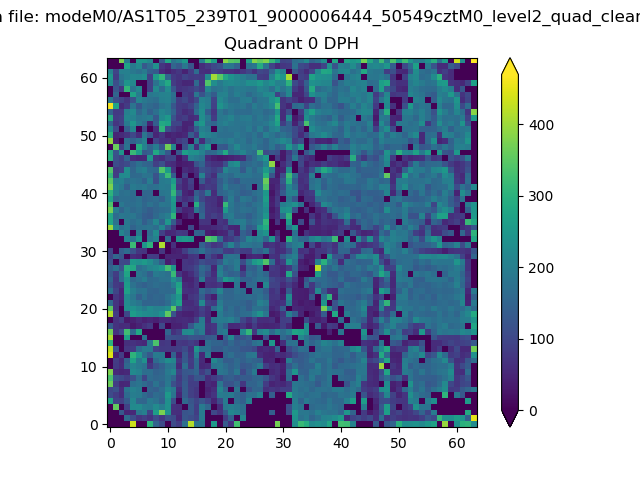 |
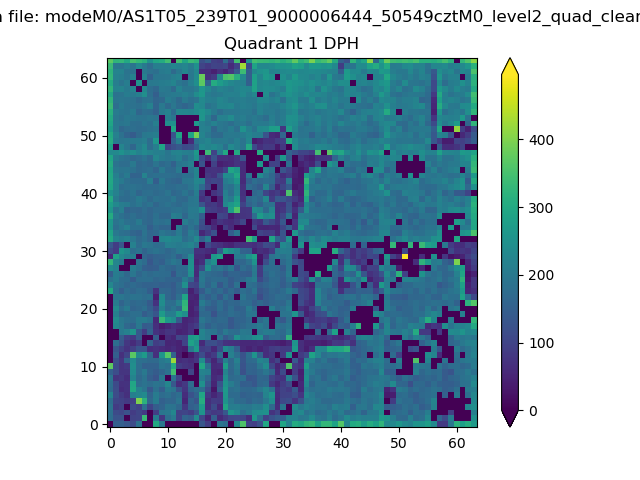 |
Quadrant B |
|---|---|---|---|
| Quadrant D | 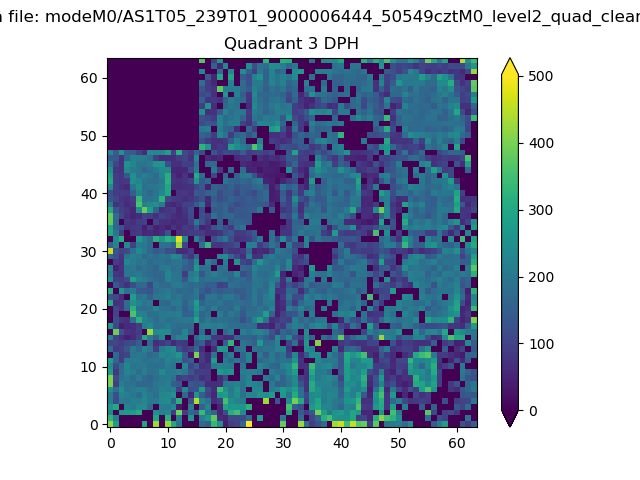 |
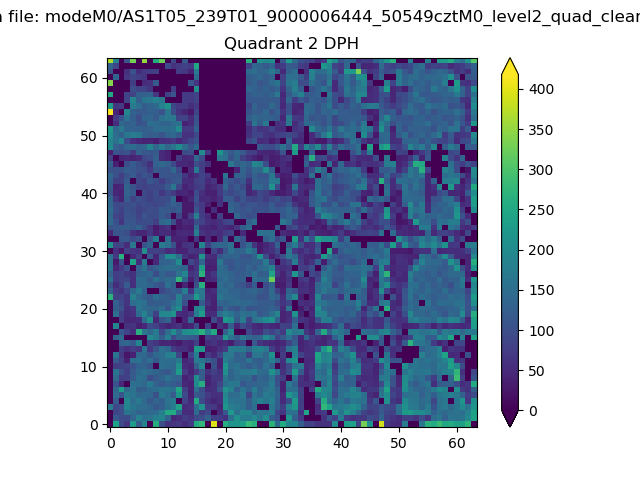 |
Quadrant C |
| Plot type | Count rate plots | Images |
|---|---|---|
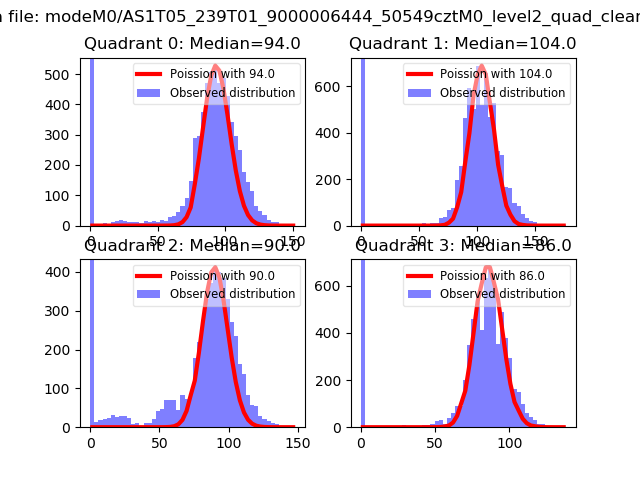
| Comparison with Poisson distribution Blue bars denote a histogram of data divided into 1 sec bins. Red curve is a Poisson curve with rate = median count rate of data. |
 |
 |
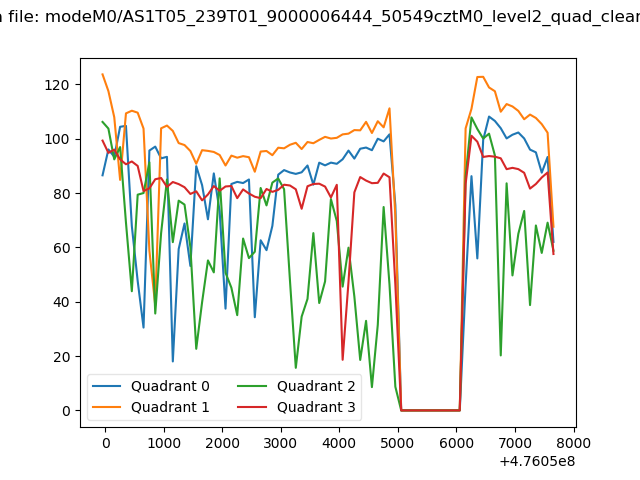
| Quadrant-wise count rates Data is divided into 100 sec bins |
 |
|
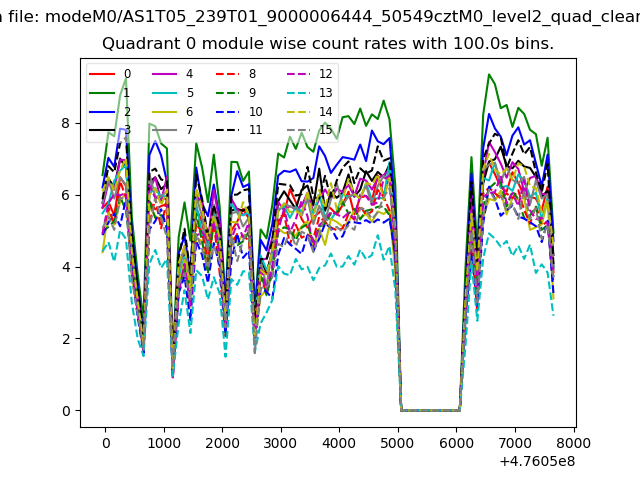
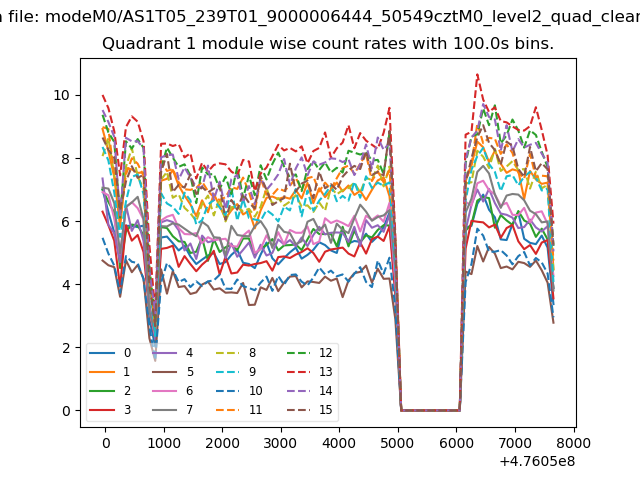
| Module-wise count rates for Quadrant A Data is divided into 100 sec bins |
 |
 |
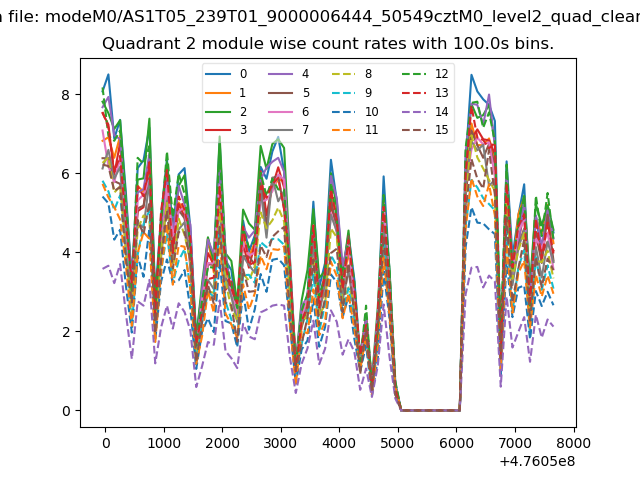
| Module-wise count rates for Quadrant B Data is divided into 100 sec bins |
 |
 |
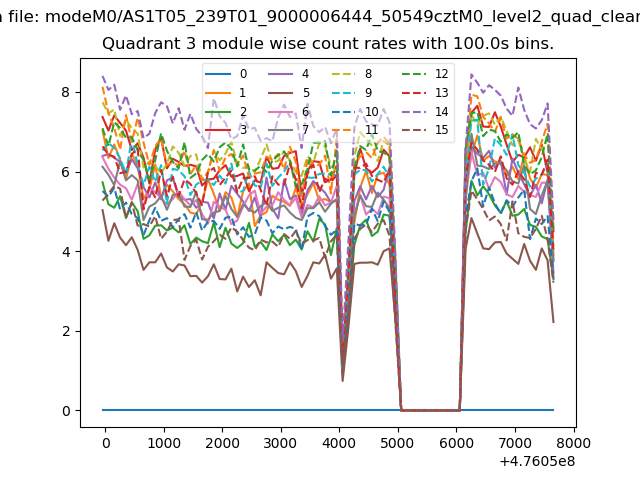
| Module-wise count rates for Quadrant C Data is divided into 100 sec bins |
 |
 |
| Module-wise count rates for Quadrant D Data is divided into 100 sec bins |
 |
 |
| Parameter | Plot |
|---|---|
| CZT HV Monitor | 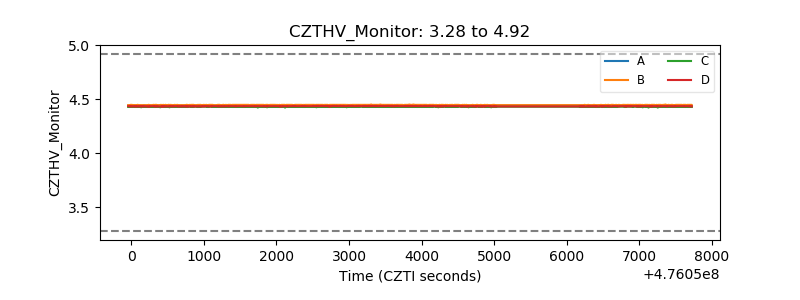 |
| D_VDD | 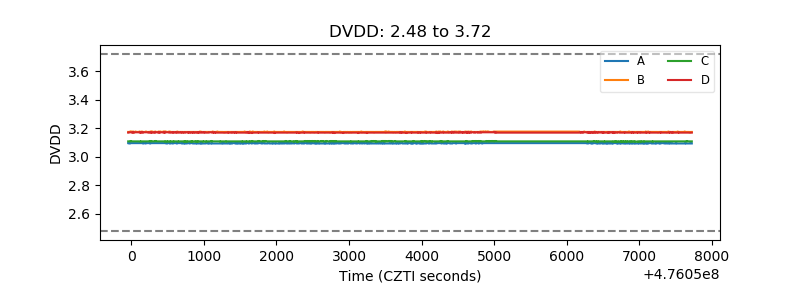 |
| Temperature 1 | 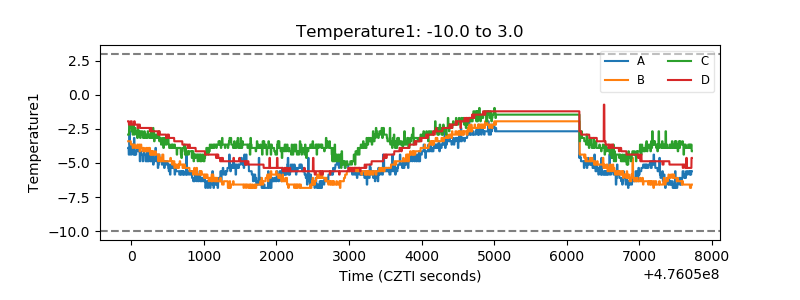 |
| Veto HV Monitor | 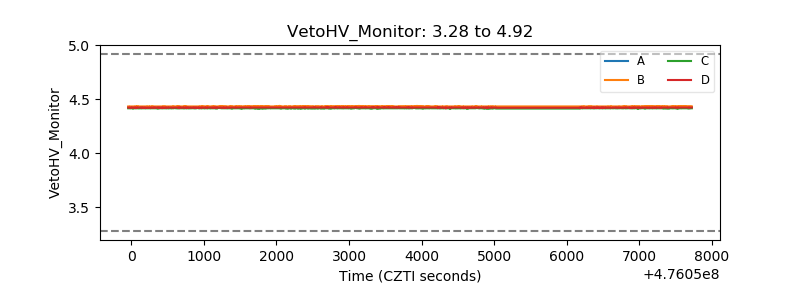 |
| Veto LLD | 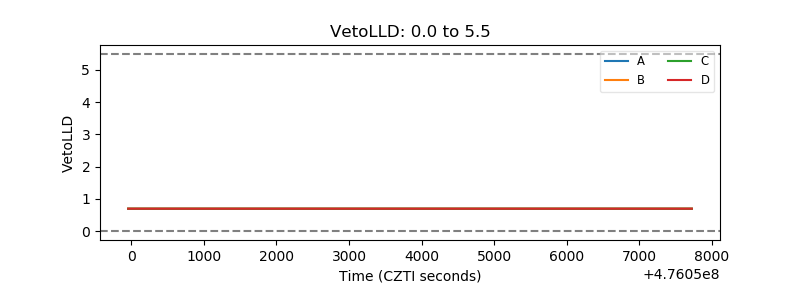 |
| Alpha Counter | 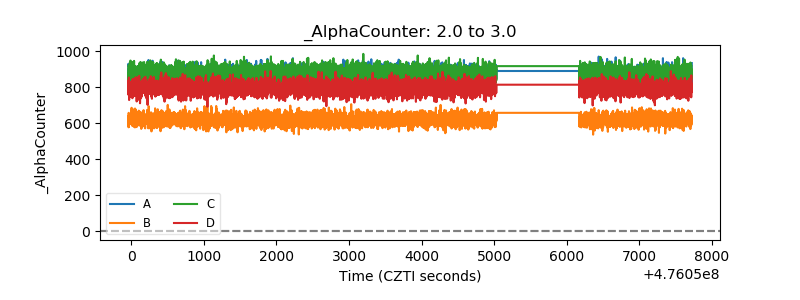 |
| _CPM_Rate | 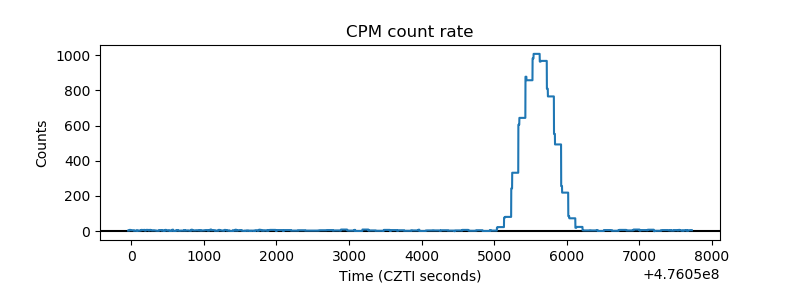 |
| CZT Counter | 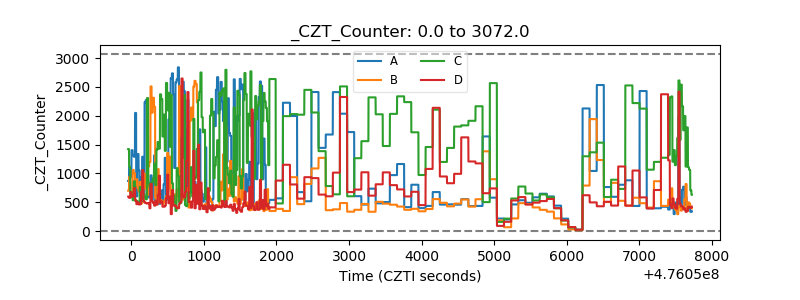 |
| +2.5 Volts monitor |  |
| +5 Volts monitor | 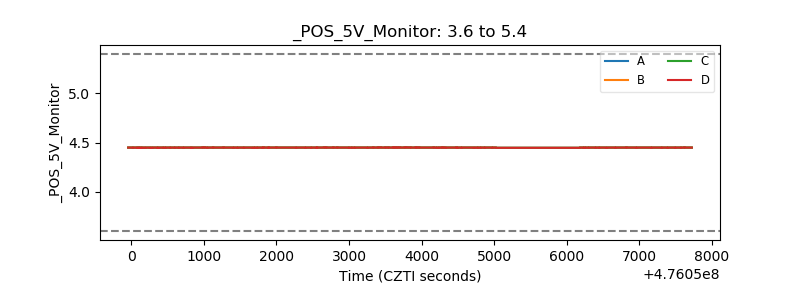 |
| _ROLL_ROT | 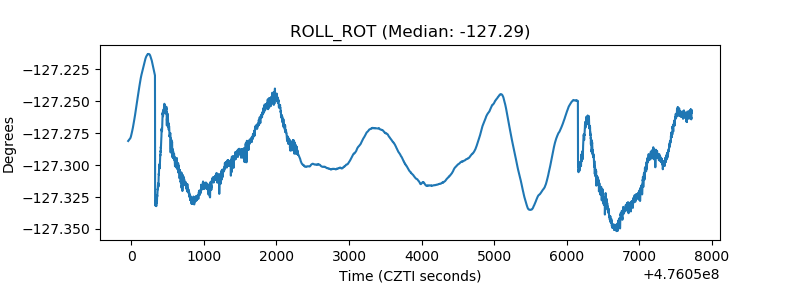 |
| _Roll_DEC | 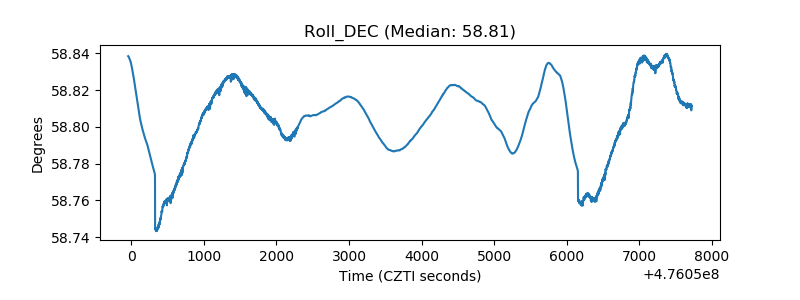 |
| _Roll_RA | 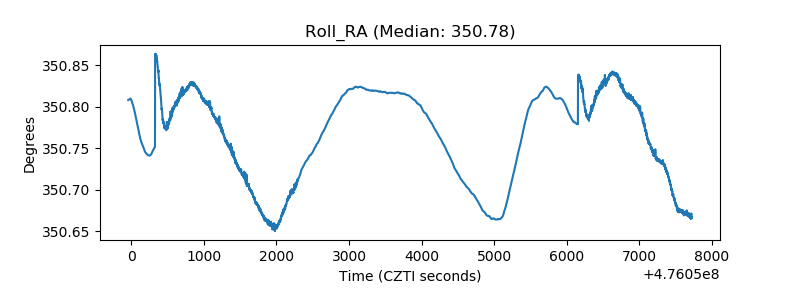 |
| Veto Counter | 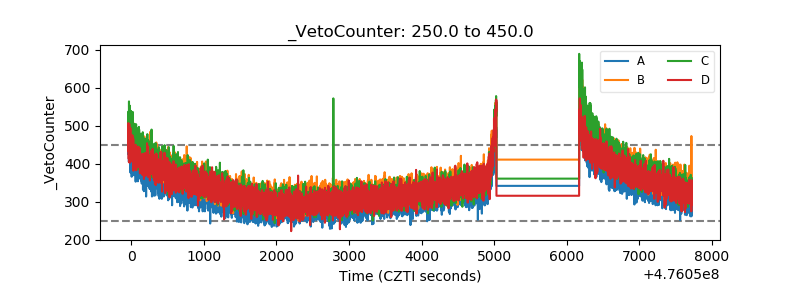 |