| Param | Original file | Final file |
|---|---|---|
| Filename | modeM0/AS1T05_239T01_9000006444_50551cztM0_level2.fits | modeM0/AS1T05_239T01_9000006444_50551cztM0_level2_quad_clean.evt |
| Size (bytes) | 1,179,164,160 | 156,185,280 |
| Size | 1.1 GB | 148.9 MB |
| Events in quadrant A | 8,864,983 | 1,070,475 |
| Events in quadrant B | 7,830,656 | 1,178,968 |
| Events in quadrant C | 17,204,278 | 687,047 |
| Events in quadrant D | 8,848,704 | 987,032 |
| Mode M0 | |||
|---|---|---|---|
| Quadrant | BADHDUFLAG | Total packets | Discarded packets |
| A | 0 | 34136 | 3 |
| B | 0 | 31489 | 3 |
| C | 0 | 59090 | 3 |
| D | 0 | 34482 | 4 |
| Mode M9 | |||
|---|---|---|---|
| Quadrant | BADHDUFLAG | Total packets | Discarded packets |
| A | 0 | 33 | 0 |
| B | 0 | 33 | 0 |
| C | 0 | 34 | 0 |
| D | 0 | 34 | 0 |
| Mode SS | |||
|---|---|---|---|
| Quadrant | BADHDUFLAG | Total packets | Discarded packets |
| A | 0 | 236 | 0 |
| B | 0 | 236 | 0 |
| C | 0 | 236 | 0 |
| D | 0 | 236 | 0 |
| Quadrant | Total seconds | Saturated seconds | Saturation percentage |
|---|---|---|---|
| A | 11641 | 836 | 7.181514% |
| B | 11641 | 702 | 6.030410% |
| C | 11641 | 4883 | 41.946568% |
| D | 11640 | 741 | 6.365979% |
Noise dominated data is calculated using 1-second bins in cleaned event files. If a bin has >2000 counts, and if more than 50% of those come from <1% of pixels, then it is considered to be noise-dominated and hence unusable.
| Quadrant | # 1 sec bins | Bins with >0 counts | Bins with >2000 counts | High rate bins dominated by noise | Noise dominated (total time) | Noise dominated (detector-on time) | Marked lightcurve |
|---|---|---|---|---|---|---|---|
| A | 14011 | 11643 | 632 | 632 | 4.51% | 5.43% | 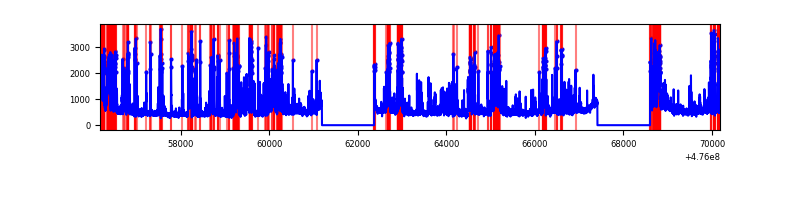 |
| B | 14011 | 11642 | 373 | 373 | 2.66% | 3.20% | 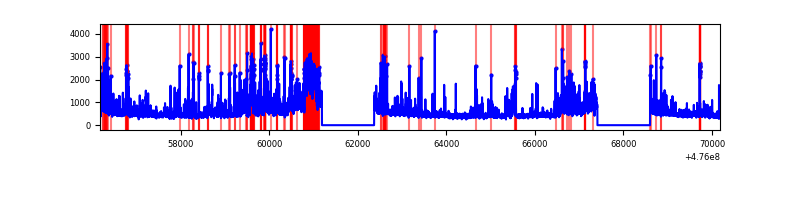 |
| C | 14011 | 11643 | 3522 | 3522 | 25.14% | 30.25% | 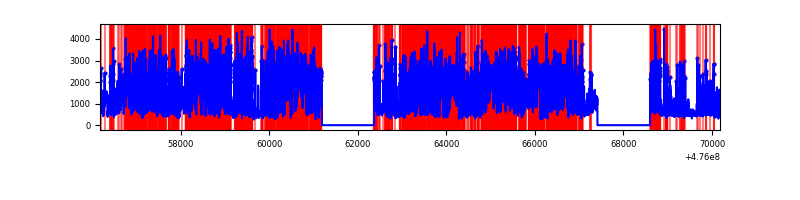 |
| D | 14010 | 11642 | 600 | 600 | 4.28% | 5.15% | 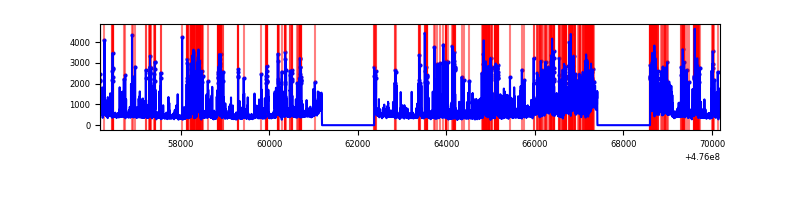 |
Top three noisy pixels from each quadrant. If the there are fewer than three noisy pixels in the level2.evt file, extra rows are filled as -1
| Pixel properties | Quadrant properties | ||||||
|---|---|---|---|---|---|---|---|
| Quadrant | DetID | PixID | Counts | Sigma | Mean | Median | Sigma |
| A | 12 | 250 | 1256178 | 4064.68 | 1244 | 1212 | 308.7 |
| A | 8 | 247 | 518684 | 1676.03 | 1244 | 1212 | 308.7 |
| A | 12 | 80 | 348493 | 1124.8 | 1244 | 1212 | 308.7 |
| B | 4 | 170 | 824710 | 3182.04 | 1241 | 1200 | 258.8 |
| B | 5 | 172 | 439914 | 1695.19 | 1241 | 1200 | 258.8 |
| B | 12 | 0 | 328026 | 1262.85 | 1241 | 1200 | 258.8 |
| C | 15 | 214 | 4395521 | 16687.42 | 944 | 935 | 263.3 |
| C | 15 | 178 | 2755933 | 10461.47 | 944 | 935 | 263.3 |
| C | 10 | 69 | 1415999 | 5373.38 | 944 | 935 | 263.3 |
| D | 6 | 42 | 917813 | 2739.26 | 1198 | 1153 | 334.6 |
| D | 8 | 48 | 723983 | 2160.04 | 1198 | 1153 | 334.6 |
| D | 2 | 165 | 409372 | 1219.88 | 1198 | 1153 | 334.6 |
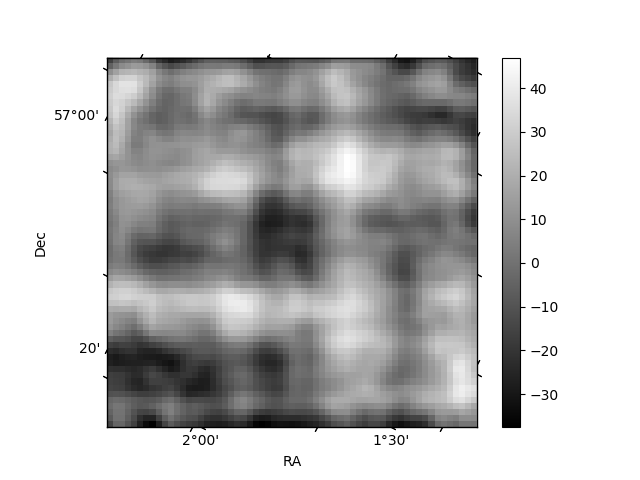
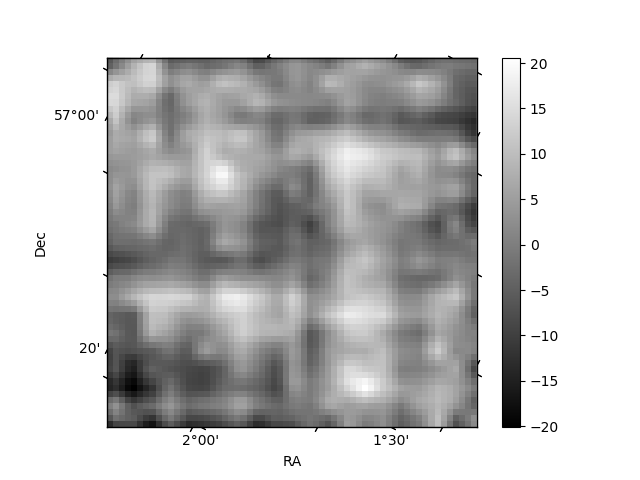
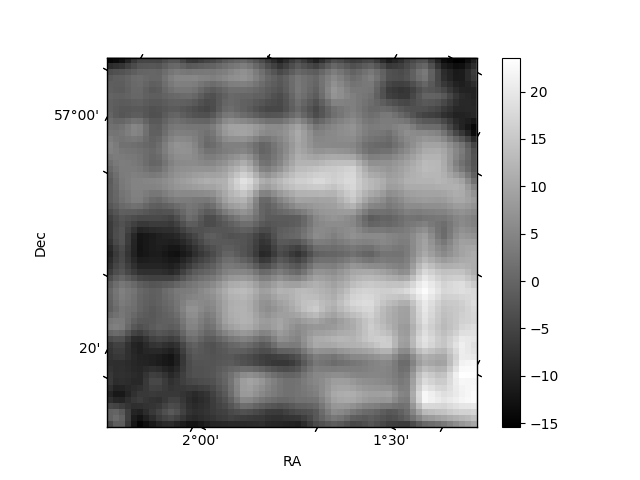
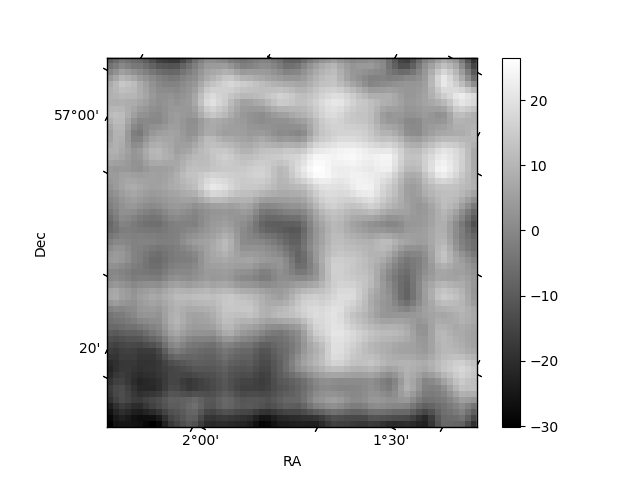
Histogram calculated using DETX and DETY for each event in the final _common_clean file
| Quadrant A | 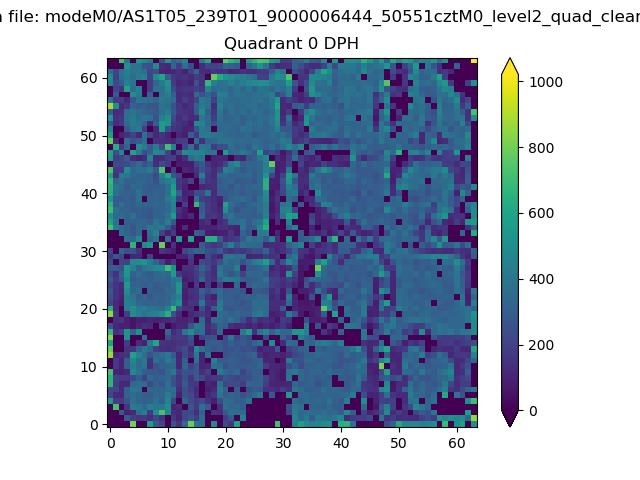 |
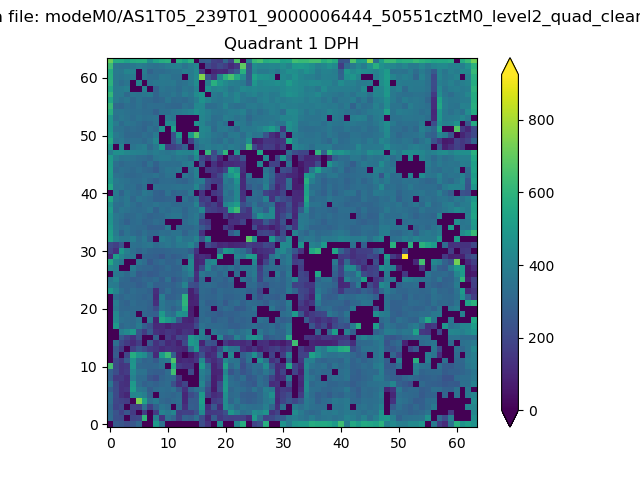 |
Quadrant B |
|---|---|---|---|
| Quadrant D | 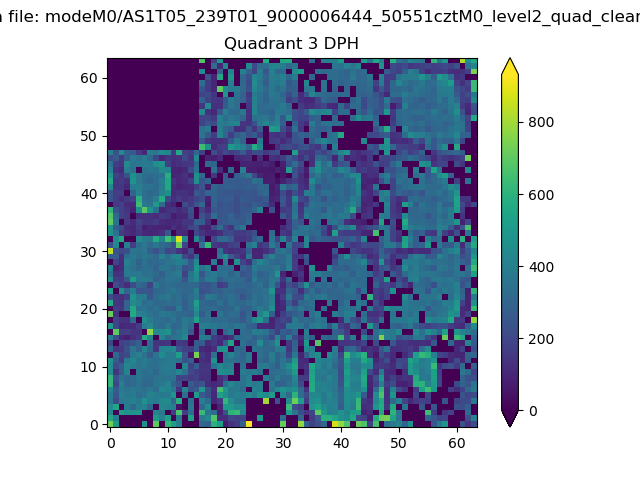 |
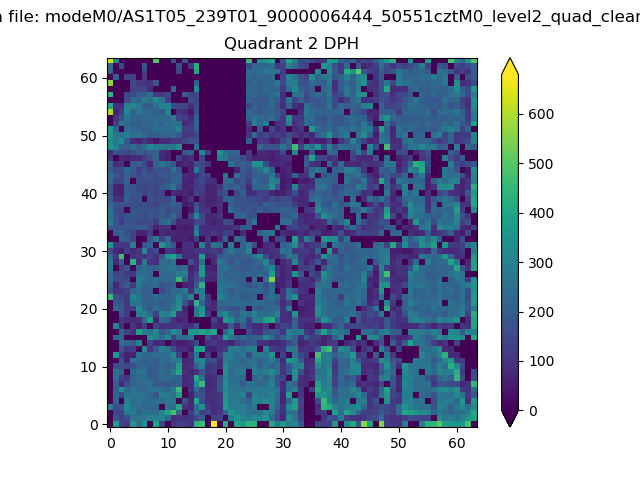 |
Quadrant C |
| Plot type | Count rate plots | Images |
|---|---|---|
| Comparison with Poisson distribution Blue bars denote a histogram of data divided into 1 sec bins. Red curve is a Poisson curve with rate = median count rate of data. |
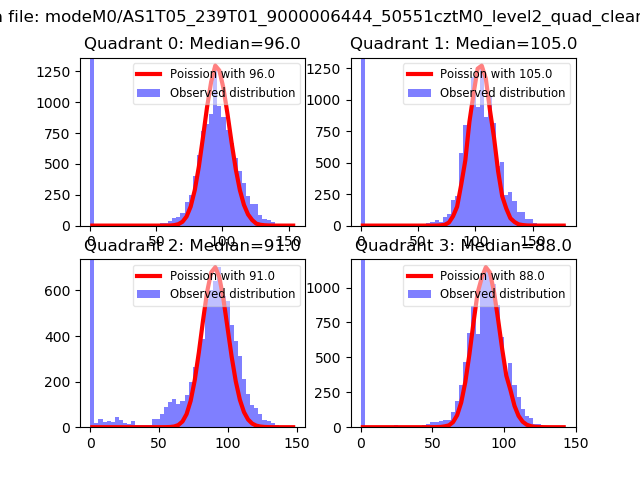 |
 |
| Quadrant-wise count rates Data is divided into 100 sec bins |
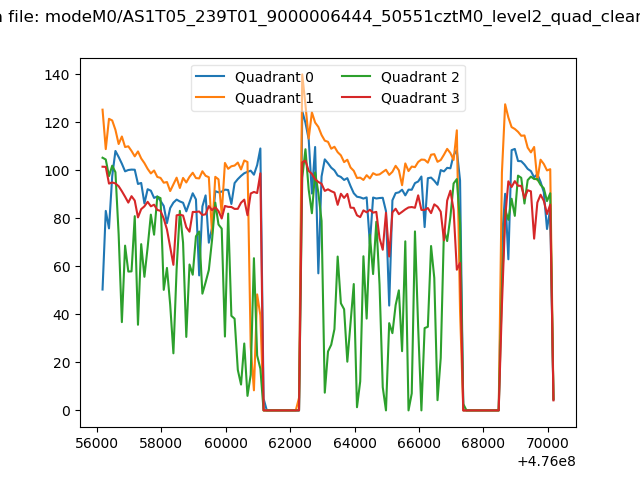 |
|
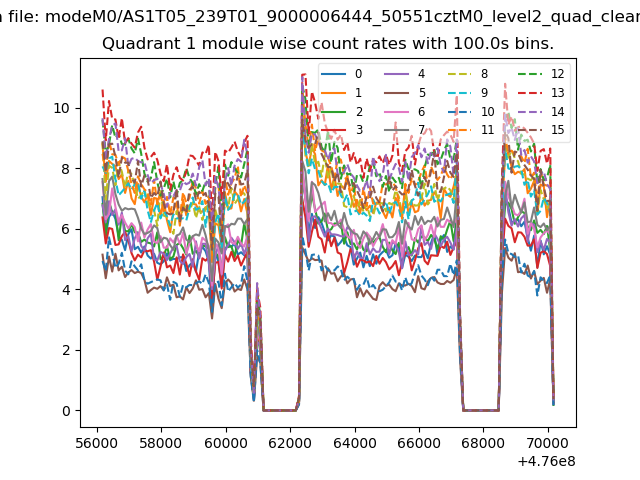
| Module-wise count rates for Quadrant A Data is divided into 100 sec bins |
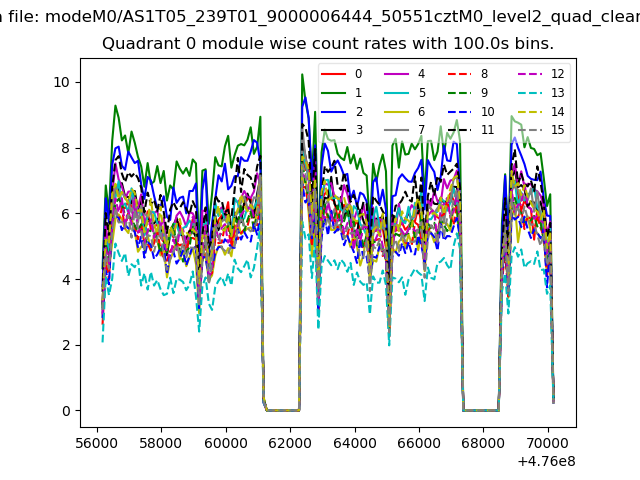 |
 |
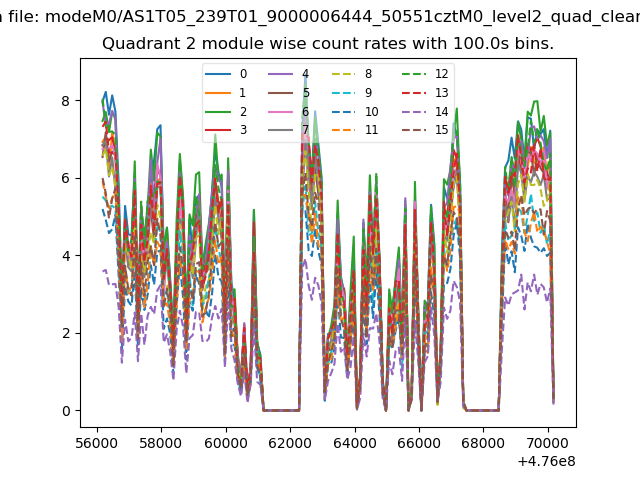
| Module-wise count rates for Quadrant B Data is divided into 100 sec bins |
 |
 |
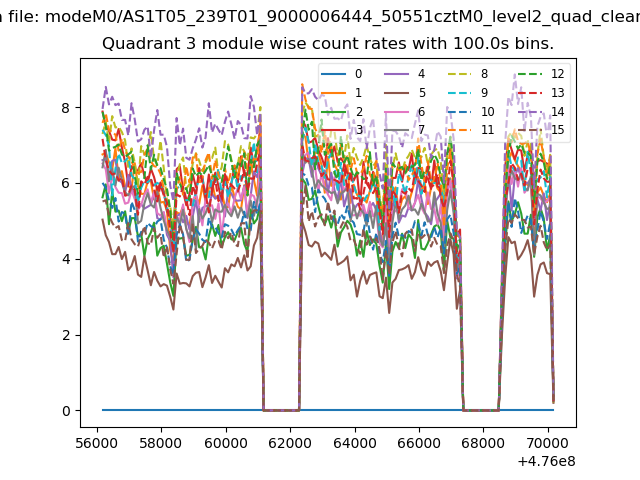
| Module-wise count rates for Quadrant C Data is divided into 100 sec bins |
 |
 |
| Module-wise count rates for Quadrant D Data is divided into 100 sec bins |
 |
 |
| Parameter | Plot |
|---|---|
| CZT HV Monitor | 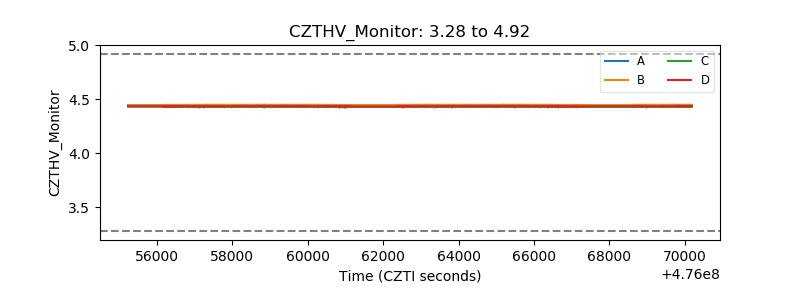 |
| D_VDD | 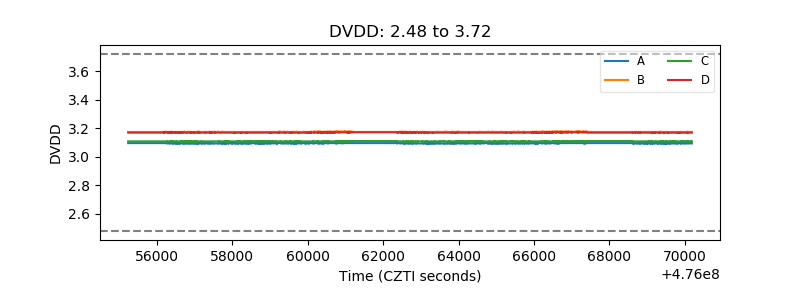 |
| Temperature 1 | 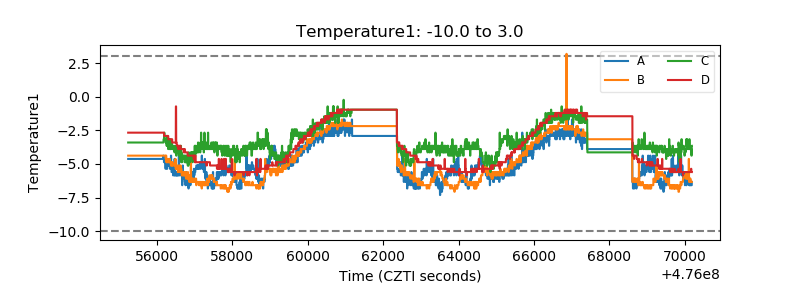 |
| Veto HV Monitor | 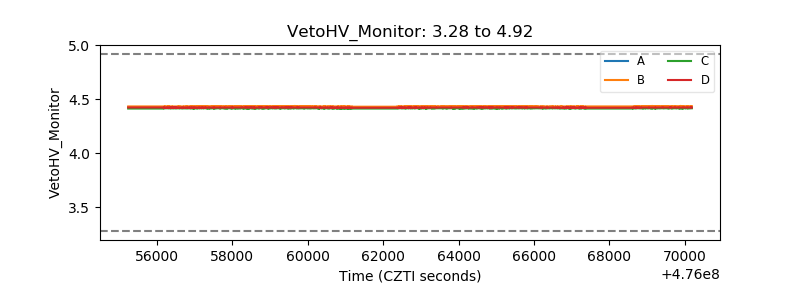 |
| Veto LLD | 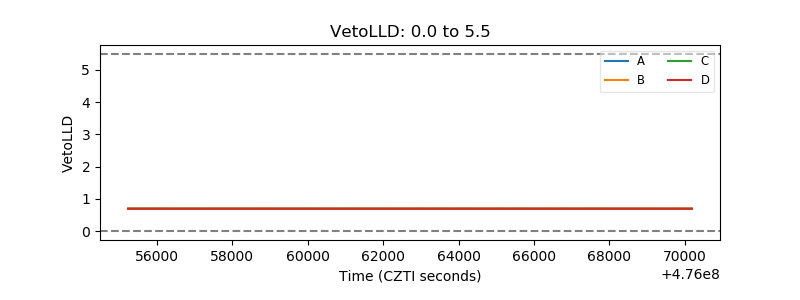 |
| Alpha Counter | 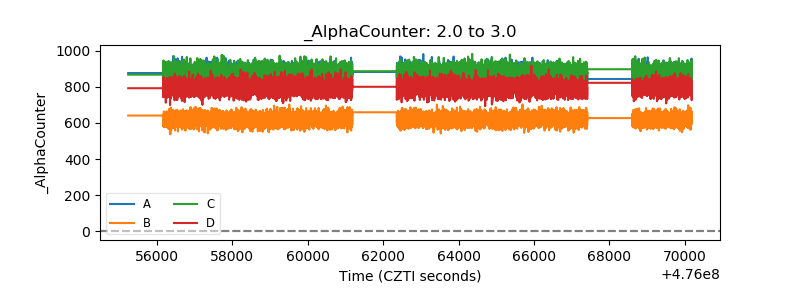 |
| _CPM_Rate | 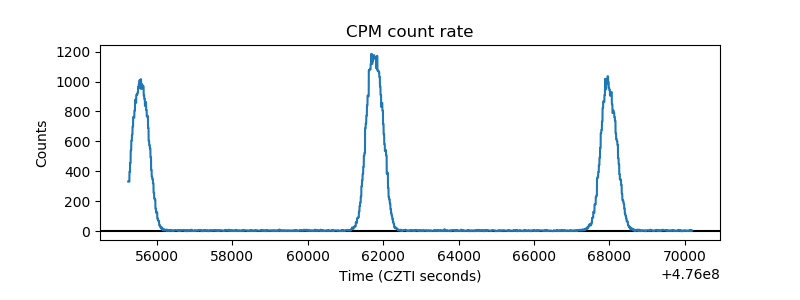 |
| CZT Counter | 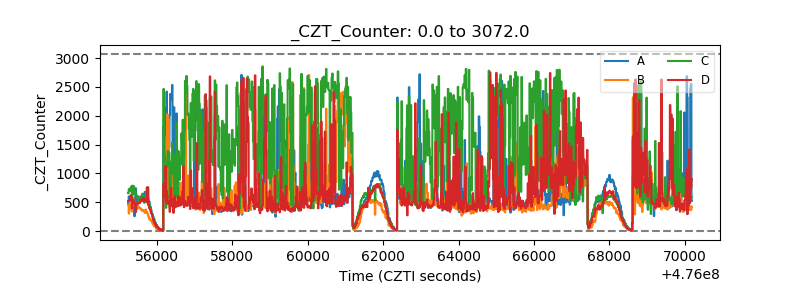 |
| +2.5 Volts monitor | 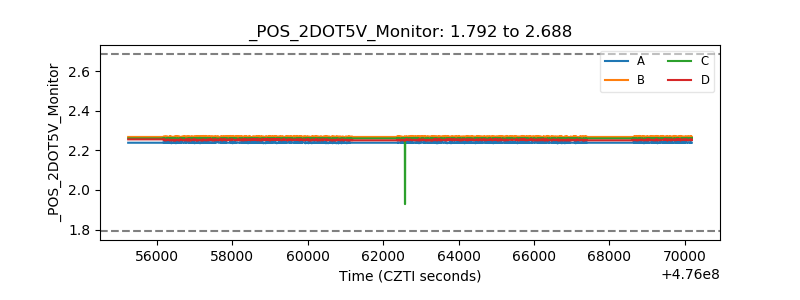 |
| +5 Volts monitor |  |
| _ROLL_ROT | 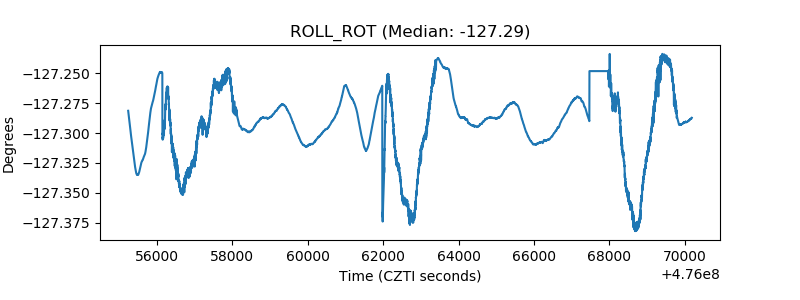 |
| _Roll_DEC | 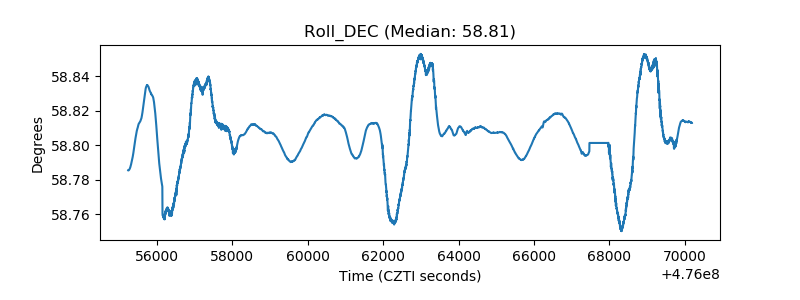 |
| _Roll_RA | 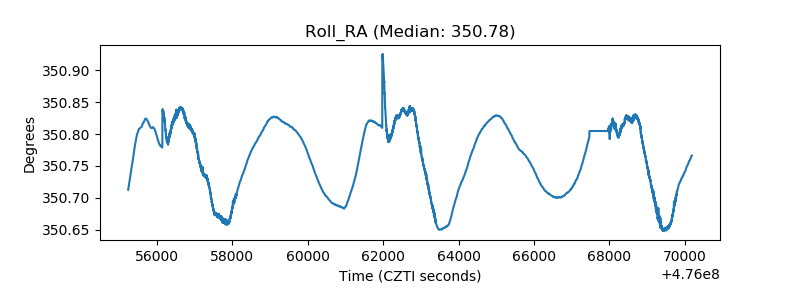 |
| Veto Counter | 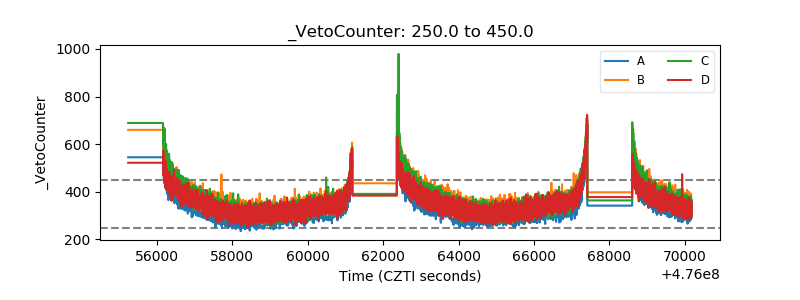 |