| Param | Original file | Final file |
|---|---|---|
| Filename | modeM0/AS1T05_239T01_9000006444_50552cztM0_level2.fits | modeM0/AS1T05_239T01_9000006444_50552cztM0_level2_quad_clean.evt |
| Size (bytes) | 671,086,080 | 88,966,080 |
| Size | 640.0 MB | 84.8 MB |
| Events in quadrant A | 5,874,748 | 594,627 |
| Events in quadrant B | 4,374,142 | 660,604 |
| Events in quadrant C | 7,860,908 | 463,180 |
| Events in quadrant D | 6,225,325 | 519,567 |
| Mode M0 | |||
|---|---|---|---|
| Quadrant | BADHDUFLAG | Total packets | Discarded packets |
| A | 0 | 21934 | 1 |
| B | 0 | 17636 | 1 |
| C | 0 | 27833 | 1 |
| D | 0 | 23048 | 1 |
| Mode M9 | |||
|---|---|---|---|
| Quadrant | BADHDUFLAG | Total packets | Discarded packets |
| A | 0 | 12 | 0 |
| B | 0 | 12 | 0 |
| C | 0 | 12 | 0 |
| D | 0 | 12 | 0 |
| Mode SS | |||
|---|---|---|---|
| Quadrant | BADHDUFLAG | Total packets | Discarded packets |
| A | 0 | 132 | 0 |
| B | 0 | 132 | 0 |
| C | 0 | 132 | 0 |
| D | 0 | 132 | 0 |
| Quadrant | Total seconds | Saturated seconds | Saturation percentage |
|---|---|---|---|
| A | 6534 | 639 | 9.779614% |
| B | 6535 | 447 | 6.840092% |
| C | 6535 | 1923 | 29.426167% |
| D | 6534 | 819 | 12.534435% |
Noise dominated data is calculated using 1-second bins in cleaned event files. If a bin has >2000 counts, and if more than 50% of those come from <1% of pixels, then it is considered to be noise-dominated and hence unusable.
| Quadrant | # 1 sec bins | Bins with >0 counts | Bins with >2000 counts | High rate bins dominated by noise | Noise dominated (total time) | Noise dominated (detector-on time) | Marked lightcurve |
|---|---|---|---|---|---|---|---|
| A | 7674 | 6535 | 497 | 497 | 6.48% | 7.61% | 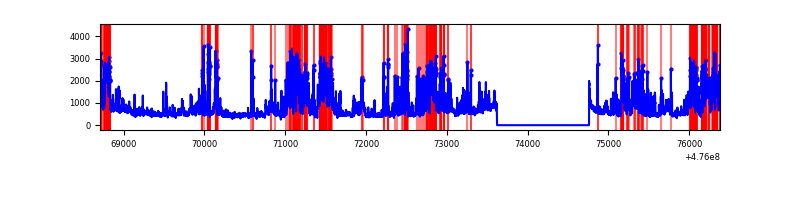 |
| B | 7675 | 6536 | 247 | 247 | 3.22% | 3.78% | 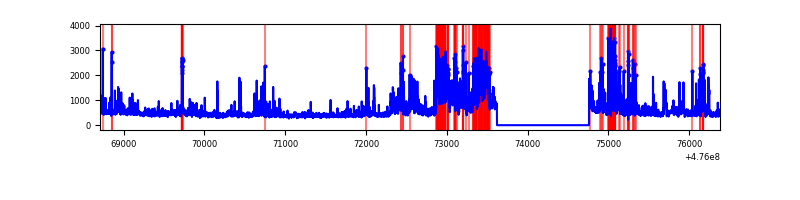 |
| C | 7675 | 6536 | 1172 | 1172 | 15.27% | 17.93% | 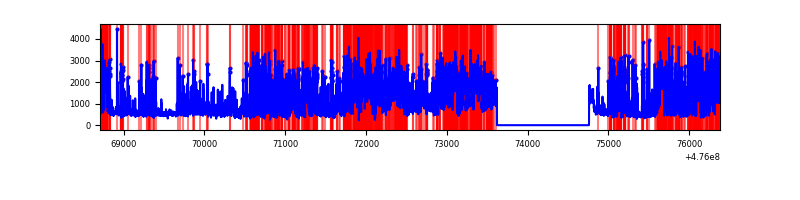 |
| D | 7674 | 6535 | 730 | 730 | 9.51% | 11.17% | 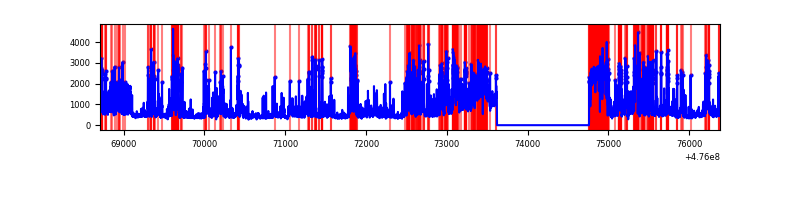 |
Top three noisy pixels from each quadrant. If the there are fewer than three noisy pixels in the level2.evt file, extra rows are filled as -1
| Pixel properties | Quadrant properties | ||||||
|---|---|---|---|---|---|---|---|
| Quadrant | DetID | PixID | Counts | Sigma | Mean | Median | Sigma |
| A | 12 | 250 | 1425755 | 8227.43 | 694 | 676 | 173.2 |
| A | 8 | 247 | 534231 | 3080.38 | 694 | 676 | 173.2 |
| A | 3 | 14 | 239448 | 1378.51 | 694 | 676 | 173.2 |
| B | 12 | 0 | 559185 | 3826.15 | 694 | 672 | 146.0 |
| B | 6 | 51 | 276154 | 1887.22 | 694 | 672 | 146.0 |
| B | 7 | 0 | 226434 | 1546.61 | 694 | 672 | 146.0 |
| C | 15 | 178 | 1199616 | 7354.58 | 586 | 581 | 163.0 |
| C | 15 | 218 | 959844 | 5883.88 | 586 | 581 | 163.0 |
| C | 15 | 157 | 648000 | 3971.1 | 586 | 581 | 163.0 |
| D | 6 | 42 | 1864491 | 10383.14 | 642 | 620 | 179.5 |
| D | 2 | 165 | 295228 | 1641.18 | 642 | 620 | 179.5 |
| D | 8 | 48 | 227283 | 1262.68 | 642 | 620 | 179.5 |
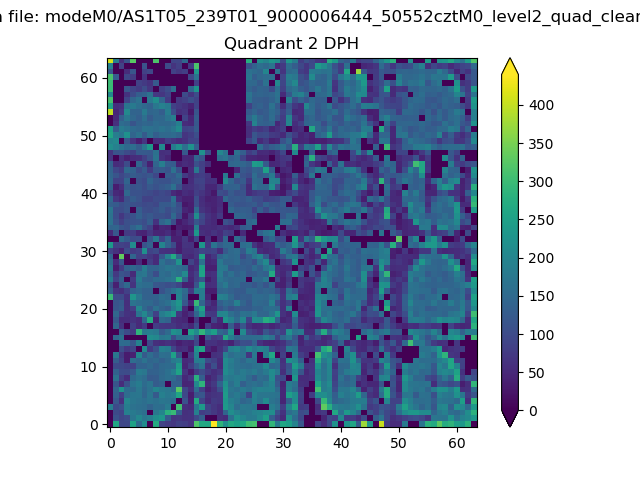
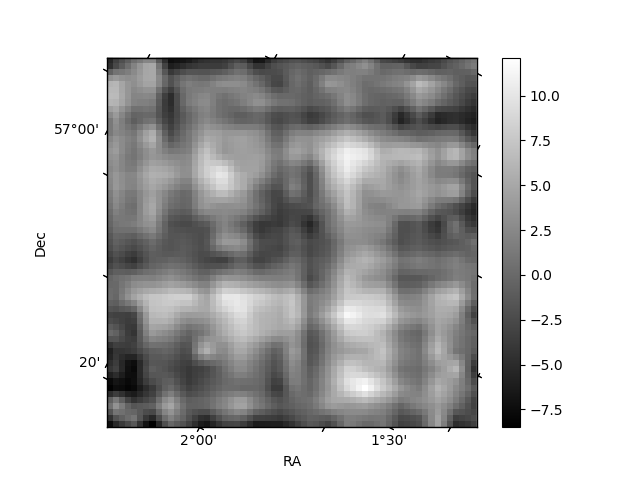
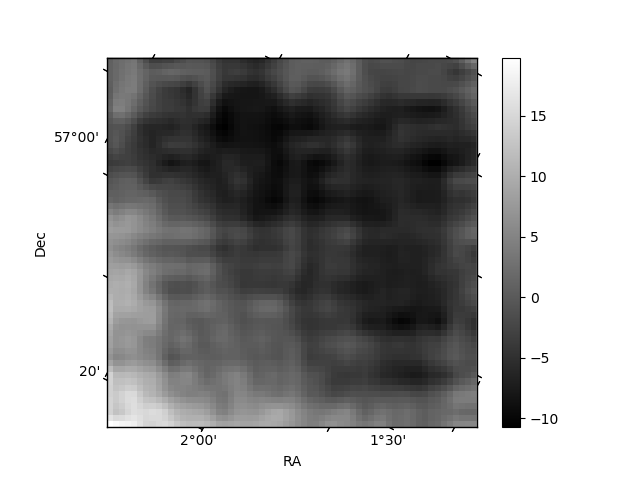
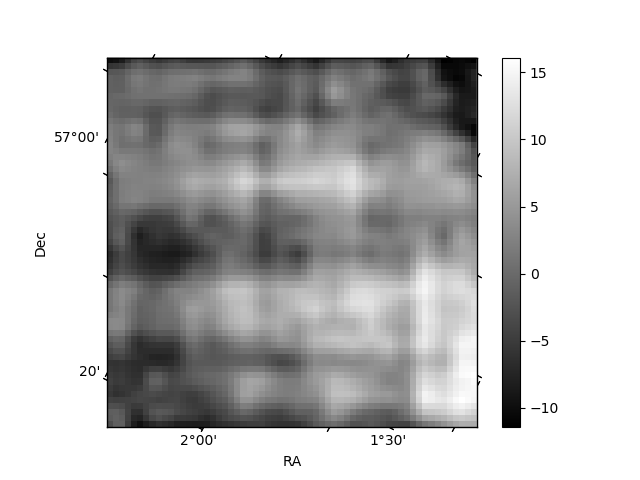
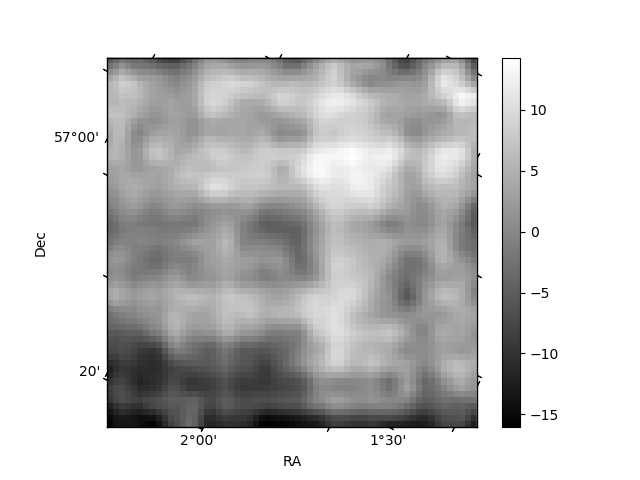
Histogram calculated using DETX and DETY for each event in the final _common_clean file
| Quadrant A | 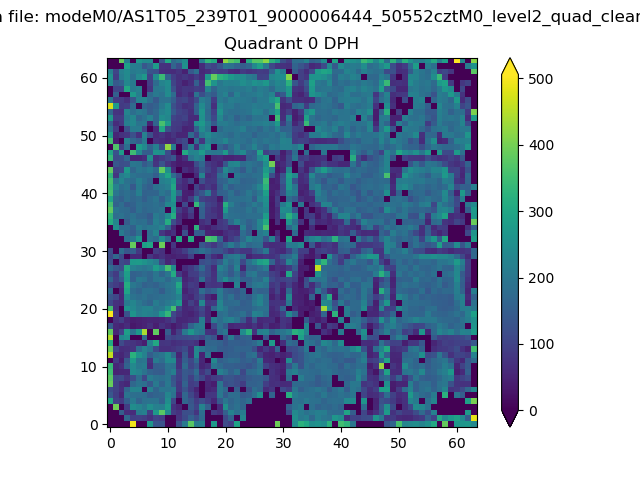 |
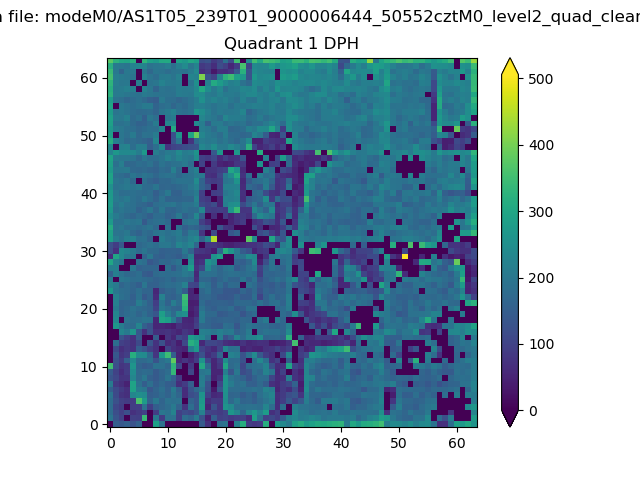 |
Quadrant B |
|---|---|---|---|
| Quadrant D | 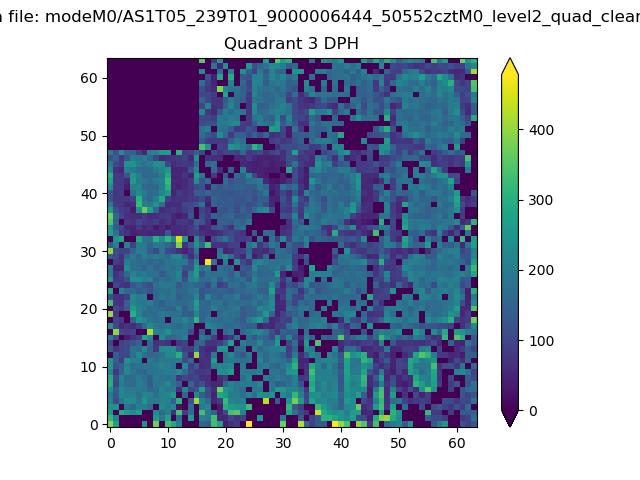 |
 |
Quadrant C |
| Plot type | Count rate plots | Images |
|---|---|---|
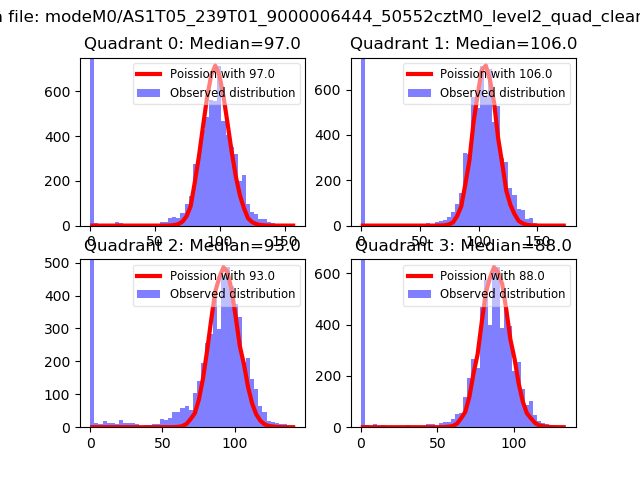
| Comparison with Poisson distribution Blue bars denote a histogram of data divided into 1 sec bins. Red curve is a Poisson curve with rate = median count rate of data. |
 |
 |
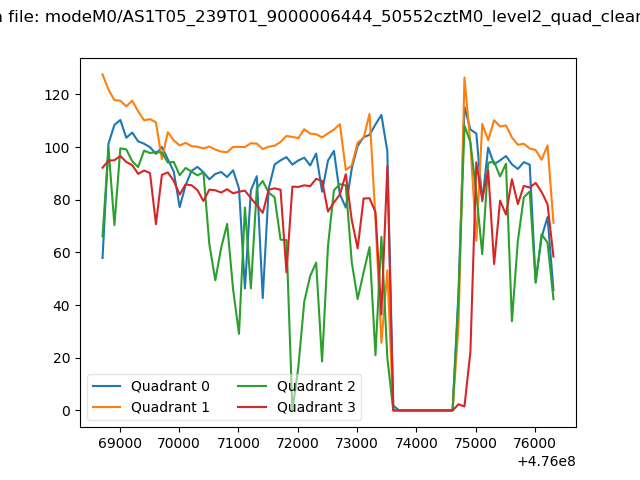
| Quadrant-wise count rates Data is divided into 100 sec bins |
 |
|
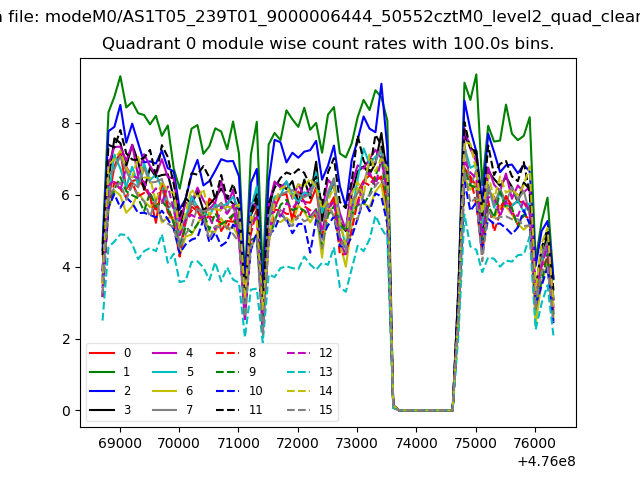
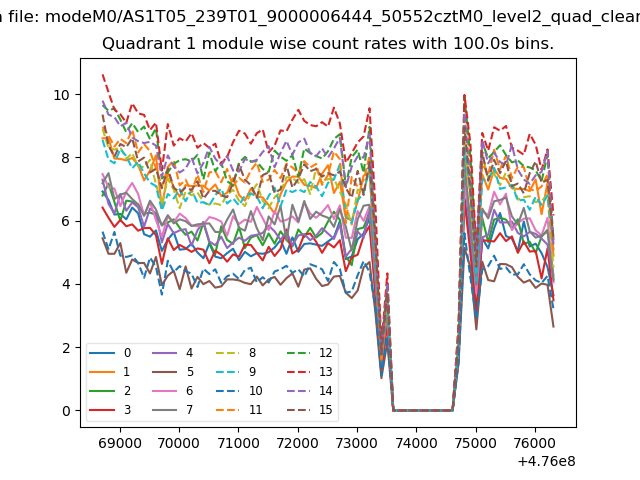
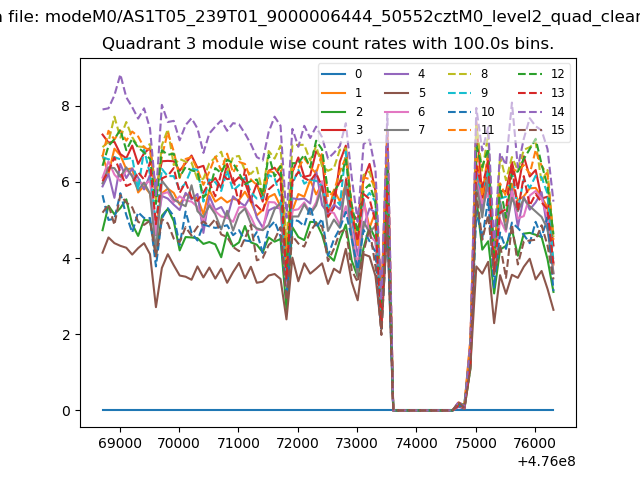
| Module-wise count rates for Quadrant A Data is divided into 100 sec bins |
 |
 |
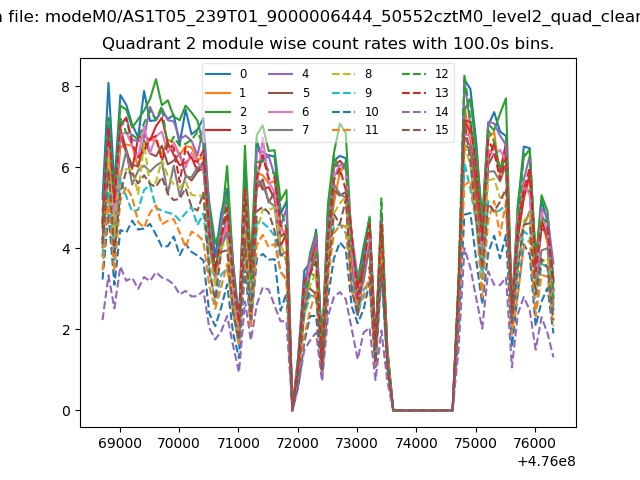
| Module-wise count rates for Quadrant B Data is divided into 100 sec bins |
 |
 |
| Module-wise count rates for Quadrant C Data is divided into 100 sec bins |
 |
 |
| Module-wise count rates for Quadrant D Data is divided into 100 sec bins |
 |
 |
| Parameter | Plot |
|---|---|
| CZT HV Monitor | 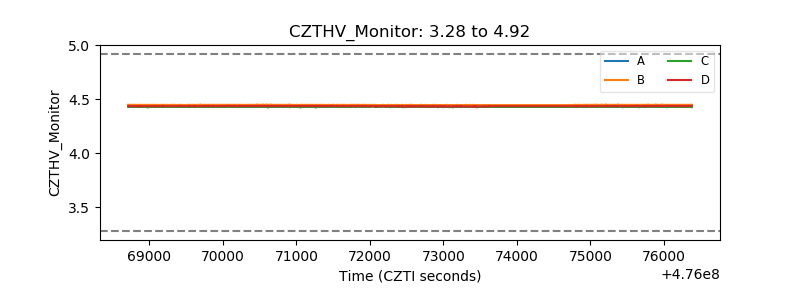 |
| D_VDD | 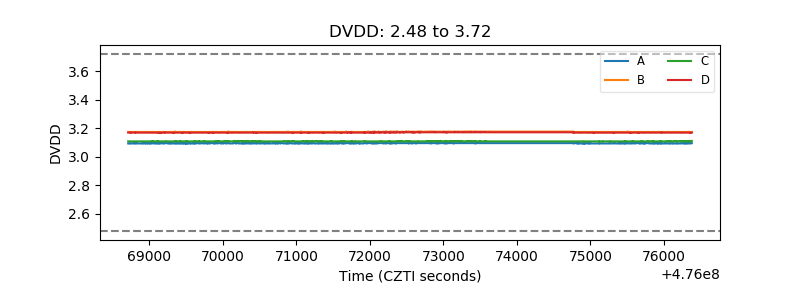 |
| Temperature 1 | 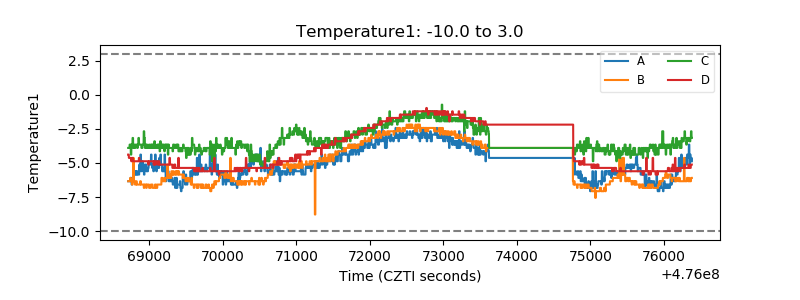 |
| Veto HV Monitor | 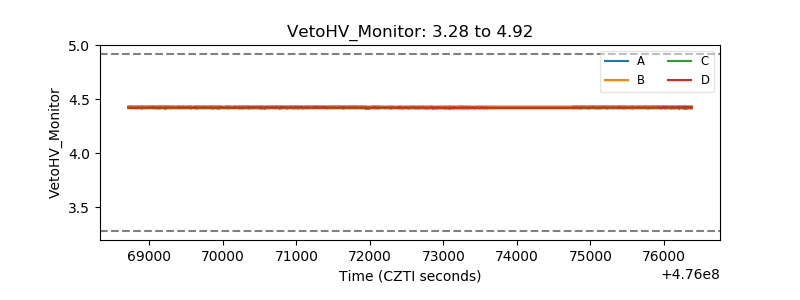 |
| Veto LLD | 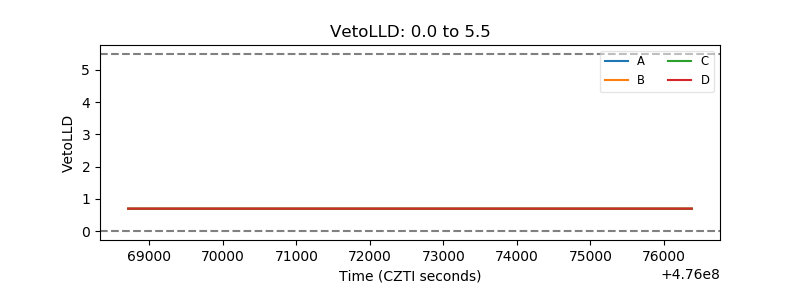 |
| Alpha Counter | 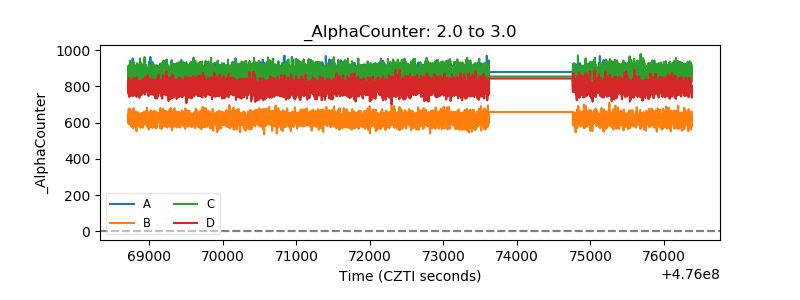 |
| _CPM_Rate | 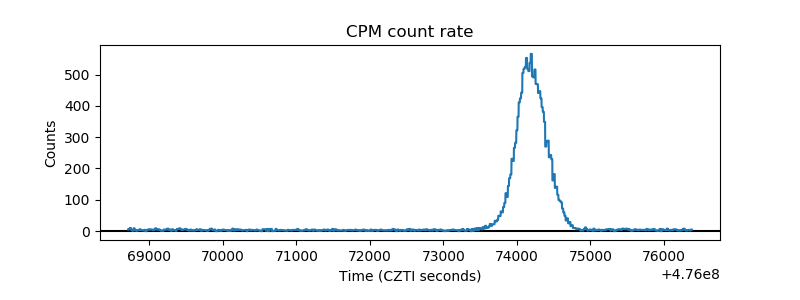 |
| CZT Counter | 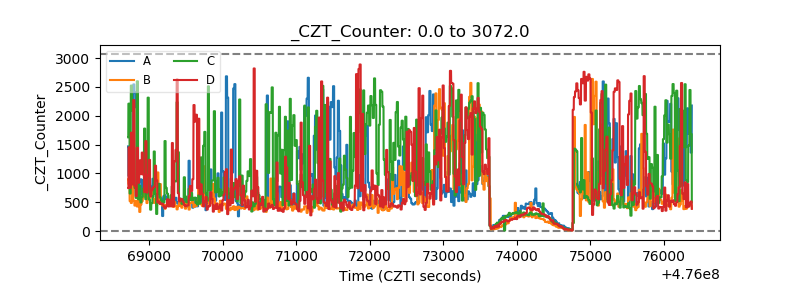 |
| +2.5 Volts monitor | 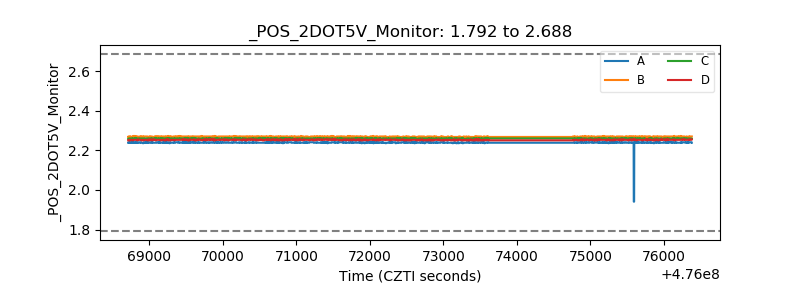 |
| +5 Volts monitor |  |
| _ROLL_ROT | 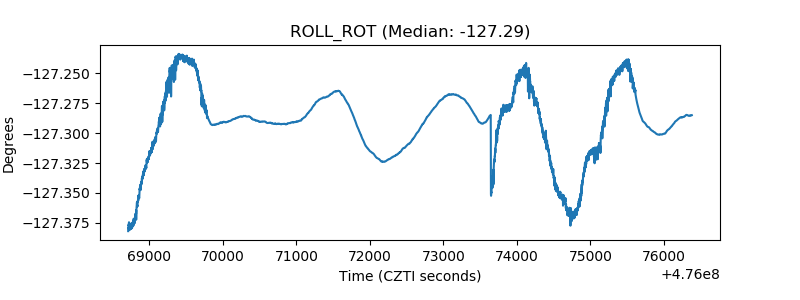 |
| _Roll_DEC | 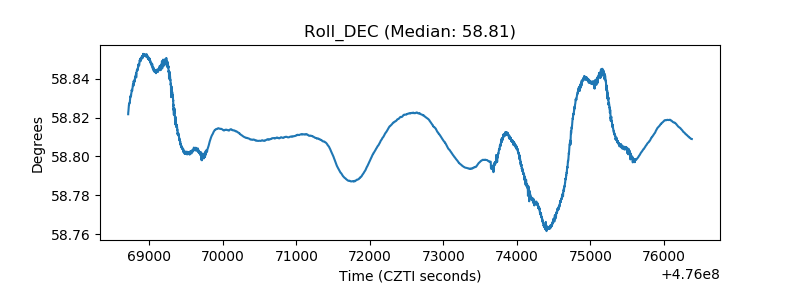 |
| _Roll_RA | 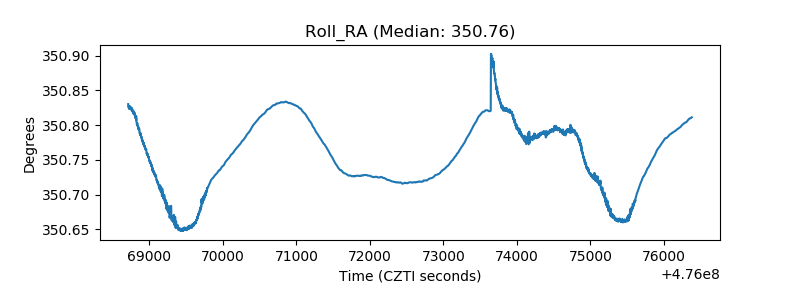 |
| Veto Counter | 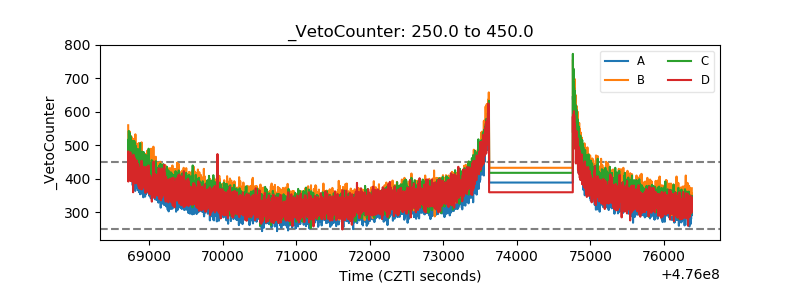 |