| Param | Original file | Final file |
|---|---|---|
| Filename | modeM0/AS1T05_239T01_9000006444_50553cztM0_level2.fits | modeM0/AS1T05_239T01_9000006444_50553cztM0_level2_quad_clean.evt |
| Size (bytes) | 617,924,160 | 75,386,880 |
| Size | 589.3 MB | 71.9 MB |
| Events in quadrant A | 6,956,126 | 425,973 |
| Events in quadrant B | 4,138,404 | 575,291 |
| Events in quadrant C | 7,271,618 | 380,257 |
| Events in quadrant D | 4,051,104 | 490,196 |
| Mode M0 | |||
|---|---|---|---|
| Quadrant | BADHDUFLAG | Total packets | Discarded packets |
| A | 0 | 24734 | 1 |
| B | 0 | 16408 | 1 |
| C | 0 | 25659 | 1 |
| D | 0 | 16201 | 1 |
| Mode M9 | |||
|---|---|---|---|
| Quadrant | BADHDUFLAG | Total packets | Discarded packets |
| A | 0 | 10 | 0 |
| B | 0 | 10 | 0 |
| C | 0 | 10 | 0 |
| D | 0 | 10 | 0 |
| Mode SS | |||
|---|---|---|---|
| Quadrant | BADHDUFLAG | Total packets | Discarded packets |
| A | 0 | 120 | 0 |
| B | 0 | 120 | 0 |
| C | 0 | 120 | 0 |
| D | 0 | 120 | 0 |
| Quadrant | Total seconds | Saturated seconds | Saturation percentage |
|---|---|---|---|
| A | 5876 | 1533 | 26.089176% |
| B | 5876 | 393 | 6.688223% |
| C | 5877 | 1967 | 33.469457% |
| D | 5877 | 270 | 4.594181% |
Noise dominated data is calculated using 1-second bins in cleaned event files. If a bin has >2000 counts, and if more than 50% of those come from <1% of pixels, then it is considered to be noise-dominated and hence unusable.
| Quadrant | # 1 sec bins | Bins with >0 counts | Bins with >2000 counts | High rate bins dominated by noise | Noise dominated (total time) | Noise dominated (detector-on time) | Marked lightcurve |
|---|---|---|---|---|---|---|---|
| A | 6891 | 5876 | 1220 | 1220 | 17.70% | 20.76% | 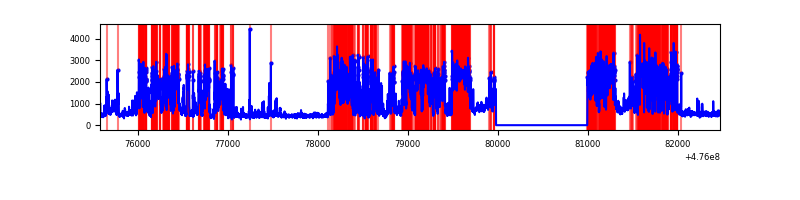 |
| B | 6891 | 5877 | 181 | 181 | 2.63% | 3.08% | 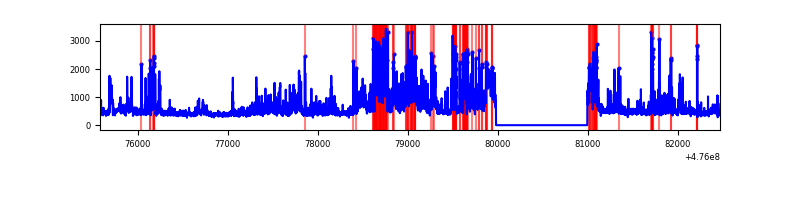 |
| C | 6891 | 5877 | 1341 | 1341 | 19.46% | 22.82% | 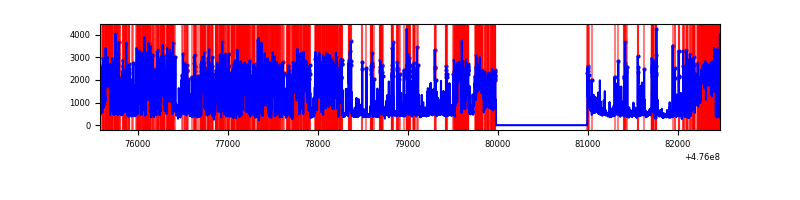 |
| D | 6892 | 5878 | 216 | 216 | 3.13% | 3.67% | 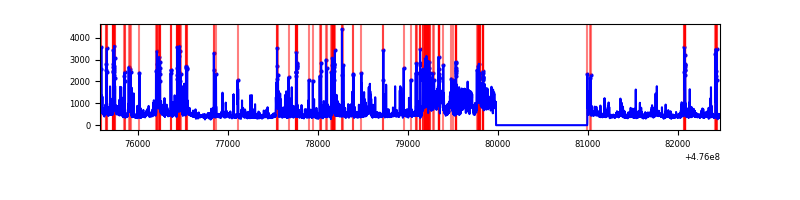 |
Top three noisy pixels from each quadrant. If the there are fewer than three noisy pixels in the level2.evt file, extra rows are filled as -1
| Pixel properties | Quadrant properties | ||||||
|---|---|---|---|---|---|---|---|
| Quadrant | DetID | PixID | Counts | Sigma | Mean | Median | Sigma |
| A | 12 | 250 | 2324448 | 16618.31 | 558 | 543 | 139.8 |
| A | 4 | 249 | 1209799 | 8647.42 | 558 | 543 | 139.8 |
| A | 3 | 130 | 388368 | 2773.34 | 558 | 543 | 139.8 |
| B | 7 | 0 | 660494 | 5114.89 | 605 | 585 | 129.0 |
| B | 12 | 0 | 475301 | 3679.48 | 605 | 585 | 129.0 |
| B | 5 | 185 | 118971 | 917.6 | 605 | 585 | 129.0 |
| C | 15 | 178 | 1900750 | 13899.52 | 489 | 486 | 136.7 |
| C | 15 | 214 | 1002597 | 7329.96 | 489 | 486 | 136.7 |
| C | 15 | 218 | 862822 | 6307.58 | 489 | 486 | 136.7 |
| D | 6 | 42 | 499488 | 3021.28 | 591 | 570 | 165.1 |
| D | 2 | 165 | 214155 | 1293.4 | 591 | 570 | 165.1 |
| D | 2 | 249 | 197842 | 1194.61 | 591 | 570 | 165.1 |
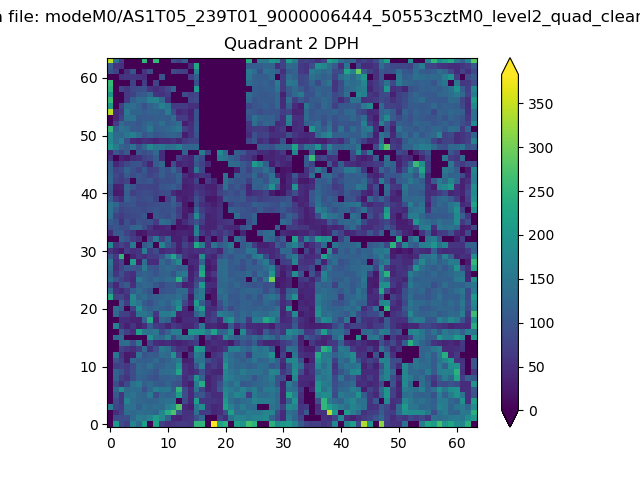
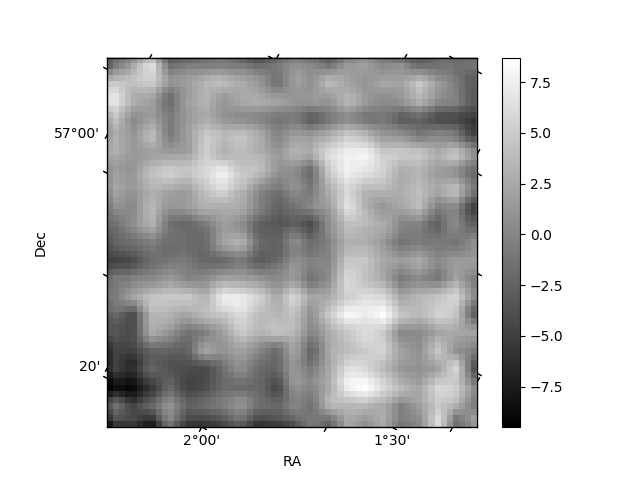
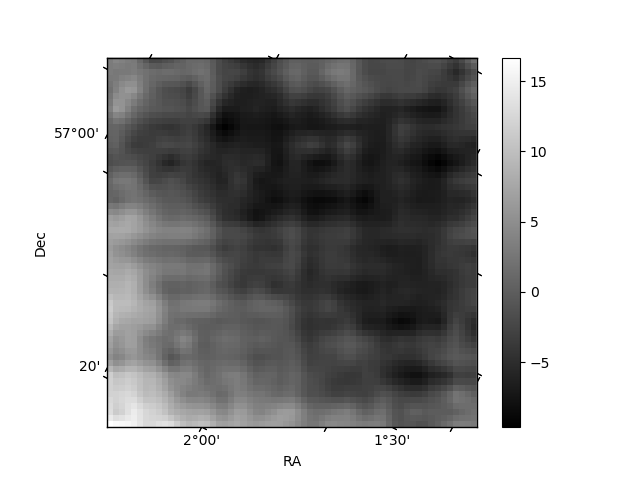
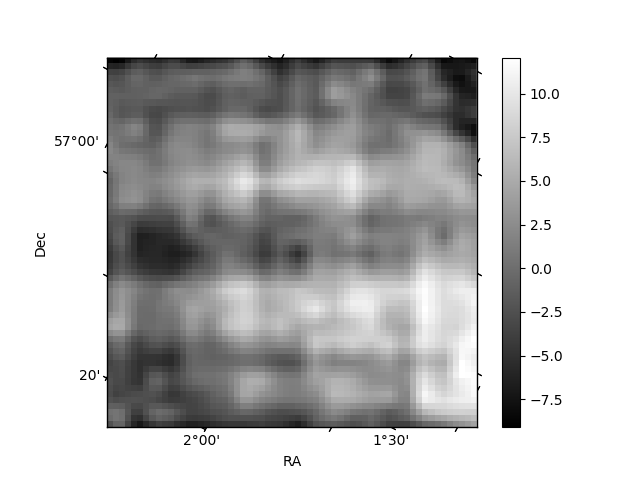
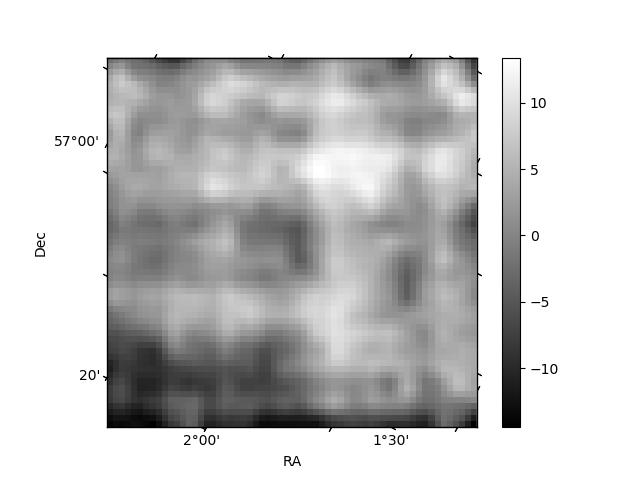
Histogram calculated using DETX and DETY for each event in the final _common_clean file
| Quadrant A | 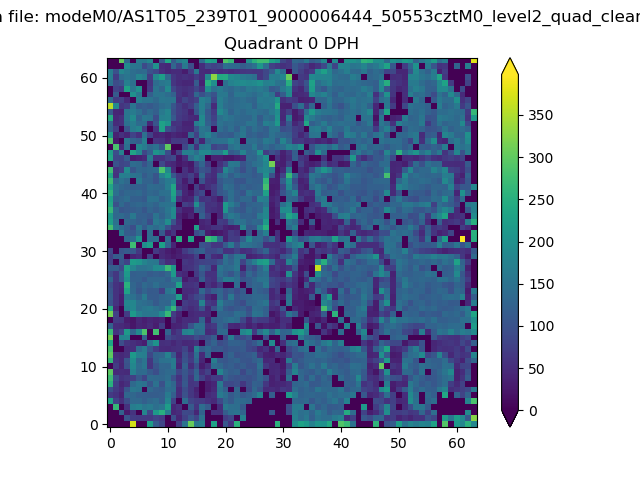 |
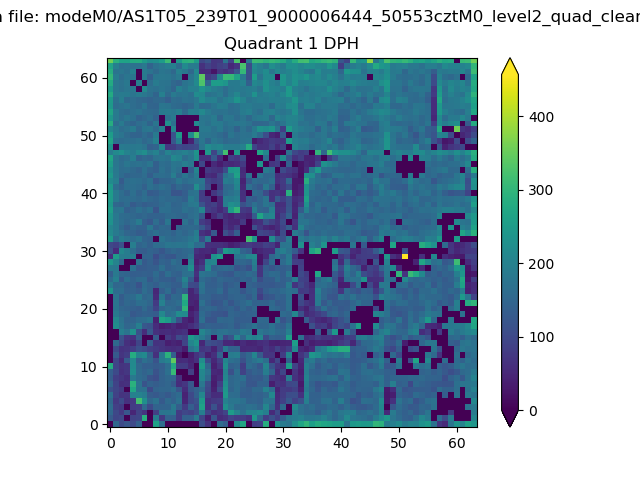 |
Quadrant B |
|---|---|---|---|
| Quadrant D | 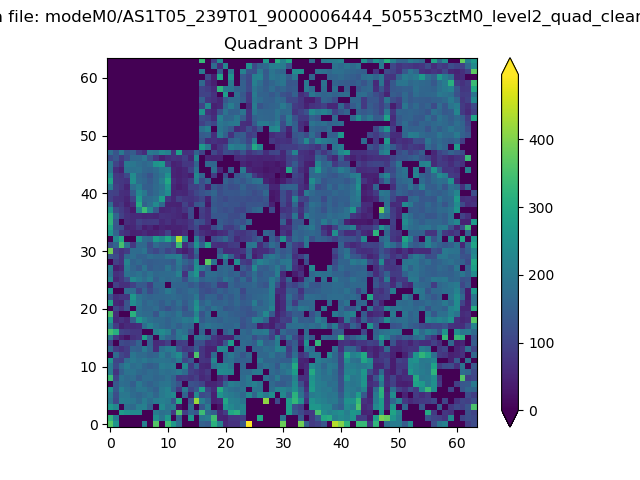 |
 |
Quadrant C |
| Plot type | Count rate plots | Images |
|---|---|---|
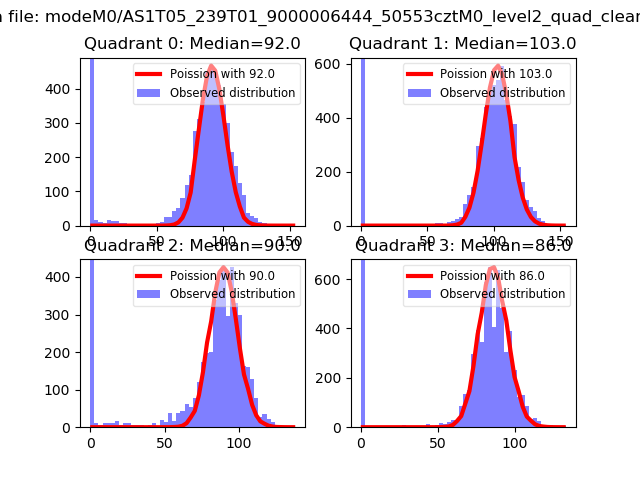
| Comparison with Poisson distribution Blue bars denote a histogram of data divided into 1 sec bins. Red curve is a Poisson curve with rate = median count rate of data. |
 |
 |
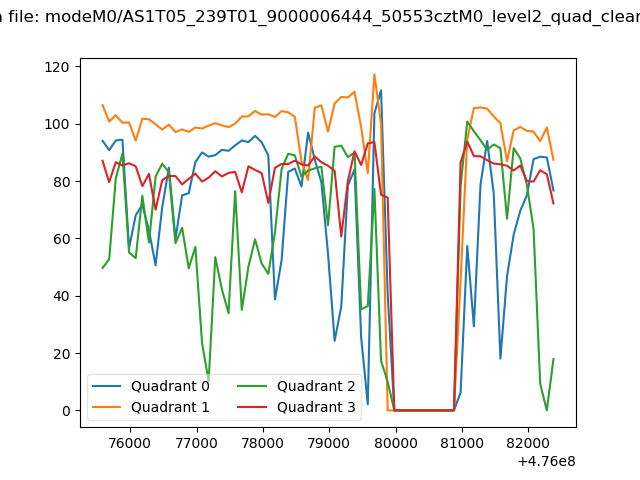
| Quadrant-wise count rates Data is divided into 100 sec bins |
 |
|
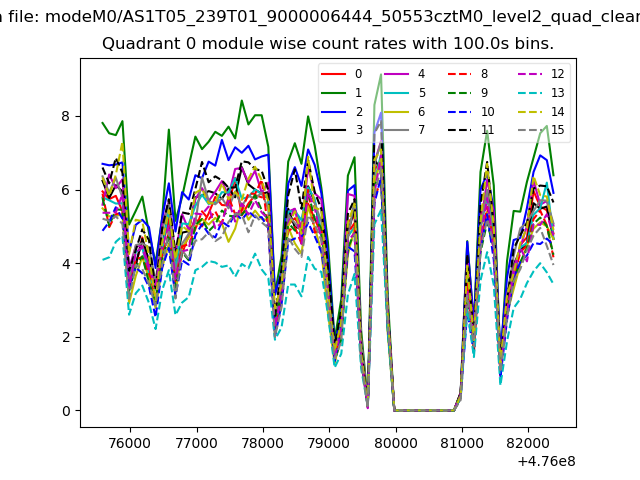
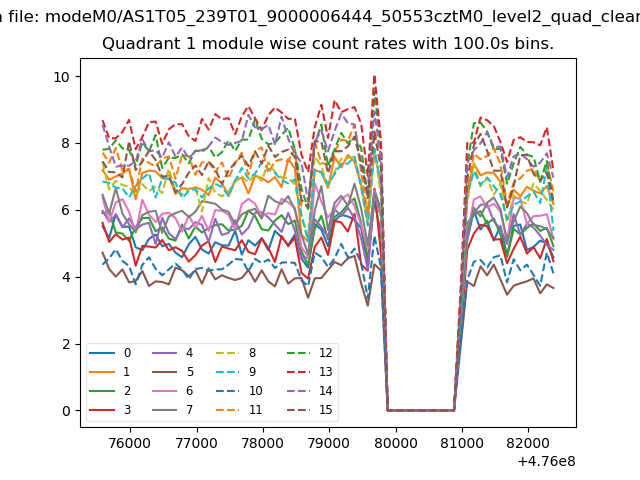
| Module-wise count rates for Quadrant A Data is divided into 100 sec bins |
 |
 |
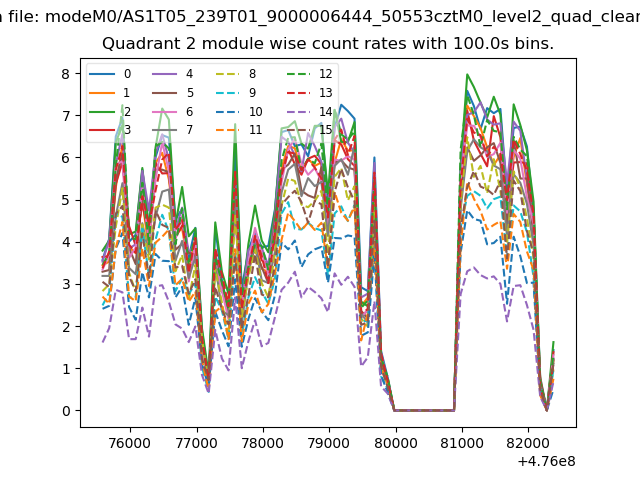
| Module-wise count rates for Quadrant B Data is divided into 100 sec bins |
 |
 |
| Module-wise count rates for Quadrant C Data is divided into 100 sec bins |
 |
 |
| Module-wise count rates for Quadrant D Data is divided into 100 sec bins |
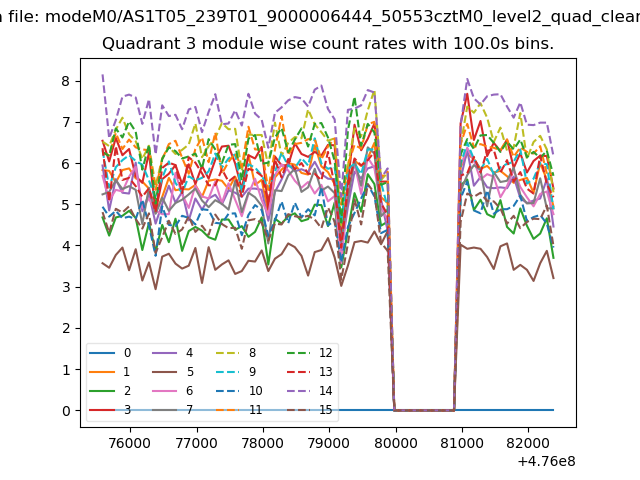 |
 |
| Parameter | Plot |
|---|---|
| CZT HV Monitor | 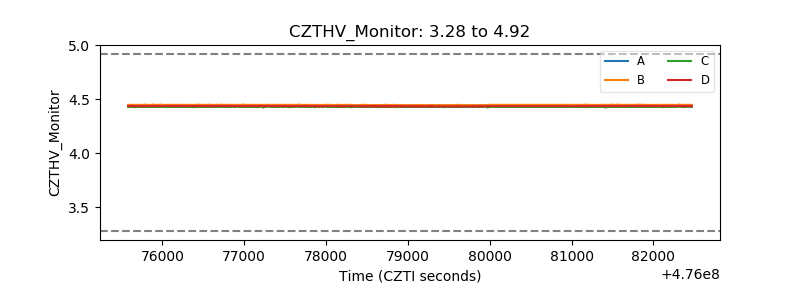 |
| D_VDD | 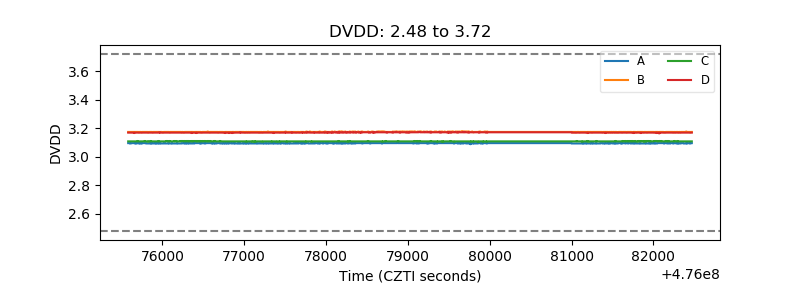 |
| Temperature 1 | 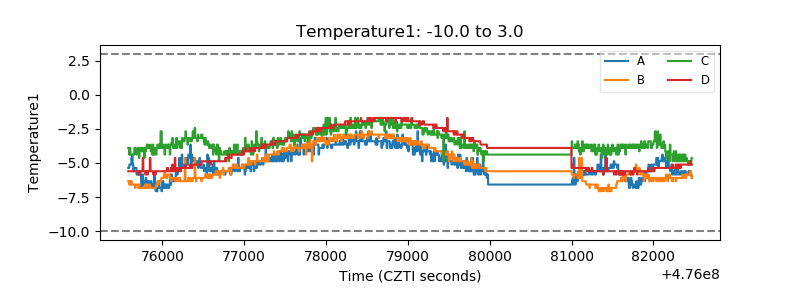 |
| Veto HV Monitor | 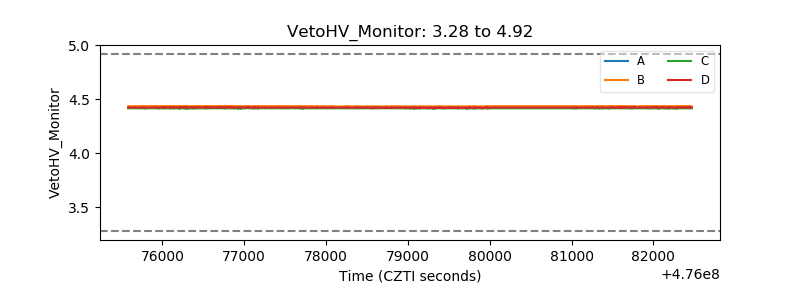 |
| Veto LLD | 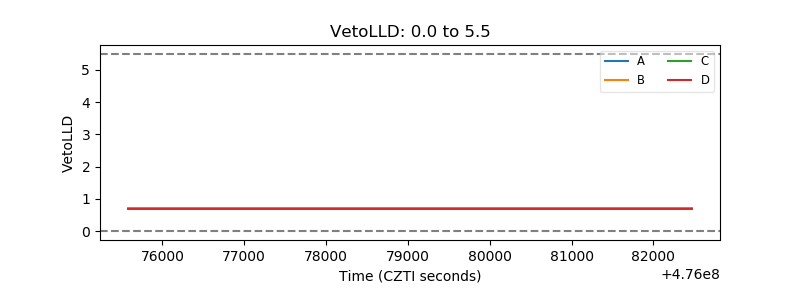 |
| Alpha Counter | 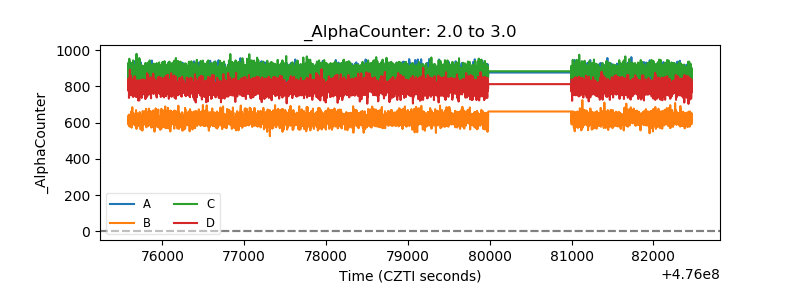 |
| _CPM_Rate | 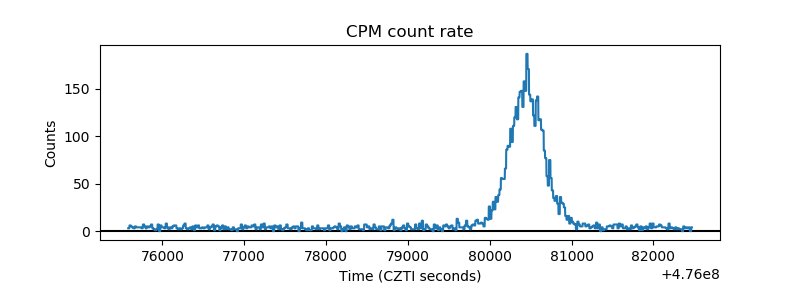 |
| CZT Counter | 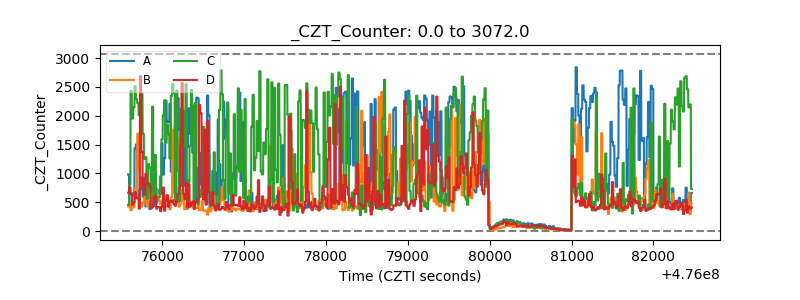 |
| +2.5 Volts monitor | 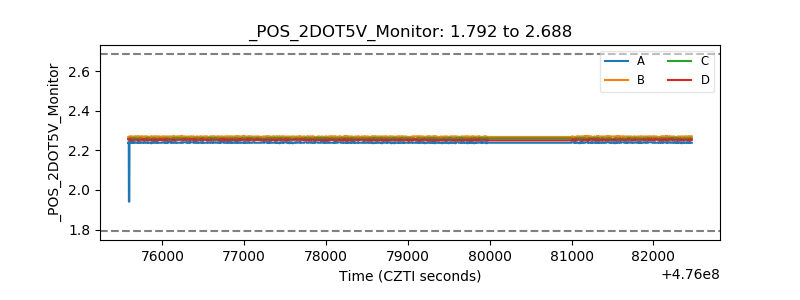 |
| +5 Volts monitor |  |
| _ROLL_ROT | 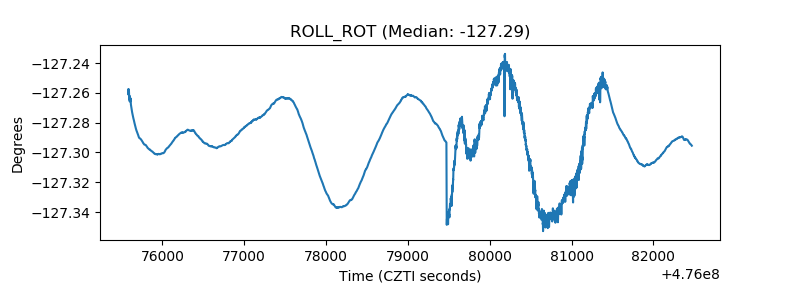 |
| _Roll_DEC | 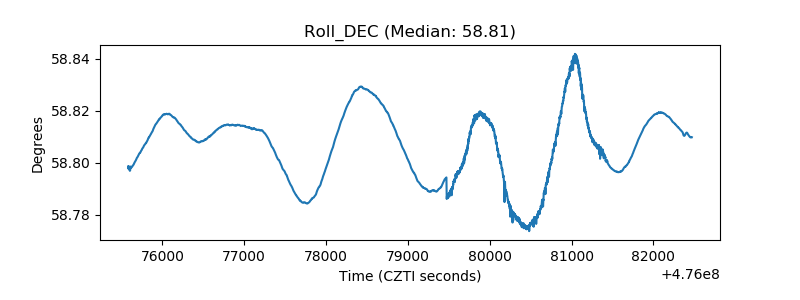 |
| _Roll_RA | 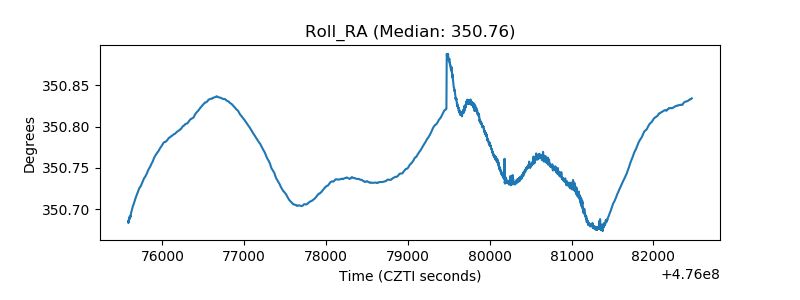 |
| Veto Counter | 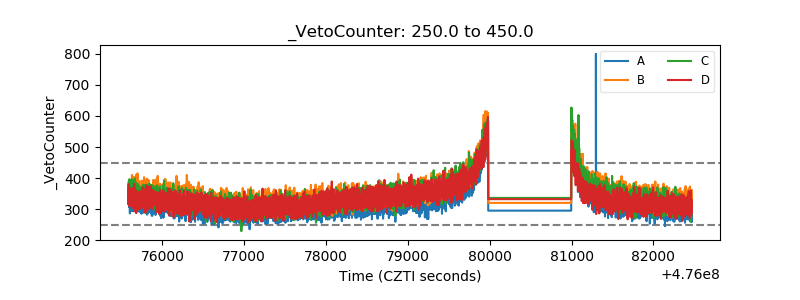 |