| Param | Original file | Final file |
|---|---|---|
| Filename | modeM0/AS1T05_239T01_9000006444_50554cztM0_level2.fits | modeM0/AS1T05_239T01_9000006444_50554cztM0_level2_quad_clean.evt |
| Size (bytes) | 672,232,320 | 93,352,320 |
| Size | 641.1 MB | 89.0 MB |
| Events in quadrant A | 6,085,332 | 594,608 |
| Events in quadrant B | 5,464,520 | 676,993 |
| Events in quadrant C | 8,177,034 | 463,635 |
| Events in quadrant D | 4,604,590 | 595,468 |
| Mode M0 | |||
|---|---|---|---|
| Quadrant | BADHDUFLAG | Total packets | Discarded packets |
| A | 0 | 22816 | 2 |
| B | 0 | 21105 | 2 |
| C | 0 | 29256 | 3 |
| D | 0 | 18860 | 2 |
| Mode M9 | |||
|---|---|---|---|
| Quadrant | BADHDUFLAG | Total packets | Discarded packets |
| A | 0 | 6 | 0 |
| B | 0 | 6 | 0 |
| C | 0 | 6 | 0 |
| D | 0 | 6 | 0 |
| Mode SS | |||
|---|---|---|---|
| Quadrant | BADHDUFLAG | Total packets | Discarded packets |
| A | 0 | 144 | 0 |
| B | 0 | 144 | 0 |
| C | 0 | 144 | 0 |
| D | 0 | 144 | 0 |
| Quadrant | Total seconds | Saturated seconds | Saturation percentage |
|---|---|---|---|
| A | 7117 | 855 | 12.013489% |
| B | 7118 | 663 | 9.314414% |
| C | 7117 | 2240 | 31.473936% |
| D | 7117 | 202 | 2.838275% |
Noise dominated data is calculated using 1-second bins in cleaned event files. If a bin has >2000 counts, and if more than 50% of those come from <1% of pixels, then it is considered to be noise-dominated and hence unusable.
| Quadrant | # 1 sec bins | Bins with >0 counts | Bins with >2000 counts | High rate bins dominated by noise | Noise dominated (total time) | Noise dominated (detector-on time) | Marked lightcurve |
|---|---|---|---|---|---|---|---|
| A | 7712 | 7118 | 629 | 629 | 8.16% | 8.84% | 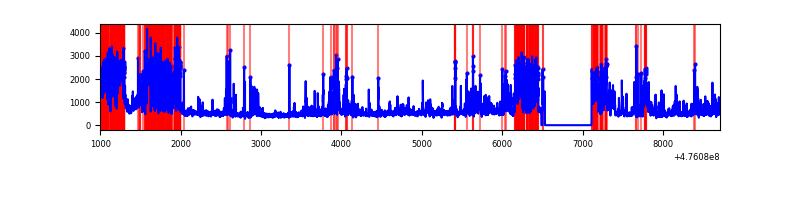 |
| B | 7713 | 7120 | 439 | 439 | 5.69% | 6.17% | 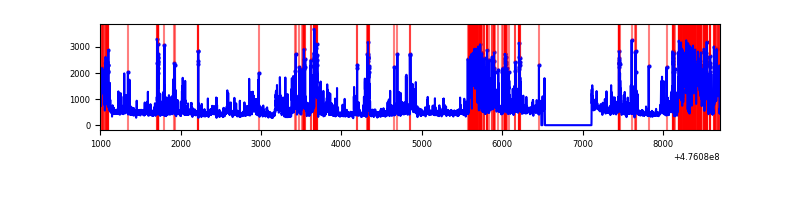 |
| C | 7712 | 7119 | 1526 | 1526 | 19.79% | 21.44% | 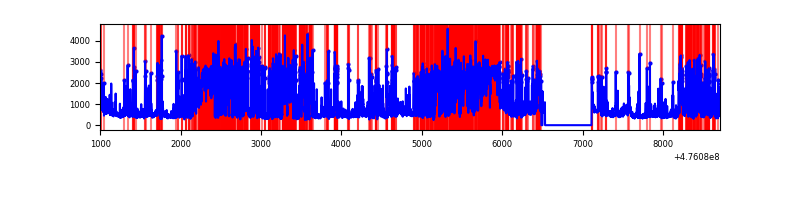 |
| D | 7712 | 7119 | 178 | 178 | 2.31% | 2.50% | 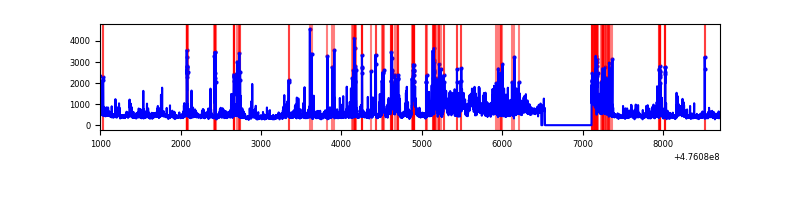 |
Top three noisy pixels from each quadrant. If the there are fewer than three noisy pixels in the level2.evt file, extra rows are filled as -1
| Pixel properties | Quadrant properties | ||||||
|---|---|---|---|---|---|---|---|
| Quadrant | DetID | PixID | Counts | Sigma | Mean | Median | Sigma |
| A | 4 | 249 | 1367571 | 7700.57 | 717 | 698 | 177.5 |
| A | 8 | 247 | 396311 | 2228.77 | 717 | 698 | 177.5 |
| A | 12 | 250 | 235645 | 1323.62 | 717 | 698 | 177.5 |
| B | 7 | 0 | 1575612 | 9976.57 | 732 | 707 | 157.9 |
| B | 5 | 185 | 265271 | 1675.93 | 732 | 707 | 157.9 |
| B | 4 | 216 | 107497 | 676.48 | 732 | 707 | 157.9 |
| C | 15 | 178 | 2199532 | 12849.18 | 597 | 590 | 171.1 |
| C | 15 | 214 | 1809150 | 10568.04 | 597 | 590 | 171.1 |
| C | 15 | 218 | 234306 | 1365.68 | 597 | 590 | 171.1 |
| D | 11 | 161 | 356701 | 1776.72 | 719 | 693 | 200.4 |
| D | 2 | 249 | 220685 | 1097.91 | 719 | 693 | 200.4 |
| D | 15 | 154 | 178285 | 886.31 | 719 | 693 | 200.4 |
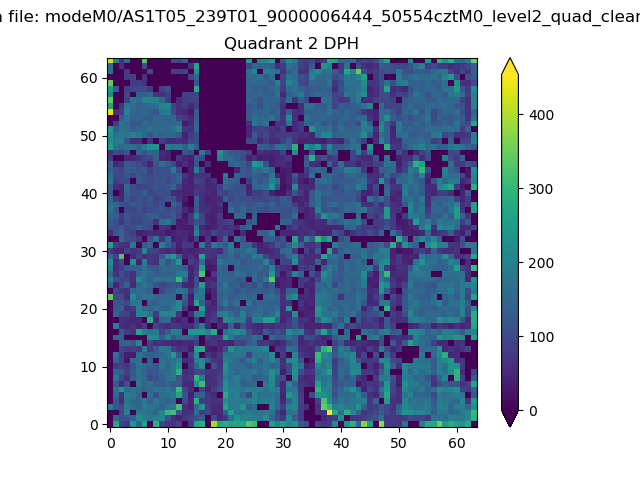
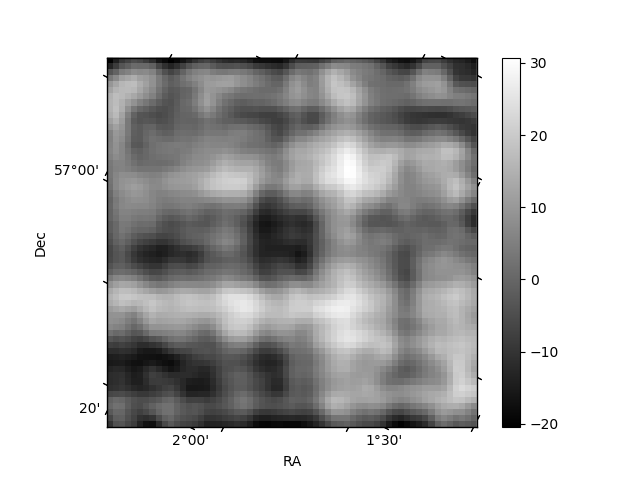
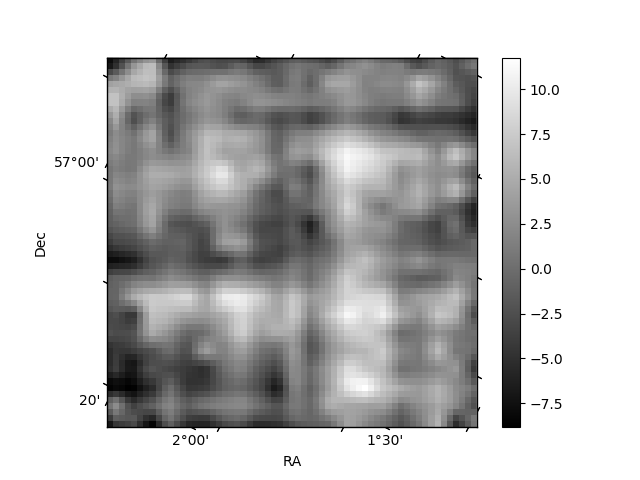
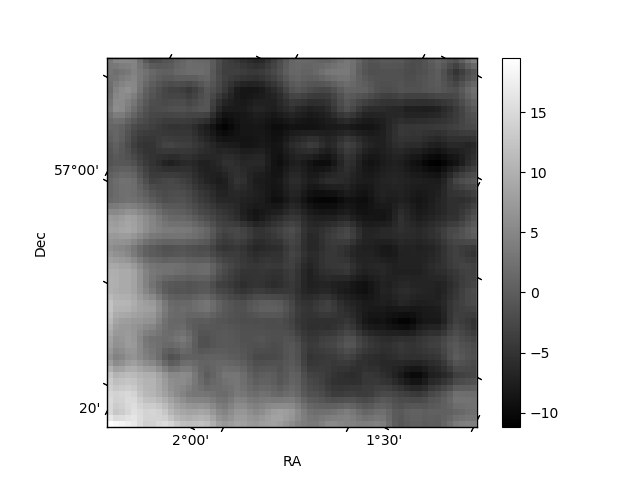
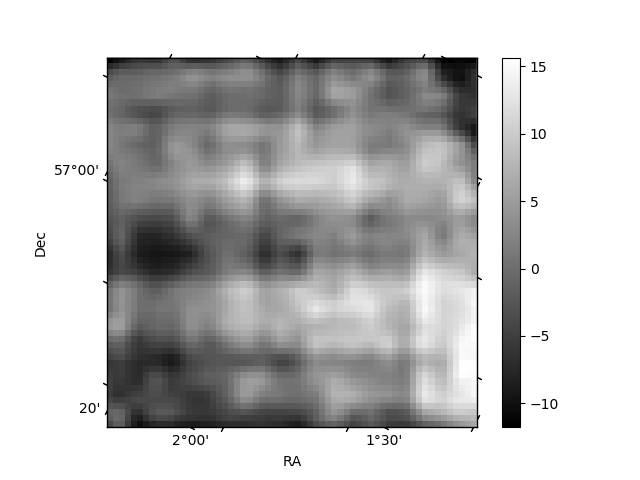
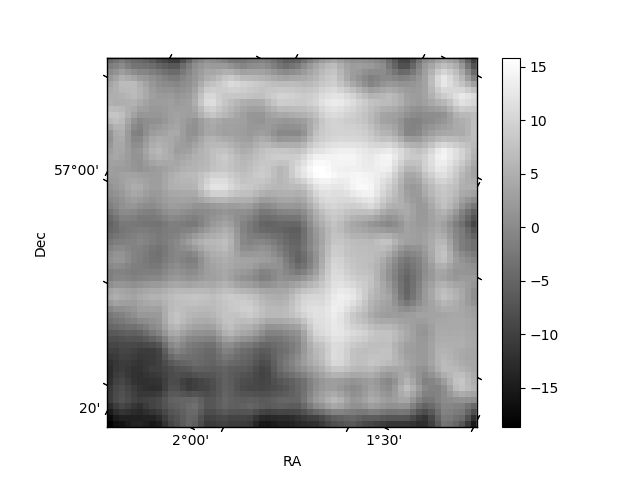
Histogram calculated using DETX and DETY for each event in the final _common_clean file
| Quadrant A | 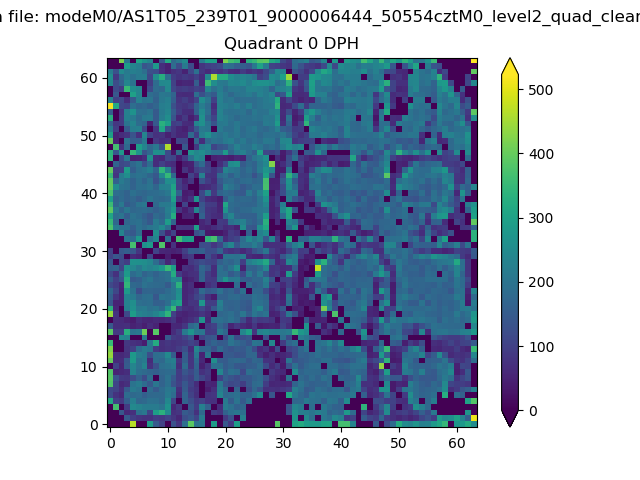 |
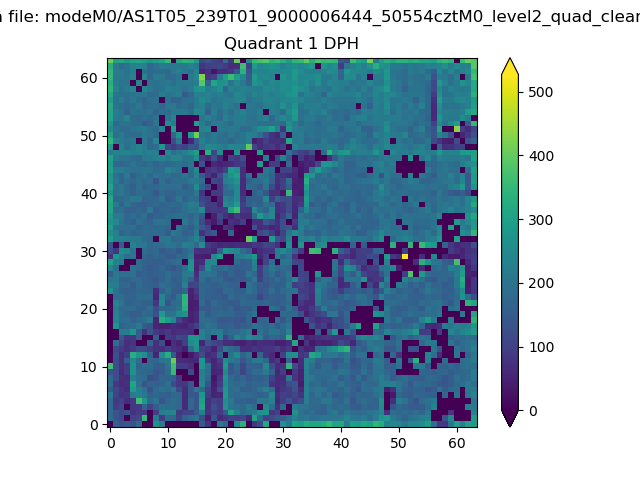 |
Quadrant B |
|---|---|---|---|
| Quadrant D | 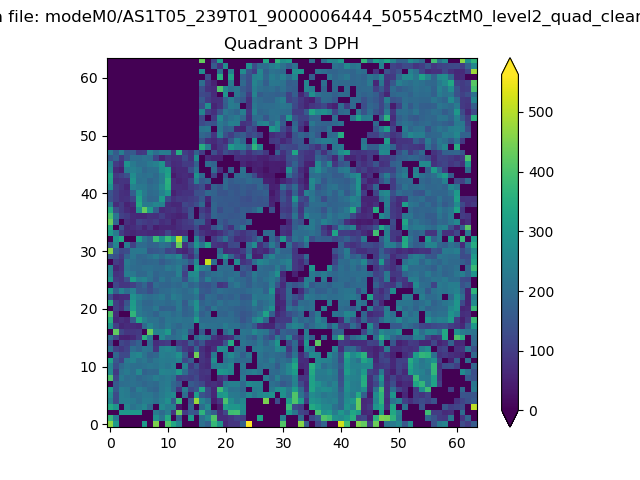 |
 |
Quadrant C |
| Plot type | Count rate plots | Images |
|---|---|---|
| Comparison with Poisson distribution Blue bars denote a histogram of data divided into 1 sec bins. Red curve is a Poisson curve with rate = median count rate of data. |
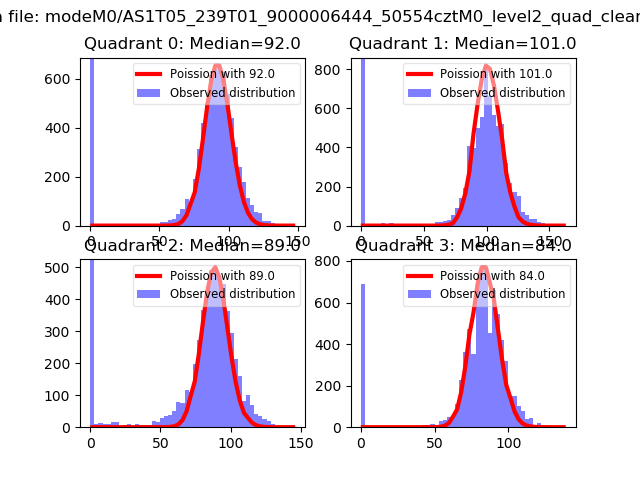 |
 |
| Quadrant-wise count rates Data is divided into 100 sec bins |
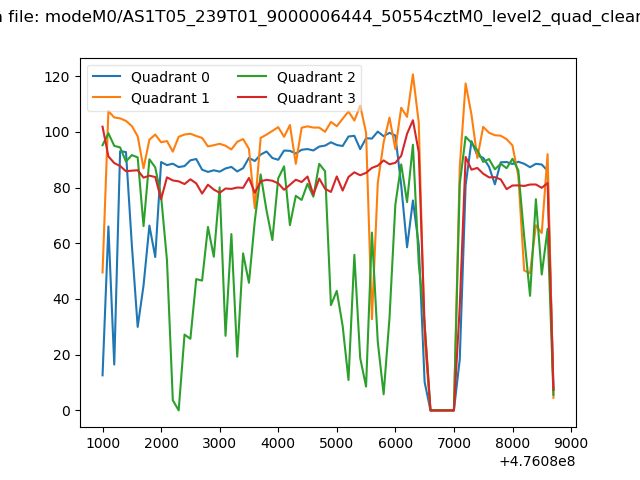 |
|
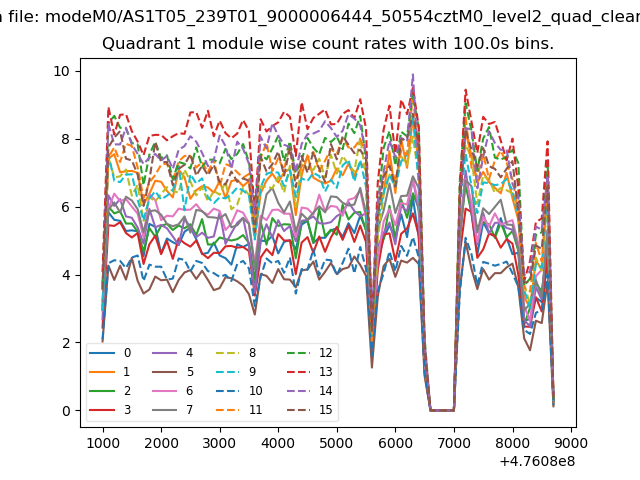
| Module-wise count rates for Quadrant A Data is divided into 100 sec bins |
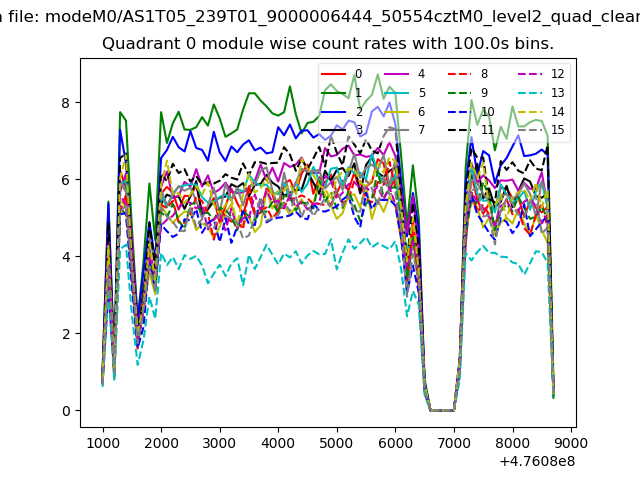 |
 |
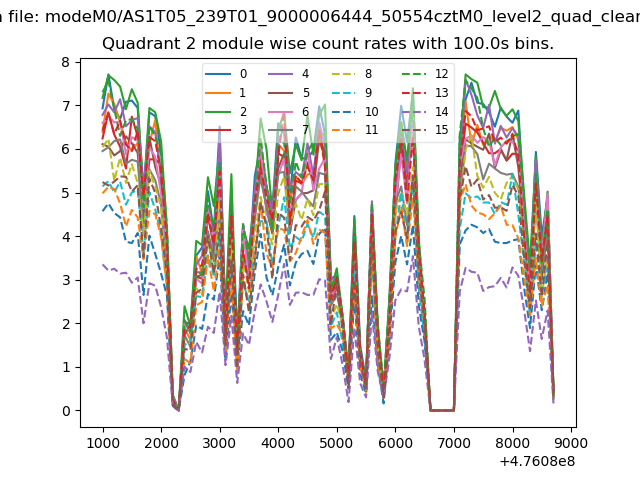
| Module-wise count rates for Quadrant B Data is divided into 100 sec bins |
 |
 |
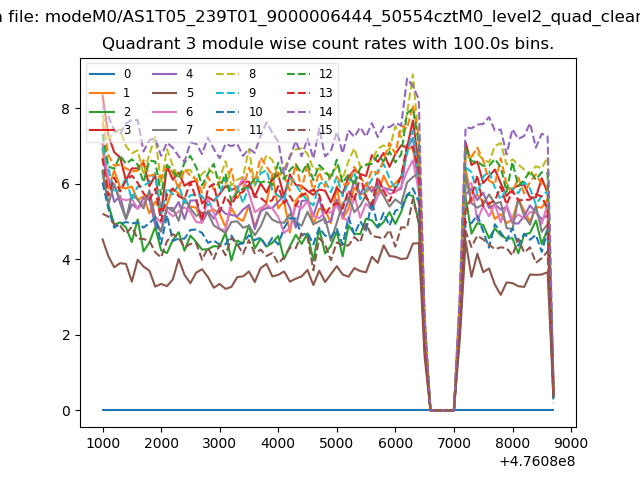
| Module-wise count rates for Quadrant C Data is divided into 100 sec bins |
 |
 |
| Module-wise count rates for Quadrant D Data is divided into 100 sec bins |
 |
 |
| Parameter | Plot |
|---|---|
| CZT HV Monitor | 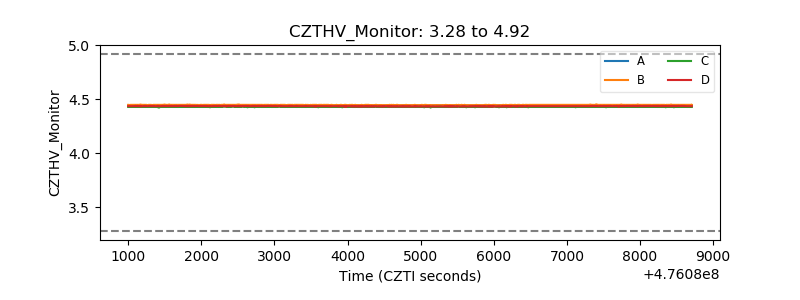 |
| D_VDD | 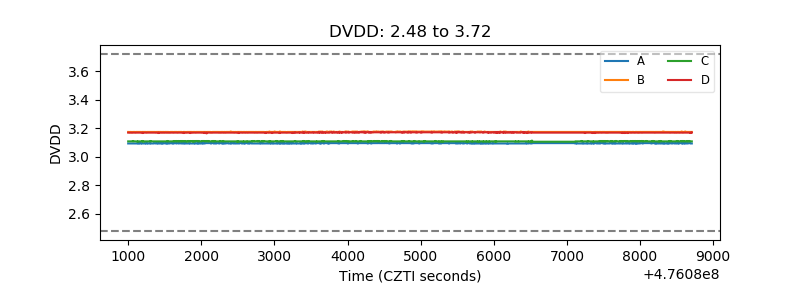 |
| Temperature 1 | 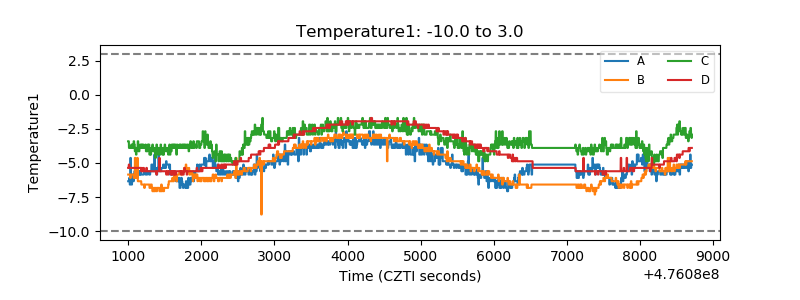 |
| Veto HV Monitor | 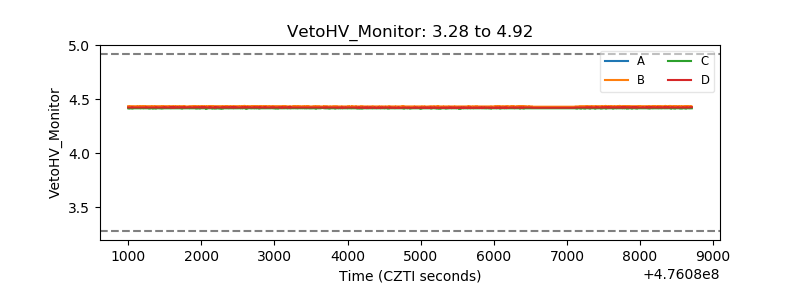 |
| Veto LLD | 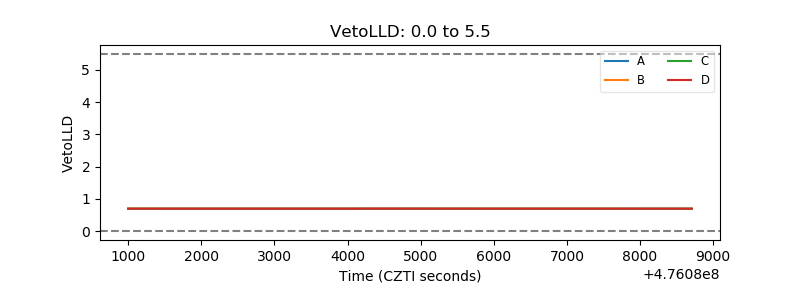 |
| Alpha Counter | 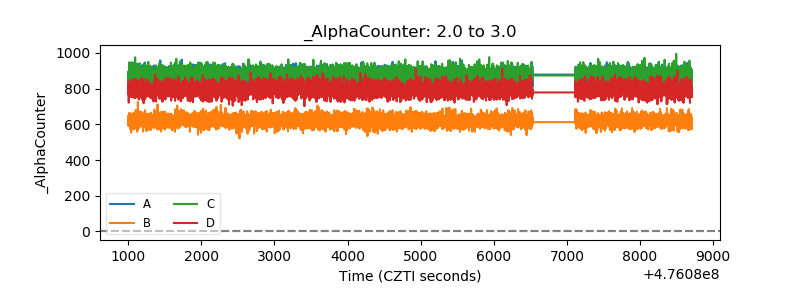 |
| _CPM_Rate | 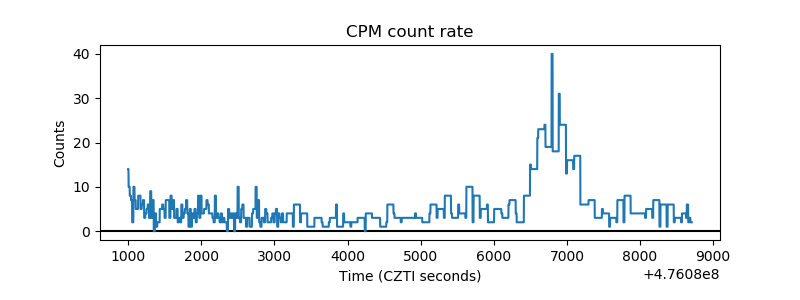 |
| CZT Counter | 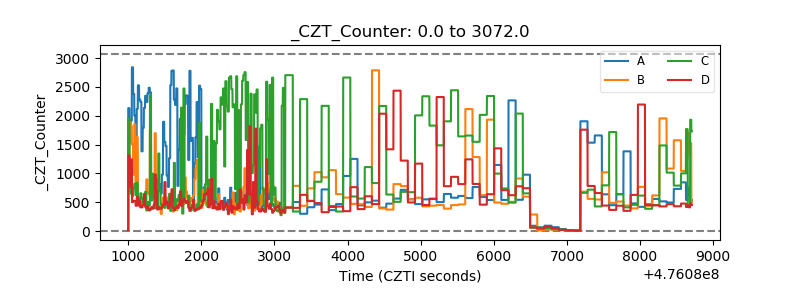 |
| +2.5 Volts monitor | 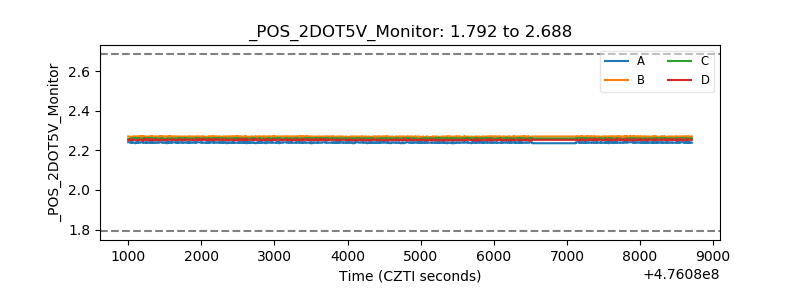 |
| +5 Volts monitor |  |
| _ROLL_ROT | 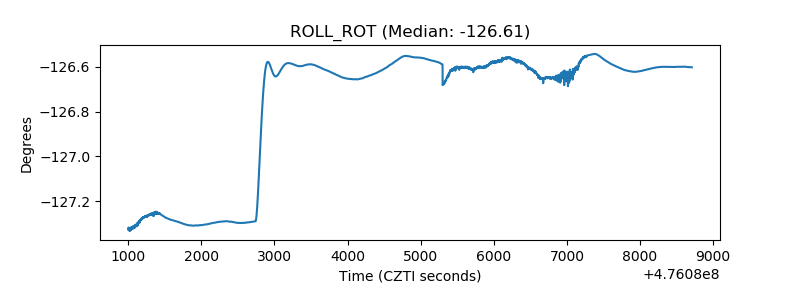 |
| _Roll_DEC | 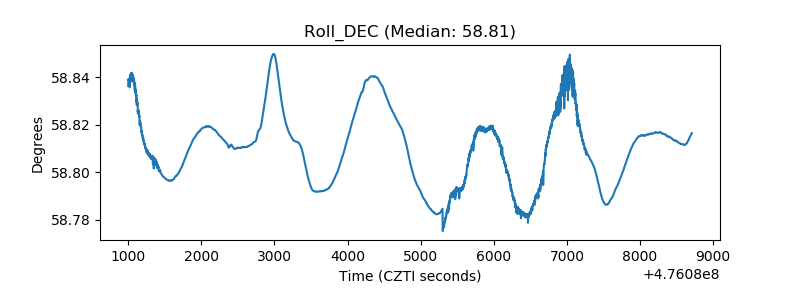 |
| _Roll_RA | 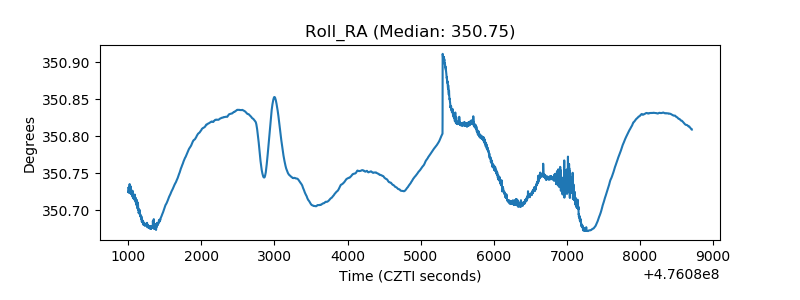 |
| Veto Counter | 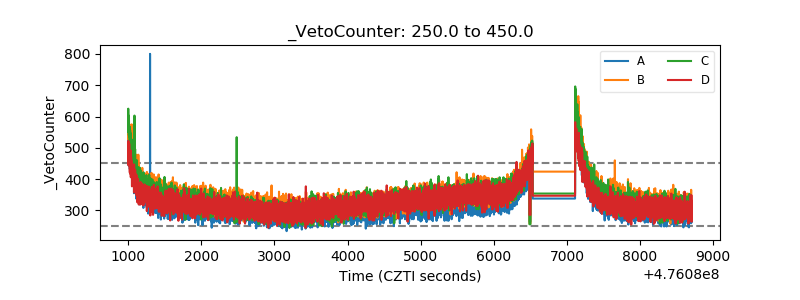 |